promoting access to White Rose research papers
White Rose Research Online
Universities of Leeds, Sheffield and York
http://eprints.whiterose.ac.uk/
This is a copy of the final published version of a paper published via gold open access
in
IET Renewable Power Generation.
This open access article is distributed under the terms of the Creative Commons
Attribution Licence (
http://creativecommons.org/licenses/by/4.0/
) which permits
unrestricted use, distribution, and reproduction in any medium, provided the
original work is properly cited.
White Rose Research Online URL for this paper:
http://eprints.whiterose.ac.uk/85767
Published paper
Al-Tubi, I.S., Long, H., Tavner, P.J., Shaw, B. and Zhang, J.S. (2015)
Probabilistic
analysis of gear flank micropitting risk in wind turbine gearbox using supervisory
control and data acquisition data
. IET Renewable Power Generation.
Probabilistic analysis of gear flank
micro-pitting risk in wind turbine gearbox using
supervisory control and data acquisition data
ISSN 1752-1416
Received on 12th September 2014 Accepted on 1st January 2015 doi: 10.1049/iet-rpg.2014.0277 www.ietdl.org
Issa Al-Tubi
1, 2, Hui Long
1, 2✉
, Peter Tavner
3, Brian Shaw
4, Jishan Zhang
41
Department of Mechanical Engineering, The University of Sheffield, Sheffield, S1 3JD, UK
2
State Key Laboratory of Mechanical Transmission, Chongqing University, People’s Republic of China
3
School of Engineering and Computing Sciences, Durham University, Durham, DH1 3LE, UK
4
Design Unit, University of Newcastle, Newcastle, NE1 7RU, UK
✉E-mail: h.long@sheffield.ac.uk
Abstract:This study investigates the probabilistic risk of gear tooth flank micro-pitting in wind turbine (WT) gearboxes and shows how relatively slow rate of supervisory control and data acquisition (SCADA) data, recorded during operation, can be used to analyse the onset of gear surface damage. Field measured time series of SCADA signals, including wind speed, generator power and rotational speed, were used to obtain the statistical variation of gear shaft torque and rotational speed. From the SCADA data obtained over a 2.2 year period random number datasets of smaller sizes were selected. Based on these random number datasets the effect of gear shaft torque and rotational speed variations on the probabilistic risk of gear micro-pitting was investigated. Determinations of the gear tooth flank contact stress and lubricant film thickness were based on the technical report of gear micro-pitting, ISO/TR 15144-1 (2010). The study has shown that the considered pinion gear is subjected to high load conditions resulting in high contact stresses. The variation of rotational speed causes greater sliding between the gear teeth. The results of specific lubricant film thicknesses have shown that there is considerable risk of gear micro-pitting under the operational conditions recorded from the SCADA field data.
1
Introduction
Reliability of wind turbines (WTs) has improved considerably in the past decades; however WT gearbox bearing and gear failures are still frequent, hindering the optimal operation of multi-megawatt WTs, increasing the cost of wind energy. Gear and bearing failures occur in all in-direct drive WT models and sizes suggesting systemic problems rather than solely manufacturing-related issues. During its service life, a WT is subjected to a wide array of highly
fluctuating and dynamic loading conditions caused by the stochastic nature of wind condition because of turbulent wind
fluctuations and subsequent turbine operational controls. For multi-megawatt WTs with variable speed control, these conditions make drive train loading conditions complex [1], which can lead to critical damage and shortened service life of key gearbox components, such as bearings and gears [2, 3].
Gear micro-pitting is a form of localised surface fatigue damage that occurs under rolling and sliding contact conditions when operating under elastohydrodynamic or boundary lubrication regimes. Micro-pitting damage is commonly observed in materials with a high surface hardness [4]. Compared with the size of the gear contact zone, the micro-pits are small and shallow with a size of about 5–10 µm long and 5–20 µm deep [5]. The occurrence of gear micro-pitting is influenced by many factors. Design and manufacturing factors are important, such as gear surface treatment, surface roughness, tooth profile modification and lubricant properties. However, operational factors, resulting from the variable load and speed conditions [6, 7], cause high contact stress, high and negative tooth surface sliding, high surface temperature, insufficient lubrication or disrupted lubrication conditions [8–10]. These contribute significantly to the occurrence of gear micro-pitting. Gearflank micro-pitting is one of the failure modes commonly observed in multi-megawatt WT gearbox gears [11–14]. Skriver [14] showed a number of examples of WT gear damage because of micro-pitting while Errichello [15] showed a
typical profile deviation of a damaged tooth flank of WT high speed shaft (HSS) pinion. Current WT gearbox designs follow mainly deterministic design methodologies where computational simulations are utilised to model WT operational conditions to consider the specified load cases defined by the International Electrotechnical Commission standards IEC 61400-1 (2005) [16] and newly published standard IEC 61400-4:2012 (E) (2012) [17]. However, because of the lack of measured WT field operational data, real loading conditions of the WT gearbox are difficult to obtain for consideration at the design phase.
Research has explored the application of supervisory control and data acquisition (SCADA) data as a condition monitoring (CM) tool using various approaches. Kimet al.[18] used SCADA data for WT fault detection by developing algorithms and diagnostic technique. The ratio of HSS torque to HSS speed against power shows that there is an observed fault at lower power level. Feng et al. [19] analysed SCADA data using simple physics models combined with CM system signals to predict WT gearbox failures. Wilkinsonet al. [20] used SCADA data for CM by developing a number of methods to detect the WT component failures. Zappalá
et al. [21] used vibration signals for WT gearbox fault detection and diagnosis by developing a side-band algorithm. Zaher et al.
[22] used SCADA data to detect WT gearbox faults using anomaly detection. Qiu et al. [23] detected pitch and converter system faults using time-sequence and probabilistic SCADA alarm analyses. Gray and Watson [24] also used SCADA signals to predict WT bearing failure using physics of failure approach. The comparison between artificial neural network, signal trending and physical model reveals that the physical model is the most accurate method in predicting imminent failure.
However, all these studies showed that SCADA signals had limited ability to detect the exact location and faulty components of the gearbox and their associated root causes. In addition SCADA signals could not be used to directly assess the performance of components for their intended function.
IET Renewable Power Generation
Furthermore, time series of SCADA signals only showed the relationships of generator power and generator speed to wind speed within the recorded period but did not present statistical characteristics of gearbox loading conditions for the design life of 20 years. SCADA signals have also been considered to have too slow data sampling rate to indicate the effect of fast changing WT load conditions. In a recent study, however, Milan, Matthias Wachter and Peinke [25] developed a new stochastic approach to model the power output of a wind farm at a sampling frequency of 1 Hz using only 10-min average values of wind speed and directions. Their results showed a good statistical agreement between the modelling and measured at sampling frequency of 1 Hz, including a proper reproduction of the intermittent and gusty features measured in the power curve.
Considering the importance of the stochastic nature of WT operation and unavailability of fast rate measurement of loading data to cover all seasonal effects, this study investigates probabilistic characteristics of the micro-pitting risk of an HSS pinion gear using SCADA data of 10-minute averaged values. The SCADA signals of wind speed, generator power output and rotational speed were collected fromfield operations of two WTs of variable speed, indirect drive and DFIG generator. These data werefiltered to exclude data samples when wind speed was below WT cut-in speed or there was no generator power output. The
filtered SCADA data was then used to derive probabilistic distributions of shaft torque and rotational speed of the gearbox HSS pinion gear.
To explore the potential of using the developed method for online monitoring of WT gear failures, 3000 random numbers of gear shaft torque and rotational speed were selected randomly from thefiltered SCADA data. The statistical differences between the filtered SCADA data and the random number datasets were compared. Based on the Technical Report of Gear Micro-pitting, ISO/TR 15144-1 (2010) [4] and International Standards of Gears, ISO 6336-1 (2006) [26] and ISO 6336-2 (2006) [27], the calculation of contact stress and lubricant film thickness was performed at different locations of the toothflank along the gear line of action. The effects of the shaft torque and rotational speed variation on potential risk of micro-pitting were assessed by investigating probabilistic characteristics of the gear contact stress and lubricant
film thickness.
2
SCADA data analysis and random number
generation
The SCADA data of 10-minute average used for this study was recorded over a period of 2.2 years from two operating WTs of megawatt scale in two different onshore wind farms. The WT gearbox has a three-stage design, a DFIG generator with a partially-rated converter and electric pitch-regulation. The gearbox has one planetary gear stage and two parallel gear stages and the HSS gears, pinion (driven) and wheel (driving), are studied in this paper. The recorded SCADA signals of wind speed, generator power output and generator rotational speed are used to analyse the data and to calculate the shaft torque of HSS pinion. The torque ratio of HSS pinion shaft, TRHSS pinion,iand the speed ratio
of HSS pinion shaft, SRHSS pinion, i, are determined by using (1)
and (2), respectively
TRHSS pinion,i= PGen,i
hGenhGearvGen,i
/ PGen, rated vGen, rated
(1)
SRHSS pinion,i= vGen,i
vGen, rated (2)
whereηGenandηGearare the efficiency of the generator and gearbox,
respectively. The combined efficiency of the generator and gearbox,
η=ηGen×ηGear, was estimated from the WT’s nominal electrical
power rating and rotor power rating, provided by the WT manufacturer.
The datasets of HSS pinion shaft torque and rotational speed, were derived from SCADA data recorded over two years filtered to remove data samples when wind speed was below WT cut-in speed or there was no generator power output or the average or the minimum generator power output within a 10-minute period was zero. Therefore standstill and zero power output conditions have effectively been excluded from the data studied. It is necessary to obtain torque and rotational speed histograms to determine gearflank contact stresses and lubricantfilm thicknesses for the assessment of the probability of micro-pitting risk. In addition, to explore the future potential application of using SCADA data for online monitoring of failure risk of mechanical components, this study investigates the use of smaller datasets which representing the same statistical characteristics of the SCADA data. The Mersenne Twister (MT) random number generator was proposed by Matsumoto and Nishimura in 1998 [28] as a strong uniform pseudorandom number generator. Thus the MT generator was used in this study to select smaller unique random datasets to represent the probabilistic properties of the SCADA datasets of HSS pinion shaft torque and rotational speed, respectively.
3
Probabilistic analysis of gear micro-pitting
The micro-pitting analysis is based on ISO/TR 15144-1 (2010) [4] considering important factors and associated parameters that contribute to micro-pitting occurrence. The gear tooth flanks are subjected to varying loading and rotational speed conditions that cause variation of contact stress and lubricant film thickness. Insufficient lubricant film thickness correlates with high contact stresses and high local contact temperatures of gear tooth flank. The variations of these parameters are used to assess the micro-pitting risk as they significantly influence the occurrence of micro-pitting damage. The specific lubricant film thickness, defined as the ratio between the lubricantfilm thickness and the effective mean surface roughness of gear teeth, are used in this study to assess the probability of micro-pitting failure.
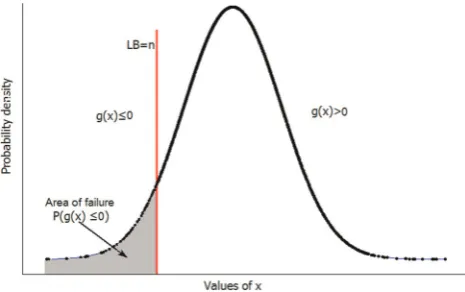
Letxrepresents the random variable of the specific lubricantfilm thickness. A lower limit state function,g(x), can be defined as
g(x)=x−n (3)
wherenis a known lower boundary (LB) limit value ofx,g(x) > 0 denotes the safe region without the probability of micro-pitting failure. The probability of failure, Pf , occurs when the random
variable xis equal to or less than the limit value n, as shown in (4) and illustrated in Fig. 1. For illustration, the probability density function of random variable x is represented as the Gaussian distribution. The risk of micro-pitting failure may be reduced by ensuring that the specific lubricant film thicknessxis greater than
[image:3.595.315.548.610.756.2]the LB value,n, by reducing the effective mean surface roughness
Pf=P(g(x)≤0) (4)
The probabilistic analysis procedure of WT gear micro-pitting is outlined in the following steps:
1. Use the SCADA data to derive the datasets of HSS gear shaft torque and rotational speed andfilter out the data samples when there is no power generation from the WT during starting up or standing still period.
2. Use a suitable random number generator to generate smaller randomly selected datasets of gear shaft torque and rotational speed variations which representing the same statistical properties of thefiltered SCADA data.
3. Derive the probability distributions of the HSS gear shaft torque and rotational speed in the form of a histogram.
4. Calculate the HSS gear contact stress and lubricantfilm thickness as well as other parameters required using the smaller randomly selected datasets.
5. Determine the probability distributions of the variations of the contact stress and lubricantfilm thickness in the form of a histogram. 6. Using the histogram of a specific parameter, such as the specific lubricant film thickness in this study, identify the failure region resulting in micro-pitting using the LB value recommended by the international standards.
The above probabilistic analysis procedure is used to evaluate gear micro-pitting risk from key parameters considering effects of random variations of gear shaft torque and rotational speed. This procedure can be used for any parameter, such as contact stress or lubricant
film thickness, to determine the probabilistic characteristics of the parameter and to identify their contribution to micro-pitting.
4
Micro-pitting analysis of wind turbine gearbox
This paper investigates the probability of micro-pitting risk of the HSS gear of a three-stage WT gearbox. The gear parameters and material of the HSS pinion gear (driven) and lubricant type used in the calculations are given in Table 1 and more details are provided in [28]. The gear module is defined as the ratio of the pitch diameter divided by the number of teeth of the gear.
The gear contact stress and lubricantfilm thickness are determined based on Method B as recommended in the Technical Report of Gear Micro-pitting ISO/TR 15144-1 (2010) [4]. The local Hertzian contact stress, Pdyn,Y, along the path of contact is determined
according to (5). The local lubricant film thickness, hY, can be
determined by (6). The subscript Y refers to a specific contact point (A, B, C, D or E) on toothflank, which will be illustrated in the diagram of results. The torque ratios of 3000 random numbers derived fromfiltered SCADA generator power and speed are used to calculate the gear transverse tangential load,Ft, as shown in (5).
The loading factors,KA,KV, KHβand KHαmay be determined by
considering specific loading conditions and geometrical dimensions of the gears, using recommended values given in the datasheets, according to ISO 6336-1 standard (2006) [26]. The local Hertzian contact stress is used to determine the load parameter, WY, shown in (6). The speed ratios of 3000 random
numbers derived from SCADA generator speed data are used to
determine the velocity parameter,UY, as given in (6). More details
regarding the calculation method can be found in the ISO/TR 15144-1 (2010) [4] and Al-Tubi and Long (2012) [29]
Pdyn,Y =ZE
FtXY
brt,Y cosatKAKVKHaKHb
(5)
hY =1600rt,Y G0M.6UY0.7WY−0.13S0GF,.22Y (6)
The specific lubricantfilm thickness,lGF,Y, is dimensionless and it is
defined as the ratio of the lubricant film thickness, hY and the
effective mean surface roughness, Ra, of gear teeth, as shown in
(7). The micro-pitting safety factor,n, may be defined as the ratio of the minimum specific lubricant film thickness,lGF,minand the permissible lubricantfilm thickness,lGFP, as shown in (8)
lGF,Y = hY
Ra (7)
n=lGF,min
lGFP ≥ nmin (8)
The contact stress and lubricantfilm thickness at different locations of toothflank along the line of action, at points A, B, C, D and E, are calculated. These locations are selected based on the suggestion of ISO/TR 15144-1 (2010) [4] where the maximum load occurs at the region where single tooth pair contact occurs. The maximum sliding between gear teeth occurs in mesh-in, point A and mesh-out, point E because of the radius of relative curvature of gear teeth is the smallest in these regions.
5
Results and Discussion
5.1 Variations of torque and rotational speed using SCADA data
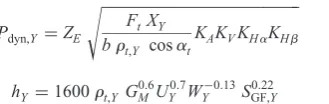
Two different WTs, WT1 and WT2, located at two different onshore wind farms, were selected to illustrate the different wind conditions the WTs being subjected to and its effect on the shaft torque and speed variation. Figs. 2aandbshow the histogram of HSS pinion shaft torque ratio of the two WT gearboxes, respectively, the wind distribution of each WT site is also provided. Histograms of rotational speed ratio of the HSS pinion shaft are shown in Fig. 3.
Torque ratio histograms obtained from thefiltered SCADA data shown in Figs. 2a and b are compared with that obtained by computational simulation shown in Fig. 2c, reported by Greaves
et al.[30]. In their work, the simulations considered all the fatigue load cases defined in the International Standard IEC 61400-1 (2005) [16], with wind simulations of strong gusts and 3D turbulent wind conditions chosen according to the appropriate WT design standard of IEC 61400-1 (2005) [16] and the Guideline for the certification of WTs by Germanischer Lloyd (2003) [31]. The load case histogram based on computational simulation provides a benchmark to compare with the torque ratio histogram derived from thefiltered SCADA data of 2.2 years used in this study.
[image:4.595.358.523.95.147.2]Figs. 2 and 3 show that WT1 and WT2 have similar probabilistic distributions of HSS pinion shaft torque and rotational speed, and the gearboxes operate at the rated torque and rated rotational speed for most of the time, as expected. The torque ratio histogram of WT1 based on the filtered SCADA data of the 2.2 years period is similar to the simulated load distribution of 25 year’s design life based on the suggested load cases by the design standard of IEC 61400-1 (2005) [16] and the Guideline for the certification of WTs by Germanischer Lloyd (2003) [31] using GH Blade software [30]. However, the torque ratio histograms of thefiltered SCADA data show occurrences above the rated torque ratio for both WTs, indicating a probability of high loads. Furthermore, the torque ratio histogram of WT1 and WT2 shows a different distribution, confirming that the wind farm and WT location contribute to the
Table 1 HSS pinion gear parameters
Parameters HSS pinion gear (driven)
no. of gear teeth 23
gear module 7 mm
nominal pitch line velocity velocity
15.2 m/s
material case hardened wrought steels (ME) grade
loading variation. Comparing Figs. 2aandb, it shows that WT2 may experience higher loads than WT1 because there are occurrences of higher torque ratios in WT2 histogram. To illustrate the variation of generator speed and its effect on the calculated generator torque, as a result of combined wind speed variation and turbine control effects, Fig. 4 shows curves of WT1 generator speed against wind speed, and calculated generator torque against wind speed, using the filtered SCADA data of 2.2 years. The red triangular marks outline the manufacturer’s steady-state curves of generator speed and generator torque, respectively. It is clear that there are considerable generator speed variations, especially in the wind speed range of 5∼11 m/s and up to 15 m/s, scatter data around the steady-state control curve, as shown in Fig. 4a. This is expected from the turbine’s power maximisation control in a turbulent wind condition. As a result, the large variation of generator speed causes occurrences of high torque loads in this speed range. The WT manufacturer has confirmed this experience of turbulent wind conditions at these WT sites. It is also in line with thefinding of Milanet al., [25] that a stochastic modelling of power curve using 10-min average wind
speed values has showed a good statistical agreement with that measured power curve by using high sampling frequency of 1 Hz, including a proper reproduction of the intermittent, gusty features because of turbulent windfluctuations [25].
5.2 Variations of torque and rotational speed using random numbers
From the filtered SCADA data of WT1, 3000 data samples were randomly selected to represent the variations of HSS pinion shaft torque ratio and rotational speed ratio, respectively, using the MT generator. For comparison, 1000 random numbers of both torque ratio and rotational speed ratio were also generated. The histograms derived from thefiltered SCADA data shown in Figs. 2 and 3 can be compared with histograms derived from 3000 random data samples as shown in Fig. 5. Details of the comparison between the datasets of the SCADA data and the random numbers are given in Table 2.
Fig. 2 Comparison of torque histograms derived fromfiltered SCADA data and simulation
aSCADA HSS torque ratio and wind distribution (WT1)
bSCADA HSS torque ratio and wind distribution (WT2)
[image:5.595.109.494.52.523.2]The datasets of the HSS pinion shaft torque ratio and rotational speed ratio were divided into three ranges of torque ratio and speed ratio, respectively, as shown in Table 2. This allows the comparison of statistic similarities between the datasets offiltered SCADA data and random numbers. The upper and lower limits of the three ranges have been chosen based on the data distribution similarities in terms of clustering and dispersion. Using clustering the data samples are classified into groups or ranges (clusters) based on the patterns of its statistical distribution, while the dispersion measures the variance of a set of data samples scattering from its mean value. Table 2 shows the corresponding percentages of occurrences of WT1 HSS pinion shaft torque ratio and rotational speed ratio in the chosen three ranges, respectively.
When comparing the filtered SCADA data with 3000 randomly selected data samples, it is clear that the statistical differences in occurrences for both shaft torque ratio and rotational speed ratio are very small for all ratio ranges, as detailed in Table 2. The datasets of 3000 random numbers have a closer approximation of the filtered SCADA data than that of 1000 random numbers, thus 3000 random numbers will be used in the probability analysis of gearflank micro-pitting in the following sections.
5.3 Effect of contact stress variation on gear toothflank
Using the 3000 randomly selected data samples of HSS pinion shaft torque and rotational speed, the contact stress results atfive contact
Fig. 3 Histograms of HSS pinion speed ratio derived fromfiltered SCADA data
aWT1 gearbox
bWT2 gearbox
Fig. 5 Histograms of 3000 randomly selected data samples aHSS pinion shaft torque ratio (WT1)
bHSS pinion shaft rotational speed ratio (WT1)
Fig. 4 Generator power, speed and derived torque fromfiltered SCADA data of 2.2 years (WT1)
aGenerator speed against wind speed
[image:6.595.326.534.50.344.2] [image:6.595.47.283.53.344.2] [image:6.595.80.515.550.737.2]points of gear toothflanks are obtained asfive histograms shown in Fig. 6. The narrow spike at the right-hand side end of each histogram indicates the high contact stresses at the specific contact point of gear toothflank, A, B, C, D and E as shown. In contrast, low contact stresses occur in a broader spectrum of stress values shown in the histograms. For example, the contact stresses at point D vary from 1187 to 1731 N/mm2 covering a wide spectrum, but with a high probability of occurrence within a narrow range from 1590 to 1625 N/mm2. The histograms of contact stresses and HSS pinion torques have similar distributions and are clustered when the shaft torque being at the rated value. As shown in Fig. 6, the maximum contact stresses occur at point D (below the tooth pitch line), and the minimum values occur at point A (at the tooth tip) because of the load sharing between two pairs of gear teeth in contact. The allowable contact stress for material quality grade ME is 1650 N/ mm2, taken from ISO 6336-5 [32]. About 0.23% of contact stress values are higher than the allowable material stress for the total of 3000 random numbers used in the calculation of contact stresses. This small percentage occurs when the turbine operates using power maximisation control in a turbulent wind condition, causing high generator loads, as shown in Fig. 4b.
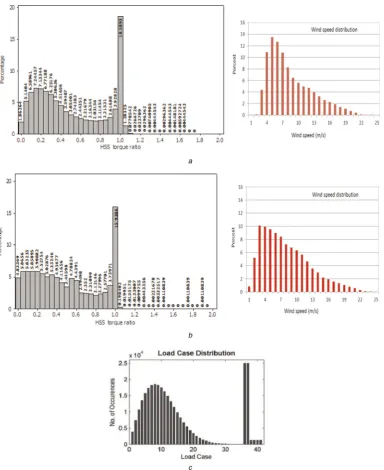
5.4 Effect of local lubricantfilm thickness variation on gear toothflank
The calculation of local lubricantfilm thickness, Fig. 7, shows that the worst lubrication condition occurs at point E where its value is at the lowest, among allfive contact points along the gear contact path. The minimum lubricantfilm thickness of point E reduces to 0.3 µm. The minimum lubricantfilm thickness occurs where high contact stress, greater sliding and high local contact temperature happen. The risk of micro-pitting increases greatly where the local lubricantfilm thickness is small, occurring on the dedendum area of gear tooth. The maximum lubricant film thickness occurs at point A (at the tooth tip) because of much lower contact stress
values in this region (Fig. 6). The stress level of gear toothflank is a determinant factor of gear micro-pitting initiation; however, the number of stress cycles also contributes to the initiation and progression of micro-pitting. This has been investigated in an experimental study by the authors however this research focuses on the investigation of the effect of statistical variations of loading and speed on gear micro-pitting.
5.5 Effect of gear surface roughness on micro-pitting risk
[image:7.595.315.546.54.193.2]Equation (7) may be used to determine the specific lubricant film thickness if the surface roughness of meshing gears is known. The specific lubricantfilm thickness can be increased by reducing the surface roughness of meshing gear teeth. WT gears require high accuracy and smooth tooth surface finishing to ensure sufficient load capacity and to achieve required service cycles. Such a smooth surface is one of the most important factors in micro-pitting resistance (IEC 61400-1 [16] and IEC 61400-4 [17]). It is recommended in IEC 61400 that the maximum mean surface roughness for WT HSS gears should be equal to or less than 0.7 µm. The safety factor against gear micro-pitting may be defined as the ratio between the minimum specific lubricantfilm thicknesses and the permissible specific lubricant film thickness as given by (8). Currently there are no recommended values of the required minimum safety factor for WT gearbox applications. However, according to Kissling [33] the range of micro-pitting safety factor is defined by rating the risk at three levels: the high risk, limited risk and low risk, as detailed in Table 3.
Fig. 8 shows the histograms of specific lubricantfilm thickness at thefive contact points using the mean surface roughness value of 0.7 as the maximum value recommended by the IEC. It reveals that all values of specific lubricantfilm thickness at point E is below the
Table 2 Comparisons of different datasets of WT1
Torque ratio range
>60 000 data samples from filtered SCADA, %
3000 data samples randomly selected, %
1000 data samples randomly selected, %
0–0.54 59 58 58.2
0.541–0.94 18.1 19.3 17.8
0.941–1.7 22.9 22.7 24
Speed ratio range
>60 000 data samples from filtered SCADA, %
3000 data samples randomly selected, %
1000 data samples randomly selected, %
0.53–0.63 21.6 20.7 21.6
0.631–0.93 32.9 32.5 30.1
0.931–1.1 45.5 46.8 48.3
Fig. 7 Histograms of local lubricantfilm thickness at 5 contact points on gear toothflank
Fig. 6 Histograms of contact stress at 5 contact points on gear toothflank
[image:7.595.40.286.71.206.2] [image:7.595.316.547.602.745.2] [image:7.595.50.282.617.758.2]limit value n≤1.0 indicating a high risk of micro-pitting at this region of gear tooth flank, according to the values defining micro-pitting risk given in Table 3.
By reducing the maximum mean surface roughness of gear teeth from 0.7 to 0.3 µm a considerable change is shown in the value of specific lubricantfilm thickness, Fig. 9. It reveals the spectrum of specific lubricant film thickness variation at point E shifts from <1.0 to higher values thus reduces the probability of failure from the high risk to the limited risk. By reducing the maximum mean surface roughness of gear teeth from 0.7 to 0.3 µm, the probability of micro-pitting risk at point E has significantly reduced, as can be seen by comparing Figs. 8 and 9.
The high risk of micro-pitting at point E of gear toothflank is caused by the high torque ratios which cause high contact stresses on the dedendum of gear tooth flank. The combination of high torque and variation of shaft rotational speed also causes low lubricantfilm thickness and its considerable variation during each gear meshing cycle. It is also worth mentioning that the current study has not considered any gear tooth profile modification such as tip relief and crowning which can help to reduce gear micro-pitting risk.
6
Conclusions
This study presents a probability analysis of gear tooth flank micro-pitting risk by using recorded SCADA data of WTs infield operation. The 3000 random numbers were selected from the
filtered SCADA data to assess the variation of HSS pinion gear tooth contact stress and lubricant film thickness. Based on the results obtained from this study, the following conclusions may be drawn:
1. High torque ratios may occur when the WT operates under turbulent wind conditions while using power maximisation control, causing a great variation of generator speed resulting in high generator torques.
2. The variation of shaft torque and rotational speed contributes to a high risk of gearflank micro-pitting, because of high contact stresses and tooth surface sliding, resulting in low lubricantfilm thicknesses.
3. Calculation of the specific lubricantfilm thickness has shown a high micro-pitting risk when the maximum mean roughness of gear teeth of 0.7 µm is used, recommended by IEC 61400. 4. Even with a reduced gearflank surface roughness, up to 0.3 µm, limited risk of micro-pitting still prevails. The high probability of micro-pitting risk is on the gear toothflank dedendum.
7
Acknowledgment
The authors would like to acknowledge the support from EPSRC (EP/F061811/1) for project ‘Future reliable renewable energy conversion systems and networks’ and Visiting Fellowship from the State Key Laboratory of Mechanical Transmission, Chongqing University, China for project ‘Development of advanced design methodologies for WT gearboxes’.
8
References
1 Wang, Y., Infield, D.: ‘Supervisory control and data acquisition data-based non-linear state estimation technique for wind turbine gearbox condition monitoring’,IET Renew. Power Gener., 2013,7, (4), pp. 350–358
2 Lacava, W., Xing, Y., Marks, C., Guo, Y., Moan, T.:‘Three-dimensional bearing load share behaviour in the planetary stage of a wind turbine gearbox’,IET Renew. Power Gener., 2013,7, (4), pp. 359–369
3 Dong, W., Xing, Y., Moan, T., Gao, Z.:‘Time domain-based gear contact fatigue analysis of a wind turbine drivetrain under dynamic conditions’,Int. J. Fatigue, 2013,48, pp. 133–146
4 ISO/TR 15144–1:2010:‘Calculation of micro-pitting load capacity of cylindrical
spur and helical gears: introduction and basic principles’ (BSI Standard
Publication, 2010), pp. 1–56
5 Zhang, J.:‘Influence of shot peening and surfacefinish on the fatigue of gears’. PhD thesis, University of Newcastle, UK, 2005
6 Long, H., Lord, A.A., Gethin, D.T., Roylance, B.J.:‘Operating temperatures of oil-lubricated medium-speed gears: numerical models and experimental results’,
Proc. of the I MECH E G: J. Aerosp. Eng., 2003,217, (2), pp. 87–106 7 Long, H., Zhang, G., Luo, W.:‘Modelling and analysis of transient contact stress
and temperature of involute gears’,Chin. J. Mech. Eng., 2004,40, (8), pp. 24–29 8 Dawson, P.H.: ‘Effect of metallic contact on the pitting of lubricated rolling
surface’,J. Mech. Eng. Sci., 1962,4, (1), pp. 16–0
9 Kleemola, J., Lehtovaara, A.:‘Experimental simulation of gear contact along the line of action’,Tribology International, 2009,42, (10), pp. 1453–1459
10 Wang, K.L., Cheng, H.S.: ‘A numerical solution to the dynamic load,film
thickness and surface temperatures in spur gears, Part II: results’,Trans. ASME, J. Mech. Des., 1981,103, pp. 188–194
11 McNiff, B.P., Musial, W.D., Errichello, R.:‘Variations in gear fatigue life for different wind turbine braking strategies’. AWEA Wind Power’90, USA, 1991 12 Errichello, R., Muller, J.:‘Application requirements for wind turbine gearboxes’.
National Renewable Energy Laboratory, US, NREL/TP-442-7076, 1994, pp. 1–56 13 Sheng, S.:‘Wind turbine micro-pitting: a recap’. Report Number: NREL/TP-500–
46572, Golden, CO., NREL, USA, 2010, pp. 1–52
14 Skriver, S.:‘Determining a strategy for managing gearboxes and spare parts’. Wind Farm O&M, Glasgow, UK, 2010, pp. 1–23
15 Errichello, R.L.:‘Morphology of micro-pitting’,Gear Technol., 2012,11–12, pp. 74–81
16 IEC 61400–1:‘Wind turbines–Part 1: design requirements’. Int. Electrotechnical Commission, Geneva, Switzerland, 2005
17 IEC 61400–4:2012 (E):‘Wind turbines–Part 4: design requirements for wind turbine gearboxes’. Int. Organization for Standardization, Geneva, Switzerland, 2012 18 Kim, K., Parthasarathy, G., Uluyol, O., Foslien, W., Shuangwen, S., Fleming, P.:
‘Use of SCADA data for failure detection in wind turbines’. Energy
Sustainability and Fuel Cell Conf., Washington, National Renewable Energy Laboratory, USA, 2011, pp. 1–9
19 Feng, Y., Qiu, Y., Crabtree, C.J., Long, H., Tavner, P.J.:‘Condition monitoring wind turbine gearboxes’,Wind Energy, 2013,16, (5), pp. 728–740
20 Wilkinson, M., Darnell, B., Delft, T.V., Harman, K.:‘Comparison of methods for wind turbine condition monitoring with SCADA data’. EWEA Wind Energy Conf., Vienna, 2013
21 Zappalá, D., Tavner, P.J., Crabtree, C.J., Sheng, S.: ‘Side-band algorithm for automatic wind turbine gearbox fault detection and diagnosis’, IET Renew. Power Gener., 2014,8, (4), pp. 380–389
22 Zaher, A., McArthur, S.D.J., Infield, D.G., Patel, Y.:‘Online wind turbine fault detection through automated SCADA data analysis’,Wind Energy, 2009,12, (6), pp. 574–593
23 Qiu, Y., Feng, Y., Tavner, P., Richardson, P., Erdos, G., Chen, B.:‘Wind turbine SCADA alarm analysis for improving reliability’,Wind Energy, 2012,15, (8), pp. 951–966
24 Gray, C.S., Watson, S.J.:‘Physics of failure approach to wind turbine condition based maintenance’,Wind Energy, 2009,13, (5), pp. 395–405
25 Milan, P., Wachter, M., Peinke, J.: ‘Stochastic modelling and performance
monitoring of wind farm power production’,J. Renew. Sustain. Energy, 2014,6, pp. 033119
[image:8.595.43.286.65.300.2]26 BS ISO 6336–1:‘Calculation of load capacity of spur and helical gears Part 1: basic principles-introduction and general influence factors’, 2006, pp. 1–109 Table 3 Micro-pitting safety factor (Kissling, 2012) [33]
Factor of safety Risk rating
n< 1 high risk
1≤n≤2 limited risk
n> 2 low risk
27 BS ISO 6336–2:‘Calculation of load capacity of spur and helical gears calculation of surface durability (Pitting)’, 2006, pp. 1–42
28 Matsumoto, M., Nishimura, T.: ‘Mersenne twister: a 623-dimensionally
equidistributed uniform pseudorandom number generator’,ACM Trans. Model. Comput. Simul., 1998,8, (1), pp. 3–30
29 Al-Tubi, I.S., Long, H.: ‘Prediction of wind turbine gear micro-pitting
under variable load and speed conditions using ISO/TR 15144–1
(2010)’, Proc. Inst. Mech. Eng. C: J. Mech. Eng. Sci., 2013, 227, (9),
pp. 1898–1914
30 Greaves, P., Dominy, R.G., Ingram, G.L., Long, H., Court, R.:‘Evaluation of dual-axis fatigue testing of large wind turbine blades’,Proc. Inst. Mech. Eng. C J. Mech. Eng. Sci., 2011,226, (7), pp. 1693–1704
31 Guideline for the certification of wind turbines. Hamburg: Germanischer Lloyd Industrial Services, 2003
32 BS ISO 6336–5:‘Calculation of load capacity of spur and helical gears Part 5: strength and quality of materials’, 2003, pp. 1–43

![Table 3Micro-pitting safety factor (Kissling, 2012) [33]](https://thumb-us.123doks.com/thumbv2/123dok_us/7865442.180960/8.595.43.286.65.300/table-micro-pitting-safety-factor-kissling.webp)
