Financial report 1999
144
0
0
Full text
(2)
(3) EUROPEAN UNION. FINANCIAL REPORT. 1999.
(4) A great deal of additional information on the European Union is available on the Internet. It can be accessed through the Europa server (http://europa.eu.int). Cataloguing data can be found at the end of this publication. Luxembourg: Office for Official Publications of the European Communities, 2000 ISBN 92-828-9491-6 © European Communities, 2000 Reproduction is authorised provided the source is acknowledged. Printed in Belgium.
(5) FOREWORD Negotiations on Agenda 2000. for which the Commission had made a whole series of' legislative and financial proposals since 1997. were completed in 1999. The scope of these negotiations was wide-ranging and complex, since new guidelines had to be formulated tbr two Community policies — the common agricultural policy and the cohesion policy — which dominate the budget. These had to be reconciled with the impact of the future enlargement of the Union and the demands of budget discipline within a medium-term perspective, stretching to 2006. while also addressing the problem of dividing costs between the Member States. The agreement reached at the Berlin European Council in March marked a new stage in the reform of the common agricultural policy, which started in 1992 with the aim'of avoiding fresh surpluses, which would be increasingly difficult to dispose of. and of embarking on the next series of WTO negotiations in ideal conditions. Another objective of' the reform is to accompany market organisation measures with a stronger and more uniform set of measures to boost rural development. The reform of structural operations draws on the results of'the cohesion policy which was introduced in 1988 and for which the allocations have increased considerably over the last 10 years. The new guidelines agreed aim to concentrate aid by reducing the proportion of the population eligible and the number of objectives to be assisted and to simplify the management rules. Most of the countries covered by future enlargements of the European Union will still lag far behind the current Community average in terms of economic structures and levels of income. It has therefore been decided to introduce pre-accession aid for applicant countries to support the adjustment programmes they will have to implement, to take over the body of Community law. On this basis the Council, the European Parliament and the Commission reached agreement on a new financial framework for 2000-06. The ceiling fixed lor the increase in total expenditure is substantial!)' lower than the own resources ceiling of 1.27 CA of the European Union's GNP. Some of the margin still available has been earmarked to cover any enlargement-related costs which arise during this period. While the current own resources ceiling has thus been retained, changes have been made to the system for financing the budget to ensure a more balanced division of'costs between the Member States. The 1999 budget — which this report covers — was the last under the financial perspective adopted at the Edinburgh European Council for 1993 onwards. The debate leading up to ils adoption was therefore also influenced by the discussions on preparations lor the next programming period..
(6) Compared with the previous year, commitment appropriations increased by 6.91 % and payment appropriations by 2.43 %, reaching a level of 1.10 % of GNP which left a comfortable margin under the own resources ceiling of 1.27 %. This increase was largely accounted for by the increase in allocations for structural operations in accordance with the timetable laid down and following the transfer of appropriations not used in previous years. The increase was far more modest in the other headings, with priority being given to trans-European networks and research under the internal policies heading and, as regards external action, to strengthening the Phare programme in anticipation of an expansion of the pre-accession strategy. In 1999 a number of supplementary and amending budgets (five) had been necessary for financing the needs coming up during the year. The amending budgets were mainly intended to finance the start of aid for the reconstruction of Kosovo after the Balkans crisis and new administrative expenditure (e.g. the appointment of a High Representative for the Common Foreign and Security Policy in the Council and the establishment of a European Anti-Fraud Office independent of the Commission). Finally, the budgetary year 1999 ended with a surplus of EUR 3.2 million, which led to less finances needed for the European budget in the year 2000 than was foreseen at the Berlin Summit — so, good news for the ministers of finance and the taxpayers of the Union.. '^Ä Michaele SCHREYER Member of the Commission with responsibility for budgetary affairs.
(7) CONTENTS. Page Economic and financial framework. Revenue. 15. Expenditure. 20. Heading 1 — Agricultural market guarantees. 20. Heading 2 — Structural operations. 32. Heading 3 — Internal policies. 38. Research and technological development (RTD). 38. Transport. 39. Education, training and youth. 39. Culture and audiovisual media. 40. Information and communication. 40. Social dimension and employment. 40. Energy. 41. Euratom nuclear safeguards. 43. Environment. 43. Consumer protection. 44. Aid for reconstruction. 44. Internal market. 44. Industry, services and information market. 4s. Labour market and technological innovation. 45. Labour market initiatives. 46. Statistical information. 46. Trans-European networks. 46. Cooperation in the fields of justice and home affairs. 47. The fight against fraud. 47.
(8) Heading 4 — External actions. 50. Borrowing and lending operations. 59. Treasury report. 67. Annex 1 —The ECSC's financial and budgetary activities in 1999. 72. Annex 2 — Financial out-turn of the EDF in 1999. 79. Consolidated accounts of the European Union. 83. Accounting principles. 85. Accounting rules and methods. 85. Consolidated revenue and expenditure account for 1999. 89. Comments on the balance sheet at 31 December 1999. 101. Explanatory notes to the balance sheet. 103. Off-balance sheet commitments — Potential Liabilities and assets at 31 December 1999. 122. Explanatory notes concerning off-balance-sheet commitments · Potential liabilities and assets. 126.
(9) ECONOMIC AND FINANCIAL FRAMEWORK. The basic budget principles The budget of the European Union is governed by six basic principles. Unity This principle, enshrined in Article 199 of the Treaty, requires that all EU expenditure and revenue must be incorporated in a single budget document. In the early years of the Community, the autonomy of the institutions set up under the ECSC, EEC and Euratom Treaties resulted in up to five separate budgets being produced to cover any one year. After the Luxembourg Treaty of 22 April 1970, documents covering the majority of the Community's financial activities were gradually merged so that, now, there are only two: the general budget and the ECSC operating budget. However, there are still two categories of financial operation outside this structure: the European Development Fund (EDF) and borrowing and lending activities. The EDF was set up by the EEC Treaty with a view to increasing trade with associated developing countries and assisting them in carrying out economic and social development projects. The resources of the EDF are provided by contributions from the Member States. For what are essentially political reasons, the Member States wish to retain their direct influence over certain development aid operations by maintaining an independent financial regime and management procedures which are not subject to the ordinary rules. The EEC Treaty made no express provision for borrowing and lending operations. However, as the achievement of the Community's objectives made it necessary to lay down rules for operations on the capital market, borrowing and lending activities were finally authorised in 1975, on the basis of Article 235 of the EEC Treaty. Most borrowing and lending. operations (with the exception of ECSC operations) are included in the balance sheet of the European Communities. The two annexes to this report contain a summary of the budgetary and financial operations of the ECSC (operating budget and borrowing and lending operations) and the EDF. Universality This principle comprises two rules: the rule of non-assignment, meaning that budget revenue must not be earmarked for specific items of expenditure, and the gross budget rule, meaning that revenue and expenditure are entered in full in the budget without any adjustment against each other. Annuality The budget for the year is cast at two levels: a commitment budget and a payment budget. Commitment appropriations cover new commitments for the year, whereas payment appropriations must cover the amounts payable against both new and existing commitments. Annuality means that a budget is adopted for a single year and that the appropriations it contains, both for commitments and payments, must be used during that year. The principle does not rule out the possibility that certain commitments may last for more than one year. Clearly, in sectors such as the Structural Funds, research and external cooperation, the EU needs to enter into some commitments which exceed the period of one year. In these sectors, a mechanism known as 'differentiated appropriations' allows for a separate annual vote of commitments and payments. Under certain clearly defined conditions, some unused appropriations may be carried over to the following year..
(10) 8. Equilibrium. Use of the euro. Estimated revenue for the year must equal payment appropriations for that year. There is no Community legal instrument authorising borrowing to cover a budget deficit. Any surplus for the year is carried forward to the following year. A modest operating deficit can also be carried forward. On the other hand, a significant departure from the original budget during the year requires the adoption of a supplementary or amending budget.. On 1 January 1999 the euro became the single currency of 11 Member States. The changeover took place smoothly and the new currency rapidly became established on the financial markets. As of the first few months, euro-denominated issues thus accounted for a share of international issues comparable with that of dollar-denominated issues. The coordination of economic policies assumed new importance in this context. The broad economic policy guidelines for 1999 thus included detailed recommendations for each Member State, making them more specific and more operational. Alongside the guidelines and the European Employment Pact, the stability and convergence programmes introduced by the Stability and Growth Pact were also important factors in this coordination process. In 1999, special attention was also paid to structural reforms intended to improve the functioning of the markets in goods, services and capital.. Specification This principle requires that each appropriation be assigned to a specific purpose and a specific objective. It is intended to prevent any blurring of the lines between two appropriations when they are authorised and used. This ensures that the budget is drawn up with the requisite transparency and implemented in compliance with the will of the legislative authority. The principle of specification determines the horizontal structure (distinction between the statement of revenue and the statement of expenditure, and subdivision of the statement of expenditure into six individual sections for each of the institutions) and the vertical structure of the budget (the budget nomenclature distinguishes appropriations according to their nature and purpose by subdividing sections — and in particular Section III, which contains all EU expenditure on operations — into titles, chapters, articles and items). A certain flexibility in the application of the rule of specification is achieved by means of transfers of appropriations, which, subject to certain conditions, allow appropriations to be moved to headings other than those to which they were assigned when the budget was established. The Treaty itself makes provision for transfers, the object being to ensure the best possible utilisation of budget appropriations.. The economic situation in the European Union in 1999 The year 1999 saw a marked upturn in economic growth in the EU, increasing from an annualised rate of 2 % in the first half of the year to 4 % in the second half. The first half of 1999 was marked by the effects of the crisis in the emerging economies, which depressed the European Union's external trade. Business confidence suffered, with industrial production marking time in the first six months of the year. During the same period private consumption remained strong, offsetting this pause in activity. In the second half of the year economic activity picked up considerably, thanks to continued buoyant domestic demand and a recovery in external demand linked to the upturn in world growth, particularly in Asia. Data available for the second half of 1999 show that the impact of the depression from Asia was not so strong or lasting as had originally been feared..
(11) 9. Overall, gross domestic product (GDP) in the European Union rose by 2.2 % in 1999. Monetary conditions in the euro area were important in underpinning final demand. The most remarkable factor was the almost continuous depreciation of the euro, launched in January 1999, against the US dollar. While this depreciation caused a slight rise in inflation, it also helped to revive European exports at a time when foreign trade was showing signs of weakness. Three-month interest rates were mainly influenced by the first two, symmetrical decisions taken by the European Central Bank: the first in April 1999 to lower its key interest rate to 2.5 %; the second in November 1999 to raise it to 3 %. The 10year rates increased almost constantly throughout the year, ending at around 5.3 % (10-year rate on German government bonds). Although there has been a gradual increase, inflation overall has remained subdued in the EU, standing at 1.3 % in 1999. Two factors lie behind the rise in inflation during the year: the doubling of the price of oil per barrel and the depreciation of the euro against the US dollar, which pushed up the price of imported goods. However, salaries and labour costs in general rose moderately. The downward trend in unemployment observed over the last few years did not suffer unduly from the slow growth at the start of the year. There may be several explanations for this: buoyant job creation over the last few years, the fact that the external shock mainly affected the manufacturing sector, which now employs less than 20 % of the working population, and, lastly, the fact that the slowdown was perceived from the outset as temporary, which limited the number of redundancies. Average unemployment in the EU as a percentage of the labour force thus fell from 9.9 % in 1998 to 9.2 % in 1999. Public accounts deficits continued to fall in 1999 as net borrowing by general government. fell from 1.5 % of GDP in 1998 to 0.7 % in 1999. This drive towards fiscal consolidation, aimed at a rapid return to a situation of balance or slight surplus, is expected to continue in 2000 and 2001. Similarly, the ratio of gross national debt to GDP,, which peaked in 1996 at 71.4 %, has since steadily fallen to 67.6 % in 1999. This trend should gather momentum in the next few years.. Financial perspective 1993-99 The 1999 budget procedure came within the framework of the financial perspective attached to the interinstitutional agreement of 29 October 1993 on budgetary discipline and improvement of the budgetary procedure, as adjusted in December 1994 following the enlargement of the Community to include Austria, Finland and Sweden. In February 1998, acting under paragraph 9 of the interinstitutional agreement, the Commission made the technical adjustment to the financial perspective in line with movements in gross national product and prices on the basis of the most recent macroeconomic forecasts available. The data for these forecasts concerned the 12-member Community from 1992 to 1995 and the 15-member Community from 1995 to 1999. For 1999, the ceiling for appropriations for commitments was set at EUR 101 867 million and the ceiling for appropriations for payments at EUR 96 380 million, leaving a margin of 0.035 % of GNP beneath the own resources ceiling, set at 1.27 % of GNP by the Council decision of 31 October 1994 on the system of own resources. In accordance with paragraph 10 of the interinstitutional agreement, in February 1998 the Commission sent to Parliament and the Council a proposal for the adjustment of the financial perspective to take account of the conditions of implementation, with the objective of transferring to 1999 the allocations for.
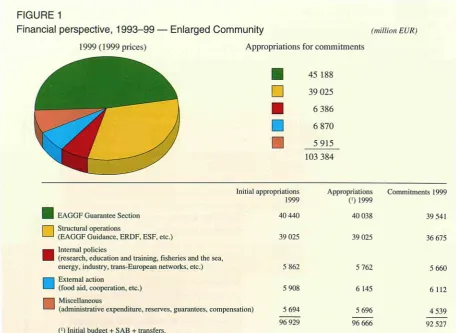
(12) 10. structural operations which were not used in 1997. In order to support the efforts for bud get stringency in 1999, the Commission did not match this with an increase in the overall ceiling for payment appropriations. Parliament and the Council reached agree ment on this proposal. The ceiling for the 'Structural F unds' subheading was raised by EUR 1 433 million, matching commitments not used or decommitted in 1997. The ceiling for the 'Cohesion F und' subheading was raised by EUR 101 million in 1999, equal to decommitted appropriations for 1997. How. ever, the overall ceiling for payment appropri ations was also raised by EUR 300 million in 1999. Following these operations and with the de finitive agricultural guideline as set in the pre liminary draft budget, the ceiling on appropri ations for commitments for 1999 was EUR 103 401 million and the ceiling on appro priations for payments EUR 96 680 million. The margin available beneath the own re sources ceiling remained at around 0.03 % of GNP in 1999.. FIGURE 1 Financial perspective, 199399 — Enlarged Community 1999 ( 1999 prices). (million EUR). Appropriations for commitments. ■. 45 188. D. 39 025. ■ α D. 6 386 6 870 5 915 103 384. litial appropriations 1999. Appropriations (') 1999. Commitments 1999. 40 440. 40 038. 39 541. I EAGGF Guarantee Section Structural operations (EAGGF Guidance, ERDF, ESF, etc.). □ ■ ■. 39 025. 39 025. 36 675. Internal policies (research, education and training, fisheries and the sea, energy, industry, transEuropean networks, etc.). 5 862. 5 762. 5 660. External action (food aid, cooperation, etc.). 5 908. 6145. 6 112. 5 694. 5 696. 4 539. 96 929. 96 666. 92 527. ■ Miscellaneous ^™ (administrative expenditure, reserves, guarantees, compensation) ion) (') Initial budget + SAB + transfers..
(13) 11. Budget for. the 1999 financial year Following the second reading in Parliament, the President of Parliament declared the 1999 budget adopted on 17 December 1998. This was the first budget to be expressed in euro. It totalled EUR 96 929 million in com mitment appropriations and EUR 89 556 mil lion in payment appropriations, up by 6.91 % on the 1998 budget in commitment appropria tions and by 2.43 % in payment appropria tions. Substantial margins were left beneath the financial perspective ceilings, as was the case in 1998: EUR 6 455 million in commit ment appropriations and EUR 10 605 million in payment appropriations. The total payment appropriations represent 1.11 % of GNP (compared with the 1998 figure of 1.14 % and the own resources ceiling of 1.27 % of GNP).. Planned expenditure on structural operations came to EUR 39 025 million for commit ments and EUR 30 950 million for payments, a cut of EUR 500 million in relation to the preliminary draft. The allocations for the Structural Funds totalled EUR 35 902 million in commitment appropriations, corresponding to the amounts agreed at Edinburgh as adjust ed for enlargement. The PEACE initiative for Northern Ireland was allocated EUR 100 mil lion by means of redeployment of appropria tions from Community initiatives on the basis of out-turn figures which, as well as covering the financing of PEACE, allowed additional funds to be made available for Rechar II (around EUR 28 million), Resider II (EUR 25 million), to make up for the fact that the Council refused Parliament's proposal that EUR 60 million be taken from the ECSC, and REGIS I (EUR 20 million).. Once again, this was a budget which testified to the rigorous approach of the two arms of the budgetary authority. But it was also the last budget to be covered by the Edinburgh financial perspective, marking the end of the Delors II package and the transition to Agenda 2000.. Total appropriations for internal policies were EUR 5 861 million for commitments, an in crease of 1.68 % on the 1998 budget and EUR 5 021 million for payments (an increase of 1.53 %). The margin left beneath the ceiling for this heading was EUR 524 million in commitment appropriations.. The appropriations for agricultural expendi ture totalled EUR 40 440 million, the amount proposed by the Commission in its prelimi nary draft, but with requirements updated as shown in the letter of amendment presented after Parliament's first reading: increases of EUR 513 million were offset by an equivalent volume of targeted reductions (affecting arable crops). It was also decided to enter an item for food aid to Russia, to place in reserve EUR 20 million for agri-environmental mea sures in return for an equivalent reduction in Item Β1-1014 (Depreciation of stocks), and to place in reserve a total of EUR 80 million for Items Β1-1501 (Compensation for with drawals and buying in), Β1-1502 (Operational fund for producer organisations) and Β1-2002 (Refunds on cheese). The margin in relation to the guideline was EUR 4 748 million.. The appropriations allocated to research stood at EUR 3 450 million, reflecting the political agreement on the amounts for the fifth frame work programme reached at the conciliation meeting on 17 November. The trans-European networks were the other major item under the heading with EUR 585 million (up by 4.5 % on 1998). Among the other policies, in particular the major multiannual programmes, the appropri ations for Socrates, Youth for Europe and Raphael exceeded the privileged amounts. In culture and education, the main feature was the creation of a new initiative, Connect, with EUR 15 million for commitments and EUR 8 million for payments; its purpose to strength en the integration of cultural programmes with an eye to a new 'Europe of knowledge'.
(14) 12. plan and to finance pilot projects for linking innovations in this area. The 1999 budget also allowed the Ariane and Kaleidoscope programmes to continue. Application of the recent agreement on legal bases resulted in token entries (p.m.) being made for many items with no legal basis, although in some cases appropriations were placed in reserve. The allocation for external action totalled EUR 5 907 million, up 3.27 % on the 1997 budget, leaving EUR 962 million under the ceiling for the heading. The total for payments was EUR 3 952 million, a very significant 9.13 % cut in relation to the 1998 budget. The top priority for 1999 was to focus on cooperation with the countries of central and eastern Europe under the new guidelines for the pre-accession strategy. The PHARE programme also had its allocation increased by over 28 % in commitment appropriations in relation to the 1998 budget, subject to largescale redeployment within the overall allocation. By contrast, the Commission's proposals for cooperation with Mediterranean nonmember countries and with the new independent States and Mongolia were not accepted (the amounts proposed in the preliminary draft were cut by EUR 49 million and EUR 10 million respectively). The appropriations usually entered in reserve for financial cooperation with Turkey were deleted. The allocations for food aid and humanitarian assistance were to allow the Community to continue providing relief in much the same way as in 1998. But there were also some drastic cuts in the 1999 budget in comparison with the 1998 budget in terms of payment appropriations: they amounted to 12 % for cooperation with Mediterranean non-member countries, 21 % for cooperation with the countries of central and eastern Europe, 19 % for cooperation with the new independent States and Mongolia,. 12 % for cooperation with former Yugoslavia and 21 % for the external aspects of certain Community policies. The appropriations for administrative expenditure totalled EUR 4 503 million, 0.04 % down on the 1998 budget. Of this total, EUR 1 580 million was for the other institutions (down by 4.9 %) and EUR 2 426 million for the Commission (excluding pensions), an increase of 2.04 %, the pensions for all the institutions rising by 6.6 %. There was an unprecedented number of supplementary and amending budgets in 1999. Preliminary draft supplementary and amending budget No 1/99, adopted by the Commission on 25 June, comprised the entry in the budget of the difference between the 1998 balance and the previous year's forecast, an update of the forecasts of customs duties, VAT bases and GNP bases for the 1999 financial year and the choice of the exchange rate at 31 December 1998 for the conversion into euro of amounts expressed in national currencies, and changes to the UK correction — the final figure for 1995 and an update for 1998. This draft was established by the Council on 28 June and approved unchanged by Parliament on 16 September. Supplementary and amending budget No 2/99 was requested by the Council to increase its administrative resources in order to cover its requirements resulting from the appointment of the Secretary-General/High Representative for the CFSP. The preliminary draft was submitted by the Commission on 3 June and the draft was established by the Council on 21 June. Parliament noted on 23 July that no amendment had been tabled to the draft and considered the supplementary and amending budget approved. A request for supplementary and amending budget No 3/99 from the Court of Justice and the Committee of the Regions was presented by the Commission on 15 June, established by the Council on 16 July and adopted by Parlia-.
(15) 13. ment on 16 September. The purpose of this request was to increase the Court of Justice's appropriations by EUR 1.675 million and to create the post of financial controller and the post of accounting officer in the Committee of the Regions in anticipation of a separate budget from 2000 with the entry into force of the Amsterdam Treaty. Apart from changing the establishment plan, this increased appropriations by around EUR 100 000. The main purposes of supplementary and amending budget No 4/99 were to give the Community budget the resources to start reconstruction in Kosovo (by covering the operating costs of the European Agency for Reconstruction with an allocation of EUR 92 million for commitments and EUR 30 million for payments), to give the Anti-Fraud Office its administrative autonomy by allocating it 15 posts for the time being, to respond to the earthquake in Turkey and to provide a substantial increase (of EUR 200 million) in payment appropriations for the major programmes in Heading 4 (External action). These increases were financed by the entry in the budget of some of the unused EAGGF Guarantee appropriations. The procedure for adopting this supplementary and amending budget was the fastest in the European Union's budget history: the Commission presented the preliminary draft budget on 9 September, the Council established the draft on 13 September and the budget was adopted unchanged by Parliament on 16 September. This single reading was the outcome of a rapid conciliation procedure be-. tween the three institutions, with a trialogue meeting on 7 September. The Commission presented preliminary draft supplementary and amending budget No 5/99 on 20 October, the Council established the draft on 15 November and Parliament adopted it on 18 November. This supplementary and amending budget followed on from supplementary and amending budget No 4/99 as regards the payment appropriations for both Heading 4 and OLAF. As total requirements of around EUR 675 million had been identified for Heading 4, including the reconstruction of Kosovo, the Commission proposed that the financing should be divided between supplementary and amending budget No 4/99 (EUR 200 million), an omnibus transfer of EUR 273 million and supplementary and amending budget No 5/99 (a further EUR 202 million to be taken from unused EAGGF Guarantee appropriations). Parliament preferred a breakdown which avoided the transfers from Heading 3 proposed in the omnibus transfer, and the supplementary and amending budget No 5/99 as finally adopted increased the payment appropriations for Heading 4 by EUR 225 million, with the omnibus transfer providing only EUR 245 million. For OLAF, this supplementary and amending budget allowed an increase in the secretariat for the Supervisory Committee and the creation of a nucleus of a legal monitoring team by providing 15 posts in addition to those granted by supplementary and amending budget No 4/99, thus bringing the increase in staff for the new Office in 1999 from 15 to 30..
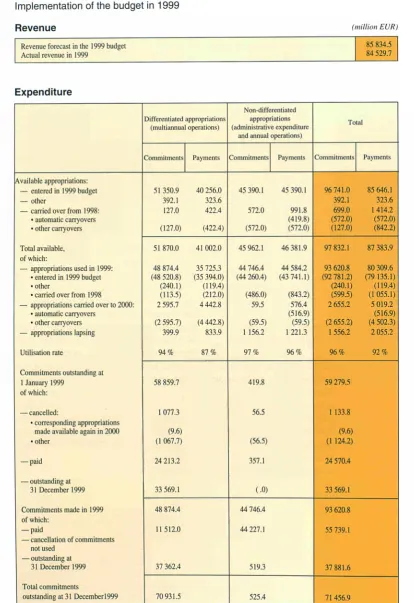
(16) 14. TABLE 1 Implementation of the budget in 1999 Revenue. (million EUR) 85 834.5 84 529.7. Revenue forecast in the 1999 budget Actual revenue in 1999. Expenditure Non-differentiated Differentiated appropriations appropriations (multiannual operations) (administrative expenditure and annual operations) Commitments Available appropriations: — entered in 1999 budget — other — carried over from 1998: • automatic carryovers • other carryovers Total available, of which: — appropriations used in 1999: • entered in 1999 budget • other • carried over from 1998 — appropriations carried over to 2000: • automatic carryovers ■ other carryovers — appropriations lapsing Utilisation rate Commitments outstanding at 1 January 1999 of which:. Payments. Commitments. Payments. 51 350.9 392.1 127.0. 40 256.0 323.6 422.4. 45 390.1. 45 390.1. 572.0. (127.0). (422.4). 51 870.0. To'a'. Commitments. (572.0). 991.8 (419.8) (572.0). 96 741.0 392.1 699.0 (572.0) (127.0). 85 646.1 323.6 1 414.2 (572.0) (842.2). 41 002.0. 45 962.1. 46 381.9. 97 832.1. 87 383.9. 48 874.4 (48 520.8) (240.1) (113.5) 2 595.7. 35 725.3 (35 394.0) (119.4) (212.0) 4 442.8. 44 746.4 (44 260.4). 44 584.2 (43 741.1). (486.0) 59.5. (2595.7) 399.9. (4 442.8) 833.9. (59.5) 1 156.2. (843.2) 576.4 (516.9) (59.5) 1 221.3. 93 620.8 (92 781.2) (240.1) (599.5) 2 655.2 (2 655.2) 1 556.2. 80 309.6 (79 135.1) (119.4) (1 055.1) 5 019.2 (516.9) (4 502.3) 2 055.2. 97%. 96%. 96%. 92%. 94%. 87%. 58 859.7. 419.8. 59 279.5. — cancelled: • corresponding appropriations made available again in 2000 • other. 1 077.3. 56.5. 1 133.8. (9.6) (1 067.7). (56.5). (9.6) (1 124.2). — paid. 24 213.2. 357.1. 24 570.4. — outstanding at 31 December 1999. 33 569.1. (.0). 33 569.1. 48 874.4. 44 746.4. 93 620.8. 11512.0. 44 227.1. 55 739.1. 37 362.4. 519.3. 37 881.6. 70931.5. 525.4. 71456.9. Commitments made in 1999 of which: — paid — cancellation of commitments not used — outstanding at 31 December 1999 Total commitments outstanding at 31 Decemberl999. Payments.
(17) REVENUE. The budget of the European Union is financed from a number of sources. The breakdown for the 1999 total of EUR 86 900 million is shown in Figure 2.. Traditional own resources The EU's traditional own resources are made up of customs duties, agricultural duties and sugar levies. They are established by the Member States, which keep 10 % to cover collection costs. Customs duties are levied on trade with non member countries, at rates based on the Com mon Customs Tariff. These rates are often subject to reductions as a result of negotiation rounds under the General Agreement on Tar iffs and Trade (GATT) and specific agree ments granting preferential tariffs to certain trading partners or products. The amount of customs duties collected was 3.7 % down on the previous year. Even though the value of imports rose in 1999 (+ 4.9 %), the fall in the weighted average tariff from 2.11 % to 1.93 % more than offset this. Agricultural duties are charged when a Mem ber State imports agricultural products from a nonmember country. In 1999 the yield was up 7.7 % on the previous year.. 15. bases, which are determined in accordance with Community rules. In accordance with the June 1988 reform and the recently ratified de cision on the Communities' ownresources system, the uniform rate is determined by ap plying a percentage, set at 1.00 % for 1999, to the VAT base and deducting the compensation for the United Kingdom. The base used must not exceed the percentage of the Member State's GNP laid down in the own resources decision. F or 1999 this limit was 50 %. This year, seven Member States (Greece, Spain, Ireland, Luxembourg, the Netherlands, Portugal and the United King dom) benefited from this limit.. FIGURE 2 Community revenue, 1999. Producers of sugar, isoglucose and insulin syrup pay levies on production to cover mar ketsupport arrangements and to finance a system for the equalisation of sugarstorage costs, thus ensuring that sugar supplies reach the market steadily throughout the year. These levies offset expenditure of virtually the same amount. In 1999 revenue from this source was up by 12.5 %.. VAT own resources. VAT own resources. 36.1%. Customs duties. 15.0 %. Agricultural duties and sugar levies GNPbased resources. The VAT own resources are calculated by ap plying a uniform rate to the national VAT. Other (including surpluses available). 2.8% 42.6 % 3.6%. D. ■ ■ D ■.
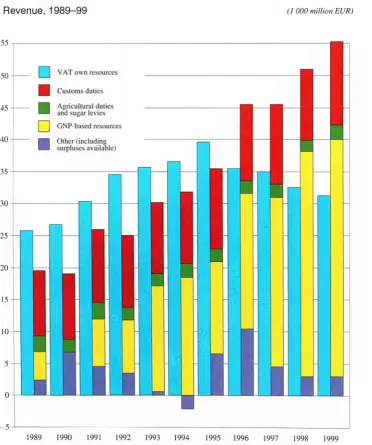
(18) 16. Payments for a given year derive from the forecasts for that year and the negative or pos¡tive adjustments for previous years established using the final statements of the hases.. This year, negative adjustments for previous years totalling EUR 49.3 million were made, the budget forecasts having over-estimated economic growth.. In 1999, the VAT resource amounted to EUR 31 213 million.. FIGURE 3 Revenue, 1989-99. 1989. 1990. (1 000 million EUR). 1991. 1992. 1993. 1994. 1995. 1996. 1997. 1998. 1999.
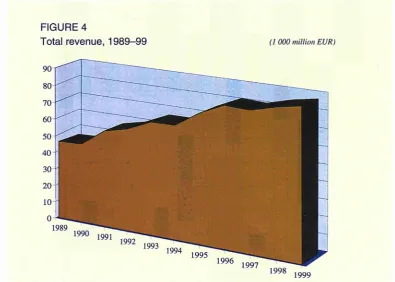
(19) 17. GNP-based own resources. of its GNP (not including the EAGGF monetary reserve, the loan guarantee reserve and the emergency aid reserve). In addition, four Member States had to finance their share of the compensation for the United Kingdom by making a payment based on GNP as their VAT payments had reached the maximum rate. i.e. 1.0 % of their base.. A new source of revenue based on a proportion of each Member State's GNP was first introduced in 1988 to balance budget revenue and expenditure, i.e. to finance the part of the budget not covered by other revenue. The rate is fixed during the budgetary procedure and depends on the total of other revenue; the rate is applied to the aggregate GNP of all the Member States, determined in accordance with Community rules.. In 1999, the GNP resource amounted to EUR 36 705.4 million (not including reserves).. This year this additional resource was called in, with each Member State paying 0.4752 %. Net positive adjustments totalling EUR 500.3 million were made for 1988-98.. FIGURE 4 Total revenue, 1989-99. (1 000 million EUR). 1997. 1998. 1999.
(20) 18. FIGURE 5 Own resources by Member State, 1999. (1 000 million EUR). 22 21 I VAT own resources I Customs duties Agricultural duties and sugar levies J GNP-based resources. 20. ■. 19 IX 17 16 15 14 13 12 11 10 9 X 7 6 5 4 3 2. I Β. ffl DK. D. Hi EL. E. F. IRL. I. L. NL. A. Ρ. FIN. S. UK.
(21) 19. United Kingdom compensation. Other revenue. The United Kingdom compensation was introduced to correct the difference between the United Kingdom's share of payments to the Community budget and the share of Community expenditure in the United Kingdom. The cost of the correction is borne by the other Member States according to their share in GNP, although Germany only contributes two thirds of its normal share.. The general budget is also financed by miscellaneous revenue, including tax and other deductions from staff remuneration, bank interest, contributions from non-member countries to research programmes, repayments of unused aid and interest on late payments. Together, these sources generated revenue amounting to EUR 1 350 million.. The provisional amount of the United Kingdom compensation for 1999 was EUR 3 636 million.. The revenue for 1999 also includes the EUR 2 944 million surplus from 1998..
(22) 20. EXPENDITURE. Heading 1 —Agricultural market guarantees Objectives and means Article 38 of the EEC Treaty provided that the common market should extend to agriculture and trade in agricultural products, and that the operation and development of the common market for agricultural products must be ac companied by the establishment of a common agricultural policy among the Member States. Article 39 set the following objectives for the common agricultural policy: D to increase agricultural productivity: D to ensure a fair standard of living for the agricultural community: D to stabilise markets; D to assure the availability of supplies:. Although these objectives have largely been met, certain permanent adjustments have had to be made, the most recent of which was the reform of the common agricultural policy adopted by the Council in May 1992. The re form is based on more competitive prices and direct aid to the farmers in greatest need. Its aim is to reduce surpluses, stem the tide of rural depopulation and preserve the environ ment by discouraging intensive production.. In pursuit of the above objectives, the com mon market in agricultural produce was based on three principles: the single market, Com munity preference and financial solidarity. The third of these principles is fundamental to the policy, and in April 1962 the Member States accordingly decided to set up a Com munity fund — the European Agricultural Guidance and Guarantee F und (EAGGF ) — which is part of the EU budget. It is subject to the general budgetary rules, with the addition of specific provisions.. D to ensure that supplies reach consumers at reasonable prices. The F und was divided into two sections in 1964: the Guarantee Section covers expenditure on markets and prices and the Guidance Section covers expenditure on farm structures.. FIGURE 6 Community expenditure, 1999. Constraints. Common agricultural policy. 43.4 %. Structural operations. 40.1 %. Research and technological development. 3.8%. Internal policies other than research. 2.6%. External action. 6.7%. Administration. 3.1%. Other (guarantee, reserves, etc.). 0.3%. ■ D D. ■ ■ ■ Π. In June 1988, when own resources had run out as a result of ever increasing agricultural expenditure triggered by imbalances on cer tain markets, the European Council agreed on principles of budgetary discipline in order to establish a better balance between the various categories of expenditure and keep their growth under control. These principles were reaffirmed by the Edinburgh European Coun cil in December 1992..
(23) 21. To bring agricultural expenditure under control, the European Council adopted the principle of a guideline. Within this guideline the EAGGF Guarantee Section has to finance:. However, in line with the conclusions of the Edinburgh European Council, the guideline was extended with effect from 1993 to cover:. D market intervention operations, including depreciation of new stocks:. D new flanking measures to accompany the reform of the common agricultural policy (early retirement, environment, afforestation);. D market-related rural development operations and measures to combat fraud.. D all set-aside expenditure, which had been shared equally between the EAGGF Guid-. D export refunds;. FIGURE7 Expenditure, 1989-99. (1 000 million EUR) J Common agricultural policy J Structural operations. □ ■. 1992 1993 1994 1995. 1996 1997. 1998 1999. Internal policies other than research. |. External action. |. Administration Other (refunds, guarantees, reserves, etc.). □. 1989 1990 1991. Research and technological development.
(24) 22. ance Section and Guarantee Section until 1992 (Heading 2); D expenditure on income aid (under Heading 2 of the financial perspective in 1992); D spending from the fisheries guarantee fund.. were fixed at around EUR 40 400 million, EUR 400 million less than in 1997. The 1999 budget Initial appropriations in the 1999 budget. Finally, since 1997, the budget forecasts for agriculture, like those for other expenditure, have heen produced against the background of the budgetary and financial stability demanded by economic and monetary union. In 1997 budget appropriations were thus set at EUR 40 800 million, virtually the same level as in 1996. In 1998 and 1999 this budgetary stringency continued as the appropriations. The appropriations covered by Heading l of the financial perspective amounted to EUR 40 440 million, not counting the EUR 500 million monetary reserve, which is called on only if needed. The figure does include the EUR 205 million entered in Chapter B0-40 (Provisions).. FIGURE 8 Total expenditure, 1989-99. (I 000 million EUR). 1997. 1998. 1999.
(25) 23. FIGURE 9 Expenditure on agricultural market guarantees, 1999. (1 000 million EUR). Arable crops. Sugar Olive oil and dried fodder Fibre plants. Fruit and vegetables Products of the wine-growing sector Tobacco. Milk and milk products. Beef and veal Sheepmeat and goatmeat Expenditure 1999. Pigmeat. Expenditure 1998 Other. 0. 1. 3. 4. Implementation of the 1999 budget. 5. 6. 9. 10. 11. 12. 13. 14. 15. Utilisation of appropriations and special factors having a sizeable impact on the 1999 out-turn. The above expenditure includes the reduction in advances (reductions in monthly reimbursements) decided by the Commission. These reductions include the following cases in particular:. EAGGF Guarantee spending for 1999 totalled EUR 39 540.8 million, or EUR 899.2 million less than the initial appropriations.. D failure by Italy (in particular) to collect the additional milk levy for the 1997/98 and. 16. 17. 18.
(26) 24. 1998/99 marketing years (EUR 337 million reduction in advances); D shortcomings in the application of the integrated system and in the application of controls in Greece (initial reduction of EUR 234 million in advances, of which EUR 126 million was reimbursed with the last monthly advance in the light of the replies supplied by Greece to the Commission's requests). The final reduction of EUR 108 million concerns a number of budget chapters; D shortcomings in the application of the integrated system in Portugal (EUR 5 million reduction in advances); D failure by a number of Member States to comply with the payment times set in the rules (reduction of EUR 12 million on a number of budget lines). Two other factors, not foreseen when the budget was drawn up, had a significant impact on the 1999 out-turn. They were: D the amounts deducted from EAGGF Guarantee expenditure as a result of unusually large financial corrections in the clearance of accounts (EUR 96 million); D failure by Italy to pay the first instalment of the agrimonetary aid for the implementation of the programmes adopted by the Commission in spring 1998 (EUR 130 million).. Monetary factor The dollar parity The level of expenditure shown in the previous section takes account of the movement of the dollar against the euro. For a large proportion of the export refunds on agricultural products, in particular cereals and sugar, and for some internal aid such as aid for cotton, the level of expenditure is affected by fluctuations in the dollar rate.. In accordance with the Council decision on budgetary discipline, the 1999 agricultural budget was established on the basis of the average dollar parity for January, February and March 1998 of USD 1 = EUR 0.92 (EUR 1 = USD 1.09). The actual average dollar rate from 1 August 1998 to 31 July 1999 (reference period for determining the impact of the dollar) was different from the budget rate at EUR 0.90 (EUR 1 = USD 1.11). This entailed additional expenditure of EUR 219 million, which was above the EUR 200 million margin set by the budgetary discipline rules. However, as the expenditure above this margin can be financed by appropriations available at the end of the year, it is not necessary to draw on the monetary reserve.. Dual rate Expenditure can also be higher because of the dual rate effect. Although the disappearance of green rates will eventually eliminate the dual rate effect in the countries participating in the euro and hence generate major savings, the effect was still substantial in 1999, as most of the payments charged to the 1999 budget were based on the green rates prior to 1 January 1999. When the budget was established the dual rate effect was estimated at EUR 511 million. In actual fact expenditure linked to the dual rate effect totalled EUR 630 million, or EUR 119 million more. Market factors The differences (between the appropriations entered in Subsection Bl of the budget and expenditure actually booked) for the main budget chapters are discussed below (all figures are in million EUR)..
(27) 25. Implementation of the 1999 EAGGF Guarantee budget by chapter. Chapter. Sector. Appropriations in budget. Expenditure in 1999. a. b. c. d. Bl-10 Bl-11 Bl-12 Bl-13 Bl-14 Bl-15 Bl-16 Bl-17 Bl-18. Arable corps Sugar Olive oil Dried fodder and grain vegetables Fiber plants Fruit and vegetables Wine Tobacco Other sectors. 17 831 1 937 2 251 388 968 1661 661 980 305. 17 865.9 2 112.8 2 091.8 376.4 1 027.1 1 454.1 614.6 911.0 285.3. Β1-20 Bl-21 Β1-22 Β1-23 Β1-25 Β1-26. Milk & milk products Beef and veal Sheepmeat and goatmeat Pigmeat, eggs and poultry Other livestock product measures Fisheries. 2 581 4916 1 755 365 29 20. Β1-30 Bl-31 Β1-32 Bl-36 Bl-37 Bl-38 Β1-39. Non Annex II products Food programmes Most remote regions and Aegean Sea Monitoring and prevention Clearance Promotion measures Other measures. Β1-50. Accompanying measures Total. ΒΟ-40 EAGGF Guarantee Total. Utilisation of appropriations. (%). Difference between out-turn and initial appropriations. e = d / c * 100. f = d-c. 100.2 109.1 92.9 97.0 106.1 87.5 93.0 93.0 93.6 '. 34.9 175.8 - 159.2 -11.6 59.1 - 206.9 -46.4 -69.0 -19.7. 2510.1 4 578.7 1 894.3 432.8 16.4 7.8. 97.3 93.1 107.9 118.6 56.6 38.9. -70.9 -337.3 - 139.3 67.8 -12.6 - 12.2. 550 348. 573.4 390.5. 104.3 112.2. 23.4 42.5. 231 28 -510 77 266. 223.7 23.3 - 606.2 68.5 100.2. 96.8 83.1 118.9 88.9 37.7. -7.3 -4.7 -96.2 -8.5 - 165.8. 2 597. 2 588.2. 99.7. -8.8. 40 235. 39 540.8. 98.3. - 694.2. 205. 0.0. 0.0. -205.0. 40 440. 39 540.8. 97.8. - 899.2.
(28) 26. ed in a higher than expected percentage of payments for the 1998/99 marketing year being made during the 1999 financial year.. Arable crops Initial appropriation. Expenditure. Difference. 17 831.0. 17 865.9. + 34.9. Expenditure was at almost exactly the level budgeted. However, within the chapter there were substantial divergences, which offset each other. Payments for areas under oilseeds considerably exceeded the initial appropriations, as a result of the payment of the balance for the 1998/99 marketing year. The aid per hectare was much higher than assumed in the budget, as a result of the market price of oilseeds (lower prices led to a smaller reduction than expected). In addition, expenditure on public storage was higher, because of higher losses on sales than allowed for in the budget (larger quantities sold at lower prices). By contrast, payments on aid for durum wheat (expenditure by Italy lower than expected) and on per-hectare aid to small producers were less than initially budgeted. Lastly, the reduction in monthly advances paid to Greece, totalling EUR 31 million over several lines in this chapter, affected the utilisation of appropriations.. Sugar Initial appropriation. Expenditure. Difference. 1 937.0. 2 112.8. + 175.8. The overspend was the result of higher payments for export refunds. This was due to low world prices and an upsurge in exports at the beginning of the marketing year, which result-. Olive oil Initial appropriation. Expenditure. 2 251.0. 2091.8. Difference 159.2. The under-utilisation results from: D less expenditure than expected on production aid, particularly in Spain, and a reduction in the monthly advances to Greece; D high oil prices, which produced higher gains on sales from public storage than expected when the initial budget was drawn up. Fibre plants Initial appropriation. Expenditure. Difference. 968.0. 1027.1. + 59.1. Expenditure on aid for cotton overran appropriations. The level of the aid was higher than anticipated when the budget was adopted because of the lower world prices. Fruit and veeetables Initial appropriation. Expenditure. 1 661.0. 1454.1. Difference 206.9. The under-utilisation of appropriations can be attributed to lower expenditure on fresh fruit and vegetables. There were fewer withdrawals during the 1998/99 marketing year and expenditure was lower on compensatory aid for bananas (smaller quantities eligible for aid and a lower level of aid)..
(29) 27. By contrast, expenditure on processed fruit overshot appropriations. The paying agencies paid out the financial compensation to encourage the processing of citrus fruit faster than expected.. The largest overruns concerned: D export refunds (more butter and skimmedmilk powder was exported than forecast in the budget and the average refund rate for 'other milk products' was higher than expected);. Wine Initial appropriation. Expenditure. Difference. 661.0. 614.6. •46.4. The appropriations were not used because expenditure was lower than expected on:. D aid for skimmed milk used in the production of casein (larger quantities eligible for aid and a higher rate of aid); D public storage of butter following substantially more buying-in;. D public storage, intervention buying being less than assumed in the budget;. D public storage of skimmed-milk powder due to higher intervention buying-in and to lower earnings on sales;. D (voluntary preventive) distillation of wine, the quantities involved being slightly smaller than expected.. D aid for the use of butter in the manufacture of pastry products (larger quantities eligible for aid).. 1. These overshoots were offset by the yield to the budget of the additional milk levy amounting to almost EUR 500 million.. Tobacco Initial appropriation. Expenditure. 980.0. 911.0. Difference 69.0. Underutilisation of appropriations was due to the fact that payments of tobacco premiums for the new harvest (1999) could not be made until the 2000 financial year as a result of a change in the rules.. Milk Initial appropriation. Expenditure. 2581.0. 2 510.. Difference 70.9. Overall expenditure in this chapter was less than initially budgeted for. but it was seen that there were overruns on a number of lines which were more than offset by the yield of the additional milk levy.. D For the 1997/98 marketing year, milk production in Italy exceeded the quotas during that year. The Commission took this fact into account by reducing the monthly advances paid to Italy during this financial year by EUR 225 million. The budget made no provision for amounts to be collected under this heading. D For the 1998/99 marketing year, the Member States credited the EAGGF accounts with some EUR 160 million. In addition, the Commission reduced the last monthly advances to the Member States by EUR 112 million to take account of the fact that Italy did not credit the EAGGF accounts with any amount at all and some other Member States did not pay the full amount due. Here, too, the budget made no provision for amounts to be collected under this heading..
(30) 28. port refunds and large quantities being cov ered by private storage contracts.. Beef and veal Initial appropriation. Expenditure. Difference. 4 916.0. 4 578.7. -337.3. The under-utilisation of appropriations was mainly due to an increase in the consumption of beef and veal in the European Union. In addition there was substantially lower ex penditure on: D export refunds, as exports were very low, in particular because of the financial crisis in Russia; D public storage, as a result of higher earn ings from sales. Expenditure on premiums, on the other hand, was overall exactly as budgeted.. Non-Annex I products Initial appropriation. Expenditure. Difference. 550.0. 573.4. + 23.4. The slight overspend was the result of the transfer by the budgetary authority of EUR 60 million from this chapter to the reserve, Chap ter BO-40 (provisions), after which expendi ture exceeded the appropriations under Chap ter Β1-30. The higher average level of export refunds did not result in higher than expected expenditure because it was offset by a drop in exports. Ex penditure in fact was slightly below the amount estimated when the budget was drawn up.. Sheepmeat Initial appropriation. Expenditure. Difference. 1 755.0. 1 894.3. + 139.3. The appropriation was overspent as a result of higher payments of the ewe and she-goat pre mium. Expenditure on the balance for the 1998 marketing year and on the first advance for the 1999 marketing year was higher than assumed when the budget was established, be cause of the lower market price. Pigmeat Initial appropriation. Expenditure. Difference. 365.0. 432.8. + 67.8. The overrun was the result of the difficulties on the pigmeat market during the marketing year. This produced an increase in rates of ex. Food programmes Initial appropriation. Expenditure. Difference. 348.0,. 390.5. + 42.5. The overspend was the result of expenditure on the food aid measure for Russia. Following the political decision on this measure, the budgetary authority adopted supplementary and amending budget 1/98 inserting a new Ar ticle Bl-315 (Food aid for Russia). This new line was allocated EUR 400 million from other EAGGF Guarantee items which were underspent. At the same time the budgetary authority decided that this EUR 400 million would be carried forward to 1999. The same Article Bl-315 was entered in 1999 with a token entry (p.m.), as it had been agreed that any requirements in excess of the EUR 400 million carried over from 1998 to 1999 could.
(31) 29. be financed from savings made on storage costs as a result of the use of public stocks worth a total of EUR 82.9 million for this food aid measure, hence the overspend in Chapter Β131. The Commission will also request a carryover of around EUR 4 million for monitoring oper ations connected with the food aid operation for Russia. These monitoring, control, evalua tion and audit operations relating to the prod ucts mobilised in 1999 will have to continue in 2000 to ensure that the operation is carried out properly. As nothing was entered in the 2000 budget for this purpose, the carryover will have to be proposed to the budgetary au thority. The expenditure on the food aid measure for Russia is partly offset by small underspends on a number of other measures covered by this chapter, namely:. er, three unexpected clearance decisions were taken under Article 5(2)(c) of Regulation (EEC) 729/70 (consistency audit) generating additional revenue of around EUR 102 mil lion. F inally some EUR 8 million was reim bursed to certain Member States in respect of the 1998 clearance, with the result that the final amount collected was some EUR 606 million.. Other measures. Initial appropriation. Expenditure. Difference. 266.0. 100.2. 165.8. D refunds for food aid measures; D aid for school milk and D free distribution of fruit and vegetables. Finally the Member States made up the delay in the distribution of agricultural products to the needy (as occurred in the two previous years) and used virtually all the appropriations available for this measure.. Clearance of accounts Initial appropriation. Expenditure. Difference. 510.0. 606.2. ■96.2. Amounts yielded by the financial corrections made by the Commission in the clearance of accounts procedure were larger than estimated when the budget was established. The budget was based on the estimated yield for the 1995 accounts (around EUR 512 million). Howev. The chief reason for the underspend was that Italy did not pay out any agrimonetary aid. The budget provided around EUR 130 million for implementation of the programmes adopt ed by the Commission in spring 1998. Italy did not dispute this assumption. Indeed, it in formed the Commission that it intended to pay the amounts in question during the 1999 calendar year.. By contrast, the United Kingdom paid out a second instalment of agrimonetary aid for beef and veal which it had not requested until after the budget had been drawn up, so the necessary appropriations had not been en tered.. Furthermore, the payments for the transitional arrangements following the introduction of the euro during the 1999 financial year were lower than expected because most of the Member States started their payments later than planned..
(32) 30. The Commission asked for a carryover to 2000 to cover the additional requirement for that year resulting from Italy's late payment (EUR 130 million) of agrimonetary aid. The 2000 budget provides only for the payment of the second instalment worth EUR 101 mil lion. Since the first instalment was paid late, it is likely that the second instalment will also be paid later than planned, i.e. during 2001. The Commission therefore requested the car ryover of EUR 29 million.. ■ Accompanying measures. Initial appropriation. Expenditure. 2 597,0. 2 588,2. Difference. Expenditure on accompanying measures at the end of the financial year was almost exact ly equal to the amount budgeted.. During the year spending under this chapter had been well below the indicator and then the Member States' forecasts had suggested that there would be a substantial overspend at the end of the year.. Utilisation of appropriations carried over from 1998 EUR 400 million was carried over from 1998 to 1999 to finance part of the food aid mea sure for Russia. Of this total, expenditure of EUR 335.5 million was charged. The unused appropriations lapsed. The total amount for the food aid operation for Russia was estimated at EUR 470 million. It was planned to finance EUR 400 million from appropriations carried forward from 1998 and the remaining EUR 70 million from appropriations for 1999 by using the savings resulting from the reduction in storage costs for products in intervention and expenditure on refunds for pigmeat. Implementation of the programme was inter rupted to ensure it complied with the Council regulation and the memorandum concluded with the Russian authorities. Moreover, the suspension of pigmeat deliveries following the dioxin crisis caused further delays, and it was therefore not possible to complete the measure as planned before the end of the EAGGF Guarantee Section financial year. In all EUR 412.5 million was booked for the op eration in 1999, EUR 329.5 million against appropriations carried over and EUR 82.9 million against 1999 appropriations. The Commission requested that some EUR 4 million be carried over from 1999 to 2000 for monitoring operations in connection with the food aid measure for Russia..
(33) 31. FIGURE 10 Breakdown by Member State of Community contribution under the various objectives of the Structural Funds (current prices). (1 000 million EUR). I Objective 1 1 Objective 2 I Objective 3 and 4 1 Objective 5a (agriculture) I Objective 5a (fisheries) I Objective 5b I Objective 6. Β. DK. D. EL. NB: Figures relate to the period 1994—99, except in the case of three new Member States — Austria, Finland and Sweden (1995-99)..
(34) 32. Heading 2 — Structural operations Structural operations consist of the Structural Funds and the Cohesion F und. The total bud get for 1999 was EUR 39 025 million (EUR 35 902 million for the Structural F und and EUR 3 118 million for the Cohesion F und). Figure 11 shows the breakdown of commit ments as voted for the 1999 budget.. differentials between regions and to promote equality of opportunity between the various social classes in accordance with a series of priority objectives. There are four Structural Funds, and their operations are coordinated: D European Regional Development F und D European Social Fund D European Agricultural Guidance and Guar antee Fund. The Structural Funds. D F inancial Instrument for F isheries Guid ance.. The priorities financed by the Structural Funds. Between 1994 and 1999. the Structural F unds helped to finance the following priority objec tives:. The Structural F unds help to achieve the ob jective of economic and social cohesion with in the European Union. Their resources are targeted on operations which help to reduce. D Objective 1 : development and structural adjustment of regions whose development is lagging behind, i.e. regions whose per. FIGURE 11 Breakdown of Subsection B2 of the 1999 budget et —. Commitments I 1. Objective 1. 51%. Objective 2. 9 9?. Objective 3. 6'/,. Objective 4. 2%. |. Objective 5a. 5%. Objective 5b. 6%. D. Objective 6. 1 V,. Community initiatives. 11 %. Innovative actions. 1%. Cohesion F und. X'/i. D1. ■ u u Π π.
(35) 33. capita GDP (gross domestic product) is less than 75 % of the Community average; D Objective 2: converting regions, frontier regions or parts of regions seriously affected by industrial decline; D Objective 3: combating long-term unemployment, facilitating the integration of young people into working life, promoting equality of opportunity for men and women on the labour market; D Objective 4: helping the workforce adjust to industrial change and to changes in production systems; D Objective 5a: adjustment of agricultural structures in the framework of the common agricultural policy, modernisation and restructuring of fisheries: D Objective 5b: development and structural adjustment of rural areas: D Objective 6: development and structural adjustment of regions with an extremely low population density. Objectives 3. 4 and 5a cover the whole of the Community territory, while objectives 1. 2. 5b and 6 are specifically regional in nature. The regions eligible are determined on the basis of criteria which are specific lo each objective.. The intervention methods of the Structural Funds Appropriations are used via development programmes. Once the Commission and the authorities of the Member States have reached agreement on a programme. European appropriations are made available so that the programme objectives can be realised. Community involvement takes the form of co-financing. Operations under the Structural Funds are subject to multiannual programming. This programming is for six years 1994-99 (five. years for the three countries which joined in 1995) for all objectives except Objective 2. for which there are two three-year phases. Two basic rules must be observed: first, the Community aid granted to each Member State must supplement funds from the public authorities and not replace them (principle of additionally) and, secondly, it must be implemented in close cooperation between the Commission and the competent authorities and agencies in the Member State concerned (principle of partnership). Programmes are proposed and managed by the national, regional or local authorities designated for that purpose in the programme. Community support frameworks and Community initiatives are important in this connection: D Community support frameworks (CSFs). which are national initiatives, are based on development plans presented by the Member States or the regions and approved by the Commission. Operational assistance usually takes the form of an operational programme (OP), which is submitted by the Member State and adopted by the Commission in the form of aid. CSFs account for 90 % of appropriations for the period 1994-99. D Community initiatives (CIs) — 13 in all — are operations carried out on the Commission's initiative but which are also proposed and managed by authorities designated by the Member States. CIs account for 9 % of appropriations for the period 1994-99. • Interreg II: cross-border cooperation (aspect A), energy networks (aspect B). interregional cooperation (aspect C): • Leader II: (rural development): • REGIS II: integration of most remote regions: • Employment: NOW (access for women.
(36) 34. nity amount to EUR 141 471 million at 1992 prices and for the three new Member States which joined in 1995 to EUR 4 747 million at 1995 prices. The annual tranches correspond ing to these allocations are indexlinked on an annual basis to allow for inflation. The amounts are not only a ceiling but also an ex penditure target, which the budgetary authori ty has undertaken to respect. In the European ' ADAPT: helping the workforce to adjust Union budget for 1999, the commitment ap to industrial change; propriations for the Structural F unds totalled EUR 35 902 million, accounting for 92 % of ■ Rechar II: conversion of coalmining structural operations and 37 % of the total areas; budget. to jobs with good prospects and manage ment posts); Horizon (employment op portunities for people with disabilities, and other disadvantaged groups); Youthstart (labour market integration of low skilled people under 20); Integra (social and professional integration of margin alised people);. • Resider II: conversion of steel areas; • Konver: diversification in regions depen dent on defence industries; • RETEX: diversification in regions de pendent on the textiles and clothing sec tor; • SME: improvement of the competitive ness of small and mediumsized enter prises; • URBAN: revitalisation of deprived areas of medium and large towns; • PESCA: diversification in regions depen dent on fisheries; • PEACE: support for the process of peace and reconciliation in Northern Ireland. Apart from these two main forms of aid, the Structural F unds also finance studies, techni cal assistance operations and pilot projects re lating to their fields of activity. These projects and measures account for 1 % of appropria tions for the period 199499. Structural Fund allocations for the period 1994-99 The Structural F und allocations decided for the period 199499 for the 12nation Commu. Cohesion Fund. The Cohesion F und provides money for envi ronmental and transEuropean transport net work projects in the Member States of the Union whose GDP is less than 90 % of the EU average. The F und was created by the Maastricht Treaty in 1993 and is intended to strengthen economic and social cohesion by helping the leastprosperous States to participate in eco nomic and monetary union. The F und has en abled Spain, Portugal, Ireland and Greece to meet the convergence criteria for economic and monetary union and at the same time con tinue to invest in infrastructure to step up their development.. The aid granted by the Cohesion F und is con ditional on the beneficiary States following a programme of economic convergence. The Cohesion F und can partfinance up to 8085 % of public expenditure on a project, irrespective of whether it is an environmental or infrastructure one. The funding of transport infrastructure and environmental projects must be evenly balanced, the target ratio set by the Commission being 50:50..
(37) 35. Out-turn 1999 Implementation of the Structural Funds (Title B2-1) The level of commitment appropriations in the 1999 budget was far higher than in 1998 (up by 17.7 % or EUR 5 400 million). Most of this increase is accounted for by the re-entry in the budget of EUR 3 171 million which had not been used in previous years with a view to meeting the expenditure target sel at Edinburgh. This concentration of appropriations at the end of the period and the need to adopt decisions on contributions from the Funds. before the end of the year dominated activities throughout 1999. The commitments for the period 1994-99 were used in accordance with the programme adopted at Edinburgh. However, from the accounting point of view, this operation required substantial carryovers to 2000 for both commitments and payments so as to meet the targets set at Edinburgh.. Implementation of commitments In 1999 commitments came to EUR 33 692 million (11 % more than in 1998) and EUR 2 346 million was left unused. The 6.5 c/c rate of underutilisation may be higher than in the past, but the commitment. FIGURE 12 Commitment and payment appropriations entered in the budget, 1994-99. (million EUR). 36 000 30 000 24 000 18 000 12 000 6 000 1994. 1995. D Commitments. 1996. D Appropriations. 1997. 1998. ' Rebudgetisation. 1999.
(38) 36. appropriations not used were EUR 825 mil lion less than the amounts reentered in the budget from previous years, with the result that some of the backlog was in fact made up. As this underutilisation does not reflect the decisions on contributions from the F unds, which involve higher amounts broadly coin ciding with the allocations laid down at Edin burgh, virtually all the unused commitment appropriations had to be carried over to 2000 lo cover the programmes. As the following figure shows (1999 + c/o), utilisation was vir tually complete when carryovers are included. Implementation of payments. In 1999 payments totalled EUR 24 948 mil lion (3 c/c down on 1998) and unused appro. priations came to EUR 3 833 million. Howev er, the extent of this underutilisation of pay ments was inflated by a transfer of EUR 1 000 million from the Cohesion F und in the course of the year.. While the rate of underutilisation fell for pay ments during the period covered, it rose again in 1999 (13.3 %), although it is still lower than at the start of the period. However, as the following figure shows, a large proportion of the unused appropriations were carried over because the Member States had requested payments of EUR 6 530 million which had still not been entered in the accounts by the end of the year. These payments were made at the beginning of 2000.. FIGURE 13 Underutilisation of the Structural Funds commitments ■ all available appropriations, 199499. Commitment appropriations not used. (million EU R). W Rate of underutilisation (right hand scale).
(39) 37. FIGUREM Underutilisation of the Structural Funds payments — all available appropriations, 1994-99. (million EUR). 6 000. 30%. 5 000. 25%. 4 000. 20%. 3 000. 15%. 2 000. 10%. 1000. 5%. 0 1994. 1995. 1996. Payment appropriations not used. Cohesion Fund (Title B2-3) As was generally the case throughout the period 1993-99. the Cohesion Fund's commitment appropriations were used in full in 1999 (EUR 3 129 million). By contrast, payments made in 1999 amounted to no more than EUR 1 716 million, about 30 c/c down on the previous year. EUR 161 million was left unused. Although underutilisation appears limited (8.5 9c), it should be remembered that payment appropriations of EUR 1 000 million were transferred from the Cohesion Fund to the Structural Fund during the year. In terms of the initial budget (EUR 2 877 million), underutilisation of payment appropriations was far greater. This reduction in payments is easily explained since many 1993-99 projects were nearing completion. According to the rules, the final. 1997. 1998. 1999. 1999 + R.. I Rate of underutilisation (right hand scale). 20 9c of payments are balances which are not paid until the final report for the project has been approved. In many cases, the final report is drawn up. transmitted to the Commission by the national authorities and approved several months after the project has actually been completed. This explains the 'hiatus' in payments. EEA financial mechanism (Title B2-4) The purpose of this line was to cover the Community's financial contributions to the EEA financial mechanism pursuant to the accession agreements for Austria. Finland and Sweden. An amount of EUR 5 million was entered in the reserve in the event of the EEA mechanism, which is managed by the E1B. having to make a final call for funds in order to close its operations. No further call for funds was necessary in 1999..
(40) 38. Heading 3 — Internal policies. the non-nuclear appropriations of the framework programme. The EUR 3 189.2 million in commitments for the indirect action and shared-cost projects of the fifth framework programme breaks down among the various specific programmes as follows:. Research and technological development (RTD) The fifth research and technological development framework programme was adopted by Parliament and the Council on 22 December 1998. The Council adopted the Euratom framework programme on the same day. The total budget for the two programmes comes to EUR 14 960 million. During 1999, the first year in which the fifth framework programme was operational, the rules for implementing research programmes were subject to a thorough review, with the adoption of new rules on participation, selection and evaluation and the introduction of improved management procedures and tools. The appropriations for the 1999 budget amounted to EUR 3 450 million. Transfer 27/99 concerning aid to Kosovo's neighbours reduced the initial allocations of commitment appropriations by EUR 115 million. Budget out-turn was 99.18 % in commitments and 88.48 % in payments. The appropriations available in 1999 for RTD were as follows: (million EUR). Budget, not including European Economic Area (EEA) support Indirect action and shared-cost projects. 3 189.2. Direct action by Joint Research Centre 260.8 EEA contribution Indirect action and shared-cost projects and direct action by Joint Research Centre. 59.34. The additional appropriations for cooperation with the European Economic Area concerned. (million EUR). Quality of life and management of living resources. 553. User-friendly information society. 857. Competitive and sustainable growth. 646. Energy, environment and sustainable development. 446. Confirming the international role of Community research. 78. Promotion of innovation and encouragement of participation ofSMEs. 78. Improving human research potential Research and training in the field of nuclear energy. 293 238.2. The concentration of resources on integrated or coordinated RTD actions, particularly within the framework of multidisciplinary key actions, in order to meet the priority needs of society, attracted a wide response from the scientific community and from companies. Almost 12 000 proposals were received in response to the calls made in 1999. Of these, close on 3000 projects were selected because of their scientific and technological excellence, their economic and social added value and their guarantees of sound management, following independent evaluations and negotiations with the Commission. International cooperation activities under COST (European cooperation in the field of scientific and technical research) and Eureka (European Research Coordination Agency) and with EFTA and the main industrialised countries (United States, Canada, Australia.
Figure

+7


Related documents
This is a repository copy of Changes in silk feedstock rheology during cocoon construction: the role of calcium and potassium ions.. White Rose Research Online URL for this
UMFASSEN NICHT DIE ABZIEHBAREN ENERGIESTEUERN VON 5 ORE AUF DEM C02 UND VON 27 ORE / THE PRICES EXCLUDING VAT DOES NOT INCLUDE THE DEDUCTIBLE TAXES OF 5 ORE FOR THE C02 TAX AND OF
This report has been produced by the group of independent experts on legislative and administrative simplification set up by the Commission in September 1994 to assess
Whereas the Commission has undertaken, within the framework of the General Agreement on Tariffs and Trade (GATT), to open an annual community tariff quota at a rate of duty of
The electrical damping coefficient effect reflected to the knee joint ( ) is shown in Figure 6 with respect to the knee angle and the external resistance.. It is clear
The paper focuses on the self-reported behaviours of primary care healthcare professionals in 10 European countries to support patients with taking prescribed medicines for
influence on the level of the vehicle taxes, or because there exist technical prerequisites for the introduction of a Community-wide harmonisation of national
States, and on the other hand, the risks of distortion of competition PestJlting, in so far as the purchases of final consumers are concerned, from rate
