Ecology and Evolution. 2018;8:13–24. www.ecolevol.org
|
13 Received: 12 April 2017|
Revised: 6 October 2017|
Accepted: 11 October 2017DOI: 10.1002/ece3.3593
O R I G I N A L R E S E A R C H
Search and foraging behaviors from movement data: A
comparison of methods
Ashley Bennison
1,2|
Stuart Bearhop
3*
|
Thomas W. Bodey
3|
Stephen C. Votier
4|
W. James Grecian
5|
Ewan D. Wakefield
5,6|
Keith C. Hamer
7*
|
Mark Jessopp
1*
This is an open access article under the terms of the Creative Commons Attribution License, which permits use, distribution and reproduction in any medium, provided the original work is properly cited.
© 2017 The Authors. Ecology and Evolution published by John Wiley & Sons Ltd. *Co-senior authorship.
1MaREI Centre for Marine and Renewable Energy, Environmental Research Institute, University College Cork, Cork, Ireland
2School of Biological, Earth, and Environmental Sciences (BEES), University College Cork, Cork, Ireland
3Centre for Ecology &
Conservation, University of Exeter, Penryn, UK
4Environment & Sustainability
Institute, University of Exeter, Penryn, UK 5Sea Mammal Research Unit, Scottish Oceans Institute, University of St Andrews, St Andrews, Fife, Scotland
6Institute of Biodiversity, Animal Health and Comparative Medicine, College of Medical, Veterinary, and Life Sciences, University of Glasgow, Glasgow, Scotland
7Faculty of Biological Sciences, School of Biology, University of Leeds, Leeds, UK
Correspondence
Ashley Bennison, Environmental Research Institute, MaREI Centre for Marine and Renewable Energy, University College Cork, Cork, Ireland.
Email: [email protected]
Funding information
Natural Environment Research Council, Grant/Award Number: IRF NE/M017990/1 and NE/H007466/1; Irish Research Council, Grant/Award Number: GOIPG/2016/503; Marine Renewable Energy Ireland (MaREI); The SFI Centre for Marine Renewable Energy Research, Grant/Award Number: 12/RC/2302
Abstract
Search behavior is often used as a proxy for foraging effort within studies of animal movement, despite it being only one part of the foraging process, which also includes prey capture. While methods for validating prey capture exist, many studies rely solely on behavioral annotation of animal movement data to identify search and infer prey capture attempts. However, the degree to which search correlates with prey capture is largely untested. This study applied seven behavioral annotation methods to identify search behavior from GPS tracks of northern gannets (Morus bassanus), and compared outputs to the occurrence of dives recorded by simultaneously deployed time–depth recorders. We tested how behavioral annotation methods vary in their ability to iden-tify search behavior leading to dive events. There was considerable variation in the number of dives occurring within search areas across methods. Hidden Markov mod-els proved to be the most successful, with 81% of all dives occurring within areas identified as search. k- Means clustering and first passage time had the highest rates of dives occurring outside identified search behavior. First passage time and hidden Markov models had the lowest rates of false positives, identifying fewer search areas with no dives. All behavioral annotation methods had advantages and drawbacks in terms of the complexity of analysis and ability to reflect prey capture events while minimizing the number of false positives and false negatives. We used these results, with consideration of analytical difficulty, to provide advice on the most appropriate methods for use where prey capture behavior is not available. This study highlights a need to critically assess and carefully choose a behavioral annotation method suitable for the research question being addressed, or resulting species management frame-works established.
K E Y W O R D S
1
|
INTRODUCTION
Movement is major part of a species’ ecology. The underlying pro-cesses driving the movement of individuals and populations are stud-ied widely; however, it is often unfeasible to directly observe animals through constant effort. As a result, movement studies have focussed on remote detection of animals through technologies such as GPS and satellite tracking. The development, miniaturization, and reduction of cost in remote tracking technologies have enabled its widespread use in ecological studies (Cagnacci, Boitani, Powell, & Boyce, 2010). Remote tracking enables behaviors to be inferred from an animals’ trajectory (Buchin, Driemel, Kreveld, & Sacristán, 2010), and has led to rapid advances in the understanding of species’ ecology (Nathan et al., 2008).
While movement patterns are often used to distinguish active phases from rest, or search behavior from traveling (van Beest & Milner, 2013; Dzialak, Olson, Webb, Harju, & Winstead, 2015), identifying these behavioral states typically relies on more complicated modeling procedures to detect potential underlying mechanisms within behav-ior identification (Jonsen, Myers, & James, 2006; Kerk et al., 2015). Considerable progress has been made in developing methods that can categorize behaviors based on simple movement metrics (Edelhoff, Signer, & Balkenhol, 2016). These methods commonly identify mul-tiple states and ascribe these to predefined behaviors such as search, rest, or travel (Evans, Dall, Bolton, Owen, & Votier, 2015; Guilford et al., 2008; Hamer, Phillips, Wanless, Harris, & Wood, 2000; King, Glahn, & Andrews, 1995; Palmer & Woinarski, 1999; Shepard, Ross, & Portugal, 2016; Weimerskirch et al., 2006). However, Gurarie et al. (2016) argued for closer and more detailed exploratory analysis of movement data to prevent mis- specification of behavior, suggesting that the strengths of particular methods need to be more carefully considered so they are suitably attuned to the specific questions being asked by researchers.
Within conservation management, there is an increasing reliance on identifying space use by species of conservation concern (Allen & Singh, 2016). For example, within the marine environment, forag-ing areas could be considered for the protection and management of seabird species (Lascelles et al., 2016). The use of these approaches may contribute to the establishment of conservation measures includ-ing designation of marine protected areas (Grüss, Kaplan, Guénette, Roberts, & Botsford, 2011). Foraging activity is a key component in an animal’s time and energy budget, and it is well established that an-imals in environments with patchy resources must engage in search behavior to optimize their foraging effort in terms of maximizing prey encounters (MacArthur & Pianka, 1966). Therefore, foraging can be considered a two- part system, containing both search and prey cap-ture attempts (Charnov, 1976). Understanding the interaction between search and prey capture is a key component in optimal foraging theory (Pyke, 1984). For example, while there has been much work identifying area- restricted search (Knell & Codling, 2012), there is little informa-tion on the relainforma-tionship between search and prey capture. Validainforma-tion of search behavior is difficult particularly in animals where direct ob-servation is challenging, such as those in many biotelemetry studies.
Many movement studies use path segmentation techniques to detect search behavior; however, many of these are unvalidated estimates of search due to the lack of a second data stream for ground- truthing. Validation of prey capture attempts has been achieved using animal- borne cameras (Bicknell, Godley, Sheehan, Votier, & Witt, 2016; Moll, Millspaugh, Beringer, Sartwell, & He, 2007), time–depth recorders (Dean et al., 2012; Shoji et al., 2015; Tinker, Costa, Estes, & Wieringa, 2007), stomach loggers (Weimerskirch, Gault, & Cherel, 2005), and accelerometers (Hansen, Lascelles, Keene, Adams, & Thomson, 2007; Sato et al., 2007) among others. However, many of these technologies are either expensive resulting in small sample sizes or are too large to deploy on animals in combination with location loggers without significant adverse impacts (Barron, Brawn, & Weatherhead, 2010; Hammerschlag, Gallagher, & Lazarre, 2011; Vandenabeele, Shepard, Grogan, & Wilson, 2012). As a result, many studies still rely on the sole use of location data and path segmentation approaches to iden-tify behavior. The determination of behavior from movement data is an active area of research and the subject of many reviews (Allen, Metaxas, & Snelgrove, 2017; Edelhoff et al., 2016; Hays et al., 2016; Jacoby, Brooks, Croft, & Sims, 2012). There are several different meth-ods for undertaking behavioral annotation or detecting important areas of high use by animals. Frequently used are movement pattern description and process identification. Methods based around move-ment pattern description are often aimed at trying to split between different behavioral periods or to locate changes in behavior (Edelhoff et al., 2016). Process identification aims to take things a step further and concentrates on methods that are focussed toward being able to describe the underlying processes, whether extrinsic or intrinsic, and describe how these inform behavior.
Northern gannets (Morus bassanus), hereafter gannets, are a well- studied species that occur principally in the temperate shelf seas of the North Atlantic during the breeding season. Gannets are visual predators (Cronin, 2012) and undertake plunge- diving from height, entering the water at speeds of up to 24 m/s (Chang et al., 2016). Prior to diving, gannets typically slow their flight and increase their path sinuosity (Wakefield et al., 2013; Bodey et al., 2014; Patrick et al., 2014; Warwick- Evans et al., 2015). The relationship between slow speed during search and prey capture attempts has been established both theoretically (Bartoń & Hovestadt, 2013; Benhamou, 2004) and empirically in a variety of mobile marine and terrestrial species (Anderson & Lindzey, 2003; Byrne & Chamberlain, 2012; Edwards, Quinn, Wakefield, Miller, & Thompson, 2013; McCarthy, Heppell, Royer, Freitas, & Dellinger, 2010; Towner et al., 2016; Wakefield et al., 2013; Williams et al., 2014). Such changes in movement and clearly identifiable prey capture attempts in the form of dives (Cleasby et al., 2015; Garthe, Benvenuti, & Montevecchi, 2000), as well as their ability to carry multiple devices and ease of recapture, make gannets a suit-able model species to explore the ability of movement- based analysis to identify search behavior and prey capture attempts.
areas identified as search. With consideration given to opportunistic foraging, we hypothesize that more successful methods of search clas-sification will contain more true positives (dive events occurring within identified search), fewer false positives (search containing no dives), and fewer false negatives (dives occurring outside identified search behavior). Using this framework, we will also provide recommenda-tions on the appropriate use of methodological approaches.
2
|
MATERIALS AND METHODS
2.1
|
Data collection
Breeding adults at two island colonies, Great Saltee, Co. Wexford, Ireland (52.11286, −6.62189) and Bass Rock, Scotland, UK (56.07672, −2.64139), were tracked while attending 2 to 7- week- old chicks over a 38- day period from late June to early August 2011. Nine birds at Great Saltee and eight birds at Bass Rock were caught using a metal crook or wire noose fitted to a 4 to 6- m pole and fitted with GPS log-gers coupled with time–depth recorders (TDRs). GPS loglog-gers (i- gotU GT- 200, Mobile Action Technology Inc., Taipei, Taiwan, 37 g), sealed in heatshrink plastic, recorded locations every 2 min. CEFAS G5 TDRs (CEFAS Technology, Lowestoft, UK, 2.5 g) were deployed using the fast- log dive sensor at 4 Hz and used to identify dive events based on a 1 m depth threshold being exceeded, hereafter TDR dives. This was to ensure dives reflected prey capture attempts (median dive depth of 4.6 m in plunge- diving gannets and 8 m when pursuit div-ing (Garthe et al., 2000) rather than other surface- related activities such as resting, washing, or preening. Devices were attached follow-ing (Grémillet et al., 2004), and involved affixfollow-ing loggers ventrally to 2–4 central tail feathers using strips of waterproof Tesa© tape. Total instrument mass was ≤2% of body mass, below the maximum recommended for seabird biologging studies (Phillips, Xavier, & Croxall, 2003), and tag position was considered to minimally impede gannets aerodynamically or hydrodynamically (Vandenabeele et al., 2012). Deployment and retrieval handling times were approximately 10 min.
2.2
|
Data processing
GPS tracks were processed using the AdehabitatLT package (Calenge, 2011) in the R statistical Framework. Location data were transformed into Cartesian coordinates using a Universal Transverse Mercator (UTM) 30N projection before calculating step length and turning an-gles. Although GPS tags were programmed to take locations every 2 min, if there was no available GPS signal (because a bird was div-ing for example), locations may not have been exactly two minutes apart, and so tracks were standardized through linear interpolation to a two- minute interval. Speed, step length, turning angle, and distance from colony were calculated for every point along a bird’s track. Points within 5 km of the colony were removed to avoid potential locations associated with colony rafting and bathing (Carter et al., 2016), as were those occurring at night (between civil sunset and sunrise) be-cause gannets are visual diurnal foragers (Nelson, 2002). TDR dives were split into dive events and produced a single timestamp point rep-resenting the start of any dive event over 1 m for appending to tracks following behavioral classification.
We applied a suite of methods commonly used to identify search-ing or infer foragsearch-ing behaviors from movement data, summarized in Table 1. The methods are not considered exhaustive, but represent a range of approaches covering movement pattern description and process identification (Edelhoff et al., 2016). Movement pattern de-scription approaches include kernel density, first passage time (FPT), and speed/tortuosity thresholds, while process identification tech-niques applied covered k- means clustering and two state- space mod-els, hidden Markov models (HMM) and effective maximization binary clustering (EMbC). The two forms of state- space models were used to represent diverging classes of state- space model; maximum likeli-hood methods (EMbC), and Bayesian Monte Carlo methods (HMM) (Patterson, Thomas, Wilcox, Ovaskainen, & Matthiopoulos, 2008). While not predicting/identifying search behavior directly, we also applied machine learning (generalized boosted regression models) to predict dives from track metrics rather than search behavior. We fol-lowed the standard methodology for each technique outlined in the
T A B L E 1 Summary of common
methodological approaches to identifying search and foraging behavior in movement data. While all methods require validation data to assess how well the method works, it is not necessarily required to implement the method
Method
Analysis complexity
Requires validation data
Suitable for investigating relationships with environmental variables
Immediately applicable to other species/ locations Machine
learning
High & large data requirement
Yes Yes No
k- Means Low No Yes Yes
Thresholds Medium Yes Yes No
FPT Medium No Yes Yes
HMM Medium Noa Yes Yes
Kernel density
Low No Dependent on scale Yes
EMbC Low No Yes Yes
published literature, and provide references for detailed guidance on applying each approach.
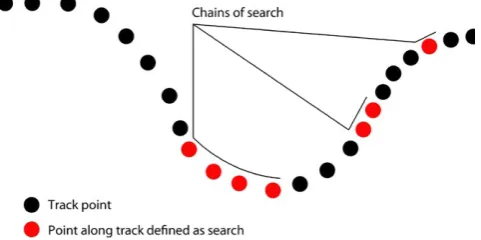
Methods of predicting search behavior routinely identify chains of search in successive locations. Chains can be a single point in length or may include multiple consecutive points along a movement track (see Figure 1). Given that in gannets, individual prey capture attempts (dives) occur at discrete locations/times, we extracted metrics of dives occurring within search, dives outside of search, and search containing no dive. Data from the two colonies were processed independently to account for potential differences in movement metrics associated with differences in local habitat and prey availability.
2.3
|
Kernel density
Time in space is considered to be a good proxy for foraging effort (Warwick- Evans et al., 2015). GPS locations (excluding locations within 5 km of the colony and locations at night) were used to esti-mate kernel densities in ArcMap 10.2, which uses a kernel smoothing function based on the quartic kernel function by Silverman (1986), and had a bandwidth/search distance of 10 km. This was used to create a kernel density square grid with sides of 10 km. The method produces a 10 km2 grid with relative intensity of both TDR dives and GPS tracks.
Dutilleul’s modified spatial t test (Dutilleul, Clifford, Richardson, & Hemon, 1993) was used to determine the spatial correlation between the intensity of dives and intensity of tracks, accounting for spatial autocorrelation in the data.
2.4
|
First passage time
First passage time (FPT) analysis was undertaken following Fauchald and Tveraa (2003). Although tracks were rediscretized in time for all other analysis, FPT requires tracks to be redistributed in space to account for changes in bird speed, and so tracks were redistributed using linear interpolation to 500- m distances. Analysis was under-taken using the AdehabitatLT package in R (Calenge, 2011). Based on the behavioral response ranges reported by Bodey et al. (2014) for gannets, circles of radii ranging from 50 m to 12,000 m were used to construct first passage time values. The maximum log- variance of first passage time values was then used to determine appropriate search
radii for each individual bird. The slowest sextile of passage times was considered to be relatively higher intensity search behavior as used by Nordstrom, Battaile, Cotte, and Trites (2013), and also indicated in work by Hamer et al. (2009) following Fauchald and Tveraa (2003). Search radii were used to create an amalgamated area of search along an individual bird’s track, with GPS points along this track treated as “search” points. Although FPT can be used to determine nested lev-els of area- restricted search (Hamer et al., 2009), we have considered only the highest levels of search behavior to maximize the number of dives potentially occurring within search.
2.5
|
k
- Means clustering
k- Means clustering is a method of vector quantization that aims to partition n observations into k clusters, and has been used to clus-ter data points consistent with different behaviors (Jain, 2010). k- Means clustering was undertaken using the MacQueen algorithm (MacQueen, 1967) on step length and turning angle between succes-sive GPS locations. The optimum number of clusters was determined using the “elbow method” where the percentage of variance explained (the ratio of the between- group variance to the total variance) is plot-ted as a function of the number of clusters and the point where addi-tion of further clusters results in only marginal increases in explained variance (Ketchen & Shook, 1996). This resulted in three clusters, and these were then assigned behavioral states based on logical differ-ences between the means of variables in each group. The cluster with largest step length and smallest tortuosity was defined as travel, short step length and intermediate tortuosity were considered consistent with rest, and intermediate step length and high tortuosity were con-sidered consistent with search behavior following Zhang, O’Reilly, Perry, Taylor, and Dennis (2015).
2.6
|
Speed–tortuosity thresholds
Speed–tortuosity thresholds from Wakefield et al. (2013) were ap-plied to the data. These were developed based on prior knowledge of gannet foraging behavior and an iterative examination of plausi-ble thresholds of movement indices from those initially suggested by Grémillet et al. (2004). Thresholds suggested by Wakefield et al. (2013) were applied as they were based on data from tracked gannets from a range of colonies, including the data analyzed in this study. Successive GPS locations were considered to represent search if they met any one of three conditions:
1. Tortuosity <0.9 and speed >1 m/s
2. Speed >1.5 m/s and <9 m/s
3. Tortuosity ≥0.9 and acceleration <−4 m/s2
Speed and acceleration were calculated between L−1 and L0 where L0
is the focal point, while tortuosity is the ratio of the straight line to along the track distance between L−4 and L4. Criteria were defined based on GPS and TDR data from Bass Rock deployments used in this study and are therefore created from a priori information.
F I G U R E 1 Conceptual diagram of locations through time
[image:4.595.49.290.573.693.2]2.7
|
Hidden Markov Models
Hidden Markov Models (HMM) are an example of state- space mod-eling, where models are formed of two parts, an observable series and a nonobservable state sequence (Langrock et al., 2012). The observ-able series, in this context, take the form of GPS relocations with con-sequential step length and turning angle, while the nonobservable are behavioral states. HMM use a time series to determine what denotes the underlying states and the changes between them. The applica-tion of state- switching models to movement data allows behavioral modes to be examined, while considering the high degree of autocor-relation present in telemetry data (Patterson et al., 2008). When the observational error is low, hidden Markov models offer a more trac-table approach to discretize behavioral modes from telemetry data than Bayesian approaches (Langrock et al., 2012). Using the R pack-age moveHMM (Michelot, Langrock, & Patterson, 2016), the move-ment of each individual along a foraging trip was classified into one of three underlying states by characterization of the distributions of step lengths and turning angles between consecutive locations. A three- state model was a better fit to the data than a two- state model, and is consistent with previous work describing gannet movement (Bodey et al., 2014) as well as the identification of three states in EMbC and
k- means clustering approaches within this study. Model iterations successfully converged to three states suggesting a good fit to the data. A gamma distribution was used to describe the step lengths, a von Mises distribution described the turning angles, and the Viterbi algorithm was used to estimate the most likely sequence of movement states to have generated the observations (Zucchini, MacDonald, & Langrock, 2016).
2.8
|
Expectation–maximization binary clustering
Expectation–maximization binary clustering (EMbC) protocols are an unsupervised, multivariate example of a state- space modeling frame-work that can be used for behavioral annotation of movement tra-jectories, including search behavior (see Garriga, Palmer, Oltra, and Bartumeus (2016)). EMbC has been designed to be a simple method of analyzing movement data based on the geometry alone, and can behaviorally annotate movement data with minimal supervision. EMbC is a relatively modern technique that is gaining traction within movement ecology. It has previously been used in a variety of move-ment studies, including exploring behavioral differences between dis-tinct populations of the red- footed booby (Mendez et al., 2017) and coupling energy budgets with behavioral patterns under an optimal foraging framework (Louzao, Wiegand, Bartumeus, & Weimerskirch, 2014). Analysis was undertaken using the EMbC package in R (Garriga & Bartumeus, 2015), using calculated velocities and turning angles to infer behavioral classifications.
2.9
|
Machine learning
While the methods outlined above all identify search behavior, ma-chine learning models are trained to specifically identify prey capture/
dive events based on track metrics. Analysis was undertaken using the Caret package in R (Kuhn, 2008) using generalized boosted regres-sion models to account for zero- inflation (Elith, Leathwick, & Hastie, 2008). Models were built using step length, speed, turning angle, hour of day, and tortuosity. Models were trained using 75% of the linked GPS/TDR dive data, with the remaining 25% of data kept for valida-tion of predicvalida-tions, and underwent cross- validavalida-tion 500 times during the training procedure. By combining all individual animal’s data in this manner, we ensure that any intra- individual variation is accounted for in the modeling process. Receiver operator curves (ROCs) were cal-culated (Fielding & Bell, 1997) to determine the model of best fit at each colony.
2.10
|
Comparison of methods using TDR dives
In order to compare the predictive power of the seven methods out-lined above in predicting areas in which dives occurred, TDR dive events were linked to GPS coordinates by matching the time/date stamps of both datasets for each individually tracked bird. To compare how well the methods capture dive events within areas of search, the proportion of dives within identified areas of search (true positive) as well as the number of search chains containing no dives (false posi-tive) was calculated for FPT, k- means, thresholds, HMM, and EmbC. The correlation between kernel densities of GPS tracks and TDR dives was assessed using a Dutilleul’s modified spatial t test (Dutilleul et al., 1993). This analysis provides a correlation coefficient across the spa-tial extent of the tracked data to determine how well the two datasets correlate while accounting for spatial autocorrelation. Model perfor-mance for machine learning was assessed using kappa values, a meas-ure of variability explained by the model akin to R2 values, where 0 is
equal to no relationship and 1 is equal to a perfect relationship as per Landis and Koch (1977). Further to this, a confusion matrix was calcu-lated by running models on the remaining 25% test data to assess the number of correctly and incorrectly identified dives.
3
|
RESULTS
Nine GPS & TDR combinations were deployed at Great Saltee, result-ing in 31,716 locations after standardization to a two- minute interval. Eight GPS & TDR combinations were deployed at Bass Rock, resulting in 21,208 relocations when standardized. There were a total of 2,830 TDR dives among the tracked birds at Great Saltee and 2,172 at Bass Rock. Examples of maps produced by methods and showing the loca-tion of TDR dives can be seen in the Supplementary Materials (see Figs. S1–10).
most discrete search areas with the shortest chains (mean 3.08 loca-tions/chain). Using Kendall’s tau correlation, there was a weak positive correlation between the length of search chains and the number of dives occurring within them (Table 3).
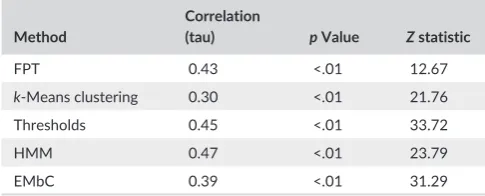
The performance of behavioral classification methods was as-sessed by comparing the occurrence of TDR dives inside and outside of predicted search behavior (Table 2). HMM captured the highest proportion of TDR dives (Figure 2a) within search areas, and had the second lowest false- positive rate (Figure 2b). FPT had the longest identified search chains, but these actually captured the lowest num-ber of dives across all methods (Table 2, Figure 2a). Despite the low true- positive rates, FPT had the lowest false- positive rate (Figure 2b). Thresholds and EMbC were comparatively similar in both the rates of true and false positives, while k- means clustering had the lowest true- positive and highest false- positive rates of all methods tested.
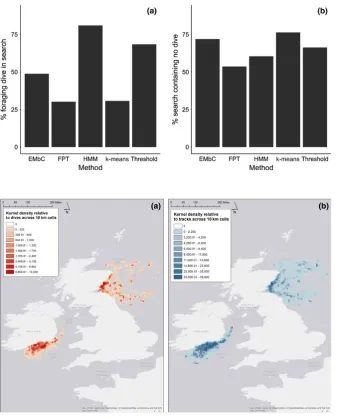
Kernel density of GPS locations did not explicitly identify search behavior but identified “hot spots” of foraging corresponding to time spent in each 10 × 10 km grid cell, with a high proportion of time spent in the area surrounding colonies (Figure 3). Dutilleul’s modified spatial
t test demonstrated a good correlation between the spatial distribu-tion of TDR dives and time in space (Table 4), with the better correla-tion (0.86) at Bass Rock. Machine learning models directly predicted the location of prey capture events. The models trained and tested on their own colony indicated only a fair or slight agreement within the data (following Landis and Koch, 1977) (Table 5). Furthermore, the confusion matrix (Table 6) showed that the predictive power of the models at both colonies was poor, only successfully predicting 22% of dives in the test dataset. When models built in one colony were ap-plied to others, there was a further loss of predictive power, indicating that model structures and movement patterns between colonies are different (Table 4).
4
|
DISCUSSION
Seven methods of classifying search behavior were compared to a validation dataset of TDR dive events in northern gannets to deter-mine their ability to accurately capture the two components of forag-ing activity—searchforag-ing and prey encounter/capture. Across methods, the number of prey capture attempts (TDR dives) within search varied considerably, with the highest being captured by hidden Markov mod-els (81%) and the lowest captured by first passage time and k- means clustering (30% and 31%, respectively). While HMM had the highest rate of capture of dive events, it also had one of the lowest rates of false positives, identifying fewer search chains where no dive was re-corded. While this was still relatively high (60%), all methods produced high numbers of search chains that contained no TDR dives (range 53%–76%). There was a weak correlation between chain length and number dives within a chain. While prey capture attempts will increase with trip and search duration (Sommerfeld, Kato, Ropert- Coudert, Garthe, & Hindell, 2013), the weak correlation represents some longer search chains containing relatively few prey capture attempts due to individuals searching over poor- quality areas, or simply that search
TABLE 2 Comparison of search id entification a cross methods at Great Saltee and Bass Rock with associated TDR dives at each colony. True po sitives are wh en a dive occurs within a chain of locations identified as search, false positives are when a chain of locations identified as search does not contain a TDR dive, and false negatives are when a dive occurs outside of areas identified as search, and will include opportunistic foraging events Method Great Saltee Bass Rock
No of relocations: 31,716 No of dives: 2,830 No of relocations: 21,208 No of dives: 2,172
Rate of true positives (% dives in search) Rate of false positives (% search chains with no dive) Rate of false negatives (% dives outside of search) Time spent in searching
b (% of
relocations searching)
Rate of true positives (% dives in search) Rate of false positives (% search chains with no dive) Rate of false negatives (% dives outside of search) Time spent in searching
b (% of
does not always result in prey capture attempts. These findings sug-gests that significant effort is spent in unsuccessful search behavior, consistent with low prey encounter rates associated with foraging on spatially and temporally patchy prey resources (Weimerskirch, 2007).
While the spatial distribution of tracked gannets will encompass a variety of behaviors including foraging, travel, and rest periods, sim-pler methodologies such as kernel density estimation of track data cor-related well with kernel densities of TDR dive events. This supports the assertion that time in area is a good proxy for foraging effort (Grémillet et al. 2004; Warwick- Evans et al., 2015). However, this approach uti-lizes larger areas of space beyond movement paths, and so it is not capable of identifying foraging in association with temporally ephem-eral events or features that may directly change an animal’s movement trajectory. Within more process- driven approaches, FPT is arguably one of the most ubiquitous methods used to identify foraging areas in both terrestrial and marine systems (Battaile, Nordstrom, Liebsch, & Trites, 2015; Byrne & Chamberlain, 2012; Evans et al., 2015; Hamer et al., 2009; Le Corre, Dussault, & Côté, 2014). FPT captures search behavior across multiple spatial scales and is particularly noted for its ability to detect nested scales of area- restricted search (Hamer et al., 2009). While we did not investigate nested scales of search, FPT, along with k- means clustering, had the lowest rate of dives occurring within broad areas of identified search. However, in contrast to k- means, FPT had the lowest rate of false positives (search containing no dives), likely as a result of identifying very large, contiguous areas of search.
k- Means clustering and FPT had high rates of false negatives, with ap-proximately 70% of all dives occurring outside identified search be-havior. A certain amount of opportunistic foraging is anticipated in any wide- ranging predator (Montevecchi, Benvenuti, Garthe, Davoren, & Fifield, 2009), resulting in dive events occurring outside classical pat-terns of search movement. However, the high rate of dives occurring outside search as defined by FPT and k- means suggests that either the majority of prey capture attempts occur opportunistically or that the scale of ARS changes spatially, resulting in search behavior associated with dives being missed.
Speed–tortuosity thresholds “captured” 68% of TDR dives within areas identified as search. There is evidence to suggest that humans are more capable than machines at pattern recognition when pre-sented with limited data (Samal & Lyengar, 1992). It is therefore unsurprising that thresholds performed well considering that they were constructed based on prior knowledge of foraging behavior and iterative examination of thresholds against a validation dataset
in gannets (Wakefield et al., 2013). The relatively high rates of false positives (66% of search chains containing no TDR dive) were within the spread of values for other methods, highlighting significant ef-fort spent searching for prey interspersed with relatively few prey encounters.
The state- space modeling framework has been acknowledged as particularly useful in movement ecology (Patterson et al., 2008), and is rapidly expanding within path segmentation techniques (Michelot et al., 2016; Roberts & Rosenthal, 2004). Both the EMbC and HMM approaches model the changes in step length and turning angle through time and space to annotate the trajectory of an animal with behavioral states (Garriga et al., 2016; Michelot et al., 2016). EMbC protocols resulted in shorter search chains that encapsulated 49% of all dive events, while HMM identified longer chains of search that cap-tured the highest number of dives (81%) of any method. While HMM defined the highest number of points as search across all methods, it also had one of the lowest rates of false positives. Less than 20% of dives occurred outside of search. This would be more consistent with opportunistic foraging and provides further empirical evidence of search behavior leading to prey capture attempts (Dias, Granadeiro, & Palmeirim, 2009; Weimerskirch, Pinaud, Pawlowski, & Bost, 2007). The high number of shorter search chains identified by EMbC, coupled with the fact that it is possible to link state transitions to environmen-tal covariates in a HMM framework, suggests that both these meth-ods may also be suitable for or investigating behavioral response to ephemeral environmental cues.
Regional differences in habitat and prey, as well as inter- and intraspecific competition are likely to influence the way an animal forages (Huig, Buijs, & Kleyheeg, 2016; Schultz, 1983; Zach & Falls, 1979). To account for this, the colonies were treated independently during analysis. Machine learning did highlight slight differences between colonies in the movement metrics considered to be of most predictive power, suggesting local differences in movement associated with foraging and search. Machine learning was the only method that directly predicted prey capture events rather than search behavior. While the explanatory power of the models was deemed to be satisfactory, the predictive ability of models was poor, only correctly identifying 22% of dives in the test dataset. The suc-cess of this method may have been limited by the available sample size. As a powerful tool, machine learning approaches do require large amounts of data, are computationally complex, and require a priori knowledge of dive events to train the model. However, ma-chine learning protocols are still being developed within ecological research, and such data mining remains a challenge for accurate classification (Hochachka et al., 2007).
An interesting consideration throughout the methods presented, here, is the ability to identify multiple behavioral states. HMM, k- means, and EMbC are capable of identifying behavior consistent with rest within the tracking period (typically very low speed and a medium- to- high tortuosity values). In this context, kernel density, FPT, speed– tortuosity thresholds, and machine learning did not identify periods of rest. The majority of behavioral annotation relies on the principle of animals slowing down and paths becoming more tortuous when
T A B L E 3 Kendall’s tau correlation between search chain length
and number of dives contained within each chain
Method
Correlation
(tau) p Value Z statistic
FPT 0.43 <.01 12.67
k- Means clustering 0.30 <.01 21.76
Thresholds 0.45 <.01 33.72
HMM 0.47 <.01 23.79
[image:7.595.44.287.634.732.2]searching (Bartoń & Hovestadt, 2013; Benhamou, 2004). However, slowing down and turning more could also be an indication of rest behavior, especially when considering potential error from closely positioned GPS relocations (Hurford, 2009; Jerde & Visscher, 2005). The ability to exclude a period that closely resembles search patterns could have the potential to reduce false- positive periods of search, and we accounted for this as much as possible by removing locations in proximity to the colony as well as locations occurring at night before comparing methods. While not directly assigning a rest period, it is
F I G U R E 2 Proportion of (a) TDR dives
occurring within ‘search” behavior (true positives) and (b) search chains containing no TDR dives (false positives) using EMbC, FPT, HMM, k- means, and speed–tortuosity thresholds
F I G U R E 3 Kernel densities of gannet
tracks at both Great Saltee and Bass Rock for (a) dive locations and (b) individual bird tracks. Scale is of relative time in space across the spatial boundary of 10 km throughout the tracking area
(a) (b)
T A B L E 4 Dutilleul’s correlation between kernel densities of all
GPS locations and confirmed dive locations
Colony Correlation p Value F statistic
Degrees of freedom
Great Saltee 0.79 <.01 123.37 69.57
Bass Rock 0.87 <.01 991.88 329.90
T A B L E 5 Kappa values for machine learning models where
models developed using colony- specific data are applied at the colony from which training data were taken and at a different colony. Low values for models trained at one colony applied to the other colony suggest very poor model fit
Model trained
Model applied
Great Saltee Bass Rock
Great Saltee 0.2456 −0.0006757
Bass Rock 0.02792 0.1885
T A B L E 6 Confusion matrix table totals of predictions made
across machine learning models at both Great Saltee and Bass Rock
Predicted result
Reference (true value) in test data set
Dive No dive
Dive 222 258
[image:8.595.46.392.44.464.2] [image:8.595.47.289.522.580.2] [image:8.595.307.551.522.599.2] [image:8.595.46.289.666.733.2]important to note that speed–tortuosity thresholds could be adapted to include the annotation of rest and travel, as well as specific search behavior. In a similar fashion, machine learning protocols could also be applied to predict behaviors other than diving.
Careful choices must be made in the selection and application of behavioral classification methods when inferring foraging. While all methods tested generally supported the hypothesis that search behavior leads to prey encounter and subsequent prey capture at-tempts in a wide- ranging pelagic predator, there was considerable variation in the degree to which this was noted. The HMM method produced estimates of foraging behavior that most effectively en-capsulated both search and prey capture components of foraging. As such, it would seem a sensible recommendation that HMM be used when identifying foraging (including both search and prey capture) areas is a priority. Across methods, rates of false negatives (dives occurring outside of search behavior) ranged from 19% to 70%. While some of this may be attributed to opportunistic feeding outside of search behavior, methods with high rates of false nega-tives suggest that care should be taken when using behavioral clas-sification methods. That animals spend considerable time actively searching for prey, while prey capture occurs largely outside of this activity seems improbable, and poor classification of behaviors can have implications when considering time–energy budgets and sub-sequent reproductive success or survival. Methods such as HMM, EMbC, and thresholds had the lowest rates of dives occurring out-side of search. These methods may be more attuned to capturing dive events and therefore represent a more inclusive definition of foraging, while FPT and k- means clustering may be more general in their identification of search. Investigating the differences between methods may lead to increased understanding of the environmental cues used by predators to initiate search and prey capture as well as the scales at which these cues occur. Nevertheless, we reiterate the need for detailed exploratory analysis of movement data to prevent mis- specification of behavior (Gurarie et al. (2016)) and argue for methods to be used based on suitability, and the questions being asked by researchers.
ACKNOWLEDGMENTS
We would like to thank all those involved in fieldwork as well as land-owners of both colonies for allowing access for research, in particular Sir Hew Hamilton- Dalrymple for permitting fieldwork at Bass Rock, the Neale family for permitting work on Great Saltee, and the Scottish Seabird Centre for logistical support and advice. This study was funded by NERC Standard Grant NE/H007466/1. AB is funded by the Irish Research Council (Project ID: GOIPG/2016/503). MJ is funded under Marine Renewable Energy Ireland (MaREI), The SFI Centre for Marine Renewable Energy Research (12/RC/2302), and EW is funded by the NERC (IRF NE/M017990/1).
CONFLICT OF INTEREST
None declared.
AUTHOR CONTRIBUTIONS
AB, MJ, and SB conceived the initial ideas and designed methodology. WJG undertook analysis for HMM, AB undertook remaining analy-sis. MJ, WJG, EW, TWB, SCV, and KH provided advice and guidance on analytical frameworks and manuscript preparation. AB and MJ led the writing of the manuscript. All authors contributed critically to the drafts and gave final approval for publication.
DATA ACCESSIBILITY
Data reported in this article are archived by Birdlife International (www.seabirdtracking.org).
ORCID
Ashley Bennison http://orcid.org/0000-0001-9713-8310 Thomas W. Bodey http://orcid.org/0000-0002-5334-9615 W. James Grecian http://orcid.org/0000-0002-6428-719X
REFERENCES
Allen, R. M., Metaxas, A., & Snelgrove, P. V. (2017). Applying movement ecology to marine animals with complex life cycles. Annual Review of
Marine Science, 10, https://doi.org/10.1146/annurev-marine-121916-
063134
Allen, A. M., & Singh, N. J. (2016). Linking movement ecology with wild-life management and conservation. Frontiers in Ecology and Evolution, 3, 155. https://doi.org/10.3389/fevo.2015.00155
Anderson, C. R. Jr, & Lindzey, F. G. (2003). Estimating cougar predation rates from GPS location clusters. The Journal of Wildlife Management,
67, 307–316. https://doi.org/10.2307/3802772
Barron, D. G., Brawn, J. D., & Weatherhead, P. J. (2010). Meta- analysis of transmitter effects on avian behaviour and ecology. Methods
in Ecology and Evolution, 1, 180–187. https://doi.org/10.1111/
mee3.2010.1.issue-2
Bartoń, K. A., & Hovestadt, T. (2013). Prey density, value, and spatial distribu-tion affect the efficiency of area- concentrated search. Journal of Theoretical
Biology, 316, 61–69. https://doi.org/10.1016/j.jtbi.2012.09.002
Battaile, B. C., Nordstrom, C. A., Liebsch, N., & Trites, A. W. (2015). Foraging a new trail with northern fur seals (Callorhinus ursinus): Lactating seals from islands with contrasting population dynamics have different foraging strategies, and forage at scales previously unrecognized by GPS interpolated dive data. Marine Mammal Science, 31, 1494–1520. https://doi.org/10.1111/mms.2015.31.issue-4
Benhamou, S. (2004). How to reliably estimate the tortuosity of an animal’s path: Straightness, sinuosity, or fractal dimension? Journal of Theoretical
Biology, 229, 209–220. https://doi.org/10.1016/j.jtbi.2004.03.016
Bicknell, A. W., Godley, B. J., Sheehan, E. V., Votier, S. C., & Witt, M. J. (2016). Camera technology for monitoring marine biodiversity and human impact. Frontiers in Ecology and the Environment, 14, 424–432. https://doi.org/10.1002/fee.1322
Bodey, T. W., Jessopp, M. J., Votier, S. C., Gerritsen, H. D., Cleasby, I. R., Hamer, K. C., … Bearhop, S. (2014). Seabird movement reveals the ecological footprint of fishing vessels. Current Biology, 24, 514–515. https://doi.org/10.1016/j.cub.2014.04.041
Buchin, M., Driemel, A., vanKreveld, M., & Sacristán, V. (2010). An algorith-mic framework for segmenting trajectories based on spatio-temporal criteria. Proceedings of the 18th SIGSPATIAL International Conference on
Advances in Geographic Information Systems (pp. 202–211). New York,
Byrne, M. E., & Chamberlain, M. J. (2012). Using first- passage time to link behaviour and habitat in foraging paths of a terrestrial predator, the racoon. Animal Behaviour, 84, 593–601. https://doi.org/10.1016/j. anbehav.2012.06.012
Cagnacci, F., Boitani, L., Powell, R. A., & Boyce, M. S. (2010). Animal ecology meets GPS- based radiotelemetry: A perfect storm of opportunities and challenges. Philosophical Transactions of the Royal Society B: Biological
Sciences, 365, 2157–2162. https://doi.org/10.1098/rstb.2010.0107
Calenge, C. (2011). Analysis of animal movements in R: The adehabitatLT
package. Vienna, Austria: R Foundation for Statistical Computing.
Carter, M. I., Cox, S. L., Scales, K. L., Bicknell, A. W., Nicholson, M. D., Atkins, K. M., … Patrick, S. C. (2016). GPS tracking reveals rafting behaviour of Northern Gannets (Morus bassanus): Implications for foraging ecology and conservation. Bird Study, 63, 83–95. https://doi.org/10.1080/000 63657.2015.1134441
Chang, B., Croson, M., Straker, L., Gart, S., Dove, C., Gerwin, J., & Jung, S. (2016). How seabirds plunge- dive without injuries. Proceedings of
the National Academy of Sciences of the United States of America, 113,
12006–12011. https://doi.org/10.1073/pnas.1608628113
Charnov, E. L. (1976). Optimal foraging, the marginal value the-orem. Theoretical Population Biology, 9, 129–136. https://doi. org/10.1016/0040-5809(76)90040-X
Cleasby, I. R., Wakefield, E. D., Bodey, T. W., Davies, R. D., Patrick, S. C., Newton, J., … Hamer, K. C. (2015). Sexual segregation in a wide- ranging marine predator is a consequence of habitat selection. Marine Ecology
Progress Series, 518, 1–12. https://doi.org/10.3354/meps11112
Cronin, T. W. (2012). Visual optics: Accommodation in a splash. Current
Biology, 22, R871–R873. https://doi.org/10.1016/j.cub.2012.08.053
Dean, B., Freeman, R., Kirk, H., Leonard, K., Phillips, R. A., Perrins, C. M., & Guilford, T. (2012). Behavioural mapping of a pelagic seabird: Combining multiple sensors and a hidden Markov model reveals the distribution of at- sea behaviour. Journal of the Royal Society Interface,
10, 20120570. https://doi.org/10.1098/rsif.2012.0570
Dias, M. P., Granadeiro, J. P., & Palmeirim, J. M. (2009). Searching be-haviour of foraging waders: Does feeding success influence their walking? Animal Behaviour, 77, 1203–1209. https://doi.org/10.1016/j. anbehav.2009.02.002
Dutilleul, P., Clifford, P., Richardson, S., & Hemon, D. (1993). Modifying the t test for assessing the correlation between two spatial processes.
Biometrics, 49, 305–314. https://doi.org/10.2307/2532625
Dzialak, M. R., Olson, C. V., Webb, S. L., Harju, S. M., & Winstead, J. B. (2015). Incorporating within- and between- patch resource selection in identification of critical habitat for brood- rearing greater sage- grouse.
Ecological Processes, 4, 5. https://doi.org/10.1186/s13717-015-0032-2
Edelhoff, H., Signer, J., & Balkenhol, N. (2016). Path segmentation for begin-ners: An overview of current methods for detecting changes in animal movement patterns. Movement Ecology, 4, 21. https://doi.org/10.1186/ s40462-016-0086-5
Edwards, E. W. J., Quinn, L. R., Wakefield, E. D., Miller, P. I., & Thompson, P. M. (2013). Tracking a northern fulmar from a Scottish nesting site to the Charlie- Gibbs Fracture Zone: Evidence of linkage between coastal breeding seabirds and Mid- Atlantic Ridge feeding sites. Deep Sea
Research Part II: Topical Studies in Oceanography, 98(Part B), 438–444.
https://doi.org/10.1016/j.dsr2.2013.04.011
Elith, J., Leathwick, J. R., & Hastie, T. (2008). A working guide to boosted regression trees. Journal of Animal Ecology, 77, 802–813. https://doi. org/10.1111/j.1365-2656.2008.01390.x
Evans, J. C., Dall, S. R. X., Bolton, M., Owen, E., & Votier, S. C. (2015). Social foraging European shags: GPS tracking reveals birds from neighbour-ing colonies have shared foragneighbour-ing grounds. Journal of Ornithology, 157, 23–32. https://doi.org/10.1007/s10336-015-1241-2
Fauchald, P., & Tveraa, T. (2003). Using first- passage time in the analysis of area- restricted search and habitat selection. Ecology, 84, 282–288. https://doi.org/10.1890/0012-9658(2003)084[0282:UFPTIT]2.0.CO;2
Fielding, A. H., & Bell, J. F. (1997). A review of methods for the assess-ment of prediction errors in conservation presence/absence models.
Environmental Conservation, 24, 38–49. https://doi.org/10.1017/
S0376892997000088
Garriga, J., Palmer, J. R., Oltra, A., & Bartumeus, F. (2016). Expectation-Maximization Binary Clustering for Behavioural Annotation. PLoS ONE,
11, e0151984.
Garriga, J., Palmer, J. R., Oltra, A., & Bartumeus, F. (2016). Expectation- maximization binary clustering for behavioural annotation. PLoS ONE,
11, e0151984. https://doi.org/10.1371/journal.pone.0151984 Garthe, S., Benvenuti, S., & Montevecchi, W. A. (2000). Pursuit plunging by
northern gannets (Sula bassana)” feeding on capelin (Mallotus villosus)”.
Proceedings of the Royal Society of London B: Biological Sciences, 267,
1717–1722. https://doi.org/10.1098/rspb.2000.1200
Grémillet, D., Dell’Omo, G., Ryan, P. G., Peters, G., Ropert-Coudert, Y., & Weeks, S. J. (2004). Offshore diplomacy, or how seabirds mitigate intra- specific competition: A case study based on GPS tracking of Cape gan-nets from neighbouring colonies. Marine Ecology- Progress Series, 268, 265–279. https://doi.org/10.3354/meps268265
Grüss, A., Kaplan, D. M., Guénette, S., Roberts, C. M., & Botsford, L. W. (2011). Consequences of adult and juvenile movement for marine protected areas. Biological Conservation, 144, 692–702. https://doi. org/10.1016/j.biocon.2010.12.015
Guilford, T., Meade, J., Freeman, R., Biro, D., Evans, T., Bonadonna, F., … Perrins, C. (2008). GPS tracking of the foraging movements of Manx Shearwaters Puffinus puffinus breeding on Skomer Island, Wales.
Ibis, 150, 462–473. https://doi.org/10.1111/j.1474-919X.2008. 00805.x
Gurarie, E., Bracis, C., Delgado, M., Meckley, T. D., Kojola, I., & Wagner, C. M. (2016). What is the animal doing? Tools for exploring behavioural structure in animal movements. Journal of Animal Ecology, 85, 69–84. https://doi.org/10.1111/1365-2656.12379
Hamer, K., Humphreys, E., Magalhaes, M., Garthe, S., Hennicke, J., Peters, G., … Wanless, S. (2009). Fine- scale foraging behaviour of a medium- ranging marine predator. Journal of Animal Ecology, 78, 880–889. https://doi.org/10.1111/jae.2009.78.issue-4
Hamer, K., Phillips, R., Wanless, S., Harris, M., & Wood, A. (2000). Foraging ranges, diets and feeding locations of gannets Morus bassanus in the North Sea: Evidence from satellite telemetry. Marine Ecology Progress
Series, 200, 257–264. https://doi.org/10.3354/meps200257
Hammerschlag, N., Gallagher, A., & Lazarre, D. (2011). A review of shark satellite tagging studies. Journal of Experimental Marine Biology and
Ecology, 398, 1–8. https://doi.org/10.1016/j.jembe.2010.12.012
Hansen, B. D., Lascelles, B. D. X., Keene, B. W., Adams, A. K., & Thomson, A. E. (2007). Evaluation of an accelerometer for at- home monitoring of spontaneous activity in dogs. American Journal of Veterinary Research,
68, 468–475. https://doi.org/10.2460/ajvr.68.5.468
Hays, G. C., Ferreira, L. C., Sequeira, A. M., Meekan, M. G., Duarte, C. M., Bailey, H., … Costa, D. P. (2016). Key questions in marine megafauna movement ecology. Trends in Ecology & Evolution, 31, 463–475. https:// doi.org/10.1016/j.tree.2016.02.015
Hochachka, W. M., Caruana, R., Fink, D., Munson, A., Riedewald, M., Sorokina, D., & Kelling, S. (2007). Data- mining discovery of pattern and process in ecological systems. The Journal of Wildlife Management, 71, 2427–2437. https://doi.org/10.2193/2006-503
Huig, N., Buijs, R.-J., & Kleyheeg, E. (2016). Summer in the city: Behaviour of large gulls visiting an urban area during the breeding season. Bird Study,
63, 214–222. https://doi.org/10.1080/00063657.2016.1159179 Hurford, A. (2009). GPS measurement error gives rise to spurious 180°
turning angles and strong directional biases in animal movement data. PLoS ONE, 4, e5632. https://doi.org/10.1371/journal.pone.000 5632
novel application of network analyses. Methods in Ecology and Evolution,
3, 574–583. https://doi.org/10.1111/j.2041-210X.2012.00187.x Jain, A. K. (2010). Data clustering: 50 Years beyond K- means. Pattern
Recognition Letters, 31, 651–666. https://doi.org/10.1016/j.
patrec.2009.09.011
Jerde, C. L., & Visscher, D. R. (2005). GPS measurement error influences on movement model parameterization. Ecological Applications, 15, 806– 810. https://doi.org/10.1890/04-0895
Jonsen, I. D., Myers, R. A., & James, M. C. (2006). Robust hierarchical state– space models reveal diel variation in travel rates of migrating leath-erback turtles. Journal of Animal Ecology, 75, 1046–1057. https://doi. org/10.1111/j.1365-2656.2006.01129.x
Kerk, M., Onorato, D. P., Criffield, M. A., Bolker, B. M., Augustine, B. C., McKinley, S. A., & Oli, M. K. (2015). Hidden semi- Markov models reveal multiphasic movement of the endangered Florida panther. Journal of Animal Ecology, 84, 576–585. https://doi. org/10.1111/1365-2656.12290
Ketchen, D. J. Jr, & Shook, C. L. (1996). The application of cluster anal-ysis in strategic management research: An analanal-ysis and critique.
Strategic Management Journal, 17, 441–458. https://doi.org/10.1002/
(SICI)1097-0266(199606)17:6<441::AID-SMJ819>3.0.CO;2-G King, D. T., Glahn, J. F., & Andrews, K. J. (1995). Daily activity budgets and
movements of winter roosting Double- crested Cormorants determined by biotelemetry in the delta region of Mississippi. Colonial Waterbirds,
18, 152–157. https://doi.org/10.2307/1521535
Knell, A. S., & Codling, E. A. (2012). Classifying area- restricted search (ARS) using a partial sum approach. Theoretical Ecology, 5, 325–339. https:// doi.org/10.1007/s12080-011-0130-4
Kuhn, M. (2008). Caret package. Journal of Statistical Software, 28, 1–26. Landis, J. R., & Koch, G. G. (1977). The measurement of observer
agree-ment for categorical data. Biometrics, 33, 159–174. https://doi. org/10.2307/2529310
Langrock, R., King, R., Matthiopoulos, J., Thomas, L., Fortin, D., & Morales, J. M. (2012). Flexible and practical modeling of animal telemetry data: Hidden Markov models and extensions. Ecology, 93, 2336–2342. https://doi.org/10.1890/11-2241.1
Lascelles, B. G., Taylor, P., Miller, M., Dias, M., Oppel, S., Torres, L., … Shaffer, S. A. (2016). Applying global criteria to tracking data to define import-ant areas for marine conservation. Diversity and Distributions, 22, 422– 431. https://doi.org/10.1111/ddi.2016.22.issue-4
Le Corre, M., Dussault, C., & Côté, S. D. (2014). Detecting changes in the annual movements of terrestrial migratory species: Using the first- passage time to document the spring migration of caribou. Movement
Ecology, 2, 1–11. https://doi.org/10.1186/s40462-014-0019-0
Louzao, M., Wiegand, T., Bartumeus, F., & Weimerskirch, H. (2014). Coupling instantaneous energy- budget models and behavioural mode analysis to estimate optimal foraging strategy: An example with wandering albatrosses. Movement Ecology, 2 (1)8. https://doi. org/10.1186/2051-3933-2-8
MacArthur, R. H., & Pianka, E. R. (1966). On optimal use of a patchy environment. The American Naturalist, 100, 603–609. https://doi. org/10.1086/282454
MacQueen, J. (1967). Some methods for classification and analysis of mul-tivariate observations. In L. M. Le Cam & J. Neyman (Eds.), Proceedings of the fifth Berkeley symposium on mathematical statistics and probability
(pp. 281–297). Oakland, CA: University of California Press.
McCarthy, A. L., Heppell, S., Royer, F., Freitas, C., & Dellinger, T. (2010). Identification of likely foraging habitat of pelagic loggerhead sea tur-tles (Caretta caretta) in the North Atlantic through analysis of teleme-try track sinuosity. Progress in Oceanography, 86, 224–231. https://doi. org/10.1016/j.pocean.2010.04.009
Mendez, L., Borsa, P., Cruz, S., De Grissac, S., Hennicke, J., Lallemand, J., … Weimerskirch, H. (2017). Geographical variation in the foraging be-haviour of the pantropical red- footed booby. Marine Ecology Progress
Series, 568, 217–230. https://doi.org/10.3354/meps12052
Michelot, T., Langrock, R., & Patterson, T. A. (2016). moveHMM: An R pack-age for the statistical modelling of animal movement data using hid-den Markov models. Methods in Ecology and Evolution, 7, 1308–1315. https://doi.org/10.1111/2041-210X.12578
Moll, R. J., Millspaugh, J. J., Beringer, J., Sartwell, J., & He, Z. (2007). A new ‘view’of ecology and conservation through animal- borne video systems.
Trends in Ecology & Evolution, 22, 660–668. https://doi.org/10.1016/j.
tree.2007.09.007
Montevecchi, W., Benvenuti, S., Garthe, S., Davoren, G., & Fifield, D. (2009). Flexible foraging tactics by a large opportunistic seabird preying on forage- and large pelagic fishes. Marine Ecology Progress Series, 385, 295–306. https://doi.org/10.3354/meps08006
Nathan, R., Getz, W. M., Revilla, E., Holyoak, M., Kadmon, R., Saltz, D., & Smouse, P. E. (2008). A movement ecology paradigm for unifying or-ganismal movement research. Proceedings of the National Academy of
Sciences of the United States of America, 105, 19052–19059. https://doi.
org/10.1073/pnas.0800375105
Nelson, B. (2002). The Atlantic gannet. Amsterdam: Fenix Books.
Nordstrom, C. A., Battaile, B. C., Cotte, C., & Trites, A. W. (2013). Foraging habitats of lactating northern fur seals are structured by thermocline depths and submesoscale fronts in the eastern Bering Sea. Deep Sea
Research Part II: Topical Studies in Oceanography, 88, 78–96. https://doi.
org/10.1016/j.dsr2.2012.07.010
Palmer, C., & Woinarski, J. (1999). Seasonal roosts and foraging movements of the black flying fox (Pteropus alecto) in the Northern Territory: Resource tracking in a landscape mosaic. Wildlife Research, 26, 823– 838. https://doi.org/10.1071/WR97106
Patrick, S. C., Bearhop, S., Grémillet, D., Lescroël, A., Grecian, W. J., Bodey, T. W., … Votier, S. C. (2014). Individual differences in searching behaviour and spatial foraging consistency in a central place marine predator.
Oikos, 123, 33–40. https://doi.org/10.1111/more.2014.123.issue-1
Patterson, T. A., Thomas, L., Wilcox, C., Ovaskainen, O., & Matthiopoulos, J. (2008). State–space models of individual animal movement.
Trends in Ecology & Evolution, 23, 87–94. https://doi.org/10.1016/j.
tree.2007.10.009
Phillips, R. A., Xavier, J. C., & Croxall, J. P. (2003). Effects of satellite trans-mitters on albatrosses and petrels. Auk, 120, 1082–1090. https://doi.or g/10.1642/0004-8038(2003)120[1082:EOSTOA]2.0.CO;2
Pyke, G. H. (1984). Optimal foraging theory: A critical review. Annual Review
of Ecology and Systematics, 15, 523–575.
https://doi.org/10.1146/an-nurev.es.15.110184.002515
Roberts, G. O., & Rosenthal, J. S. (2004). General state space Markov chains and MCMC algorithms. Probability Surveys, 1, 20–71. https://doi. org/10.1214/154957804100000024
Samal, A., & Lyengar, P. A. (1992). Automatic recognition and analysis of human faces and facial expressions: A survey. Pattern Recognition, 25, 65–77. https://doi.org/10.1016/0031-3203(92)90007-6
Sato, K., Watanuki, Y., Takahashi, A., Miller, P. J., Tanaka, H., Kawabe, R., … Watanabe, Y. (2007). Stroke frequency, but not swimming speed, is related to body size in free- ranging seabirds, pinnipeds and cetaceans.
Proceedings of the Royal Society of London B: Biological Sciences, 274,
471–477. https://doi.org/10.1098/rspb.2006.0005
Schultz, J. C. (1983). Habitat selection and foraging tactics of caterpil-lars in heterogeneous trees. In R. F. Denno, & M. S. McClure (Eds.),
Variable plants and herbivores in natural and managed systems (pp.
61–90). Cambridge, MA: Academic Press. https://doi.org/10.1016/ B978-0-12-209160-5.50009-X
Shepard, E. L., Ross, A. N., & Portugal, S. J. (2016). Moving in a moving me-dium: New perspectives on flight. Philosophical Transactions of the Royal
Society B: Biological Sciences, 371, 20150382. https://doi.org/10.1098/
rstb.2015.0382
Silverman, B. W. (1986). Density estimation for statistics and data analysis. Boca Raton, FL: CRC Press. https://doi.org/10.1007/978-1-4899-3324-9 Sommerfeld, J., Kato, A., Ropert-Coudert, Y., Garthe, S., & Hindell, M. A.
(2013). Foraging parameters influencing the detection and inter-pretation of area- restricted search behaviour in marine predators: A case study with the masked booby. PLoS ONE, 8, e63742. https://doi. org/10.1371/journal.pone.0063742
Tinker, M., Costa, D., Estes, J., & Wieringa, N. (2007). Individual dietary spe-cialization and dive behaviour in the California sea otter: Using archival time–depth data to detect alternative foraging strategies. Deep Sea
Research Part II: Topical Studies in Oceanography, 54, 330–342. https://
doi.org/10.1016/j.dsr2.2006.11.012
Towner, A. V., Leos-Barajas, V., Langrock, R., Schick, R. S., Smale, M. J., Kaschke, T., … Papastamatiou, Y. P. (2016). Sex- specific and individual preferences for hunting strategies in white sharks. Functional Ecology,
30, 1397–1407. https://doi.org/10.1111/1365-2435.12613 van Beest, F. M., & Milner, J. M. (2013). Behavioural responses to
ther-mal conditions affect seasonal mass change in a heat- sensitive north-ern ungulate. PLoS ONE, 8, e65972. https://doi.org/10.1371/journal. pone.0065972
Vandenabeele, S. P., Shepard, E. L., Grogan, A., & Wilson, R. P. (2012). When three per cent may not be three per cent; device- equipped seabirds ex-perience variable flight constraints. Marine Biology, 159, 1–14. https:// doi.org/10.1007/s00227-011-1784-6
Wakefield, E. D., Bodey, T. W., Bearhop, S., Blackburn, J., Colhoun, K., Davies, R., … Hamer, K. C. (2013). Space partitioning without terri-toriality in gannets. Science, 341, 68–70. https://doi.org/10.1126/ science.1236077
Warwick-Evans, V., Atkinson, P., Gauvain, R., Robinson, L., Arnould, J., & Green, J. (2015). Time- in- area represents foraging activity in a wide- ranging pelagic forager. Marine Ecology Progress Series, 527, 233–246. https://doi.org/10.3354/meps11262
Weimerskirch, H. (2007). Are seabirds foraging for unpredictable re-sources? Deep Sea Research Part II: Topical Studies in Oceanography, 54, 211–223. https://doi.org/10.1016/j.dsr2.2006.11.013
Weimerskirch, H., Gault, A., & Cherel, Y. (2005). Prey distribution and patchiness: Factors in foraging success and efficiency of wandering al-batrosses. Ecology, 86, 2611–2622. https://doi.org/10.1890/04-1866
Weimerskirch, H., Le Corre, M., Marsac, F., Barbraud, C., Tostain, O., & Chastel, O. (2006). Postbreeding movements of frigatebirds tracked with satellite telemetry. The Condor, 108, 220–225. https://doi. org/10.1650/0010-5422(2006)108[0220:PMOFTW]2.0.CO;2 Weimerskirch, H., Pinaud, D., Pawlowski, F., & Bost, C. A. (2007). Does prey
capture induce area- restricted search? A fine- scale study using GPS in a marine predator, the wandering albatross. The American Naturalist,
170, 734–743. https://doi.org/10.1086/522059
Williams, T. M., Wolfe, L., Davis, T., Kendall, T., Richter, B., Wang, Y., … Wilmers, C. C. (2014). Instantaneous energetics of puma kills reveal advantage of felid sneak attacks. Science, 346, 81–85. https://doi. org/10.1126/science.1254885
Zach, R., & Falls, J. B. (1979). Foraging and territoriality of male ovenbirds (Aves: Parulidae) in a heterogeneous habitat. The Journal of Animal
Ecology, 48, 33–52. https://doi.org/10.2307/4098
Zhang, J., O’Reilly, K. M., Perry, G. L., Taylor, G. A., & Dennis, T. E. (2015). Extending the functionality of behavioural change- point analysis with k- means clustering: A case study with the little Penguin (Eudyptula
minor). PLoS ONE, 10, e0122811. https://doi.org/10.1371/journal.
pone.0122811
Zucchini, W., MacDonald, I. L., & Langrock, R. (2016). Hidden Markov models
for time series: An introduction using R. Boca Raton, FL: CRC Press.
SUPPORTING INFORMATION
Additional Supporting Information may be found online in the supporting information tab for this article.
How to cite this article: Bennison A, Bearhop S, Bodey TW, et al. Search and foraging behaviors from movement data: A comparison of methods. Ecol Evol. 2018;8:13–24.