Int. J. Electrochem. Sci., 7 (2012) 2710 - 2763
International Journal of
ELECTROCHEMICAL
SCIENCE
www.electrochemsci.org
Redox Switching and Oxygen Evolution at Hydrous
Oxyhydroxide Modified Nickel Electrodes in Aqueous Alkaline
Solution: Effect of Hydrous Oxide Thickness and Base
Concentration
Michael E.G. Lyons*, Lisa Russell, Maria O’Brien, Richard L. Doyle, Ian Godwin, Michael P Brandon Trinity Electrochemical Energy Conversion and Electrocatalysis (TEECE) Group, Physical and
Materials Electrochemistry Laboratory, School of Chemistry, University of Dublin, Trinity College, Dublin 2, Ireland.
*
E-mail: [email protected]
Received: 8 December 2011 / Accepted: 28 February 2012 / Published: 1 April 2012
Keywords: oxygen evolution electrocatalysis, oxidized nickel electrodes, hydrous oxide modified electrodes, oxygen evolution mechanisms
1. INTRODUCTION
The oxygen evolution reaction (OER) is the anodic reaction that accompanies, in aqueous electrolytes, commerically important cathodic processes such as metal electrowinning and hydrogen production via alkaline water electrolysis. For the latter process, the anodic overpotential is the major factor in limting operational efficiency [1]. The optimal oxygen evolution anode materials are RuO2 and IrO2, since these oxides exhibit the lowest overpotentials for the reaction at practical current densities. The high cost of these materials and their poor long term stability in alkaline solution, renders their widespread commercial utilisation both u neconomical and impractical [2]. Nickel and its alloys have therefore become the anodes of choice for water electrolysis [1,2]. Although the OER overpotential is higher than for RuO2 or IrO2, nickel based electrodes are relatively inexpensive and display excellent corrosion resistance in aqueous alkaline media, and thus offer an attractive compromise solution. That said, the OER electrocatalytic performance of metallic Ni (actually passive oxide covered Ni) in alkaline solution diminishes markedly with time [3].
In view of the latter considerations, there has been, over the past thirty years, extensive research focussed on the development of OER electrocatalysts that display a combination of the desired characteristics of long term physical and chemical stability, satisfactorily low reaction overpotential and viable cost. Amongst the most promising materials that have been forwarded as OER anodes are, various inter-metallic alloys (often containing significant amounts of Ni, Co or Fe), electrodeposited Ni (NiOx) and Co (Co3O4) oxides, and mixed oxides, including spinels(particularly nickelites, cobaltites and ferrites) and perovskites. While the relatively high activity of nickel hydroxide electrodes for the OER is welcome in alkaline electrolyser applications, it is a drawback where this material is utilised as the positive electrode in secondary alkaline batteries (e.g. Ni-Cd, Ni-MH and Ni-MH2) since it facilitates “self discharge” and consequently leads to a decrease of charge storage capacity [4,5]. Thus i n contrast to electrolyser anode research, work in the battery area has been directed towards increasing the OER overpotential at nickel hydroxide electrodes. This has been achieved by the addition of cobalt hydroxide to the nickel hydroxide [6], however, depending on the amount of incorporated Co, this procedure can actually improve OER catalytic activity [7]. These oxides have been prepared from inorganic precursor materials using a wide variety of approaches, including thermal decomposition, spray pyrolysis, sol-gel routes and freeze drying, precipitation or electrodeposition from solution.
Despite all this intense activity the mechanism of the OER at first row transition metal oxide surfaces remains controversial. The experimental confirmation that a co mmon OER mechanism pertains for these materials would be a significant aid in the eventual development of a general predictive theory of OER electrocatalysis for such materials.
evolution at oxidized nickel electrodes in alkaline solution using a combination of steady state polarization techniques and reaction order studies. We propose a mechanism for the latter which specifically takes the nature of the electrochemically generated hydrous oxide film that is present on the surface of the Ni electrode during active oxygen evolution into account. This work follows on from our recently published studies on the interfacial redox chemistry, redox switching mechanism and OER electrocatalytic activity of oxidized transition metal electrodes [8-10] and iron electrodes modified with microdispersed hydrous oxy hydroxide films [11 -16].
2. EXPERIMENTAL
All experiments were conducted in a conventional three electrode cell. The working electrode was constructed from 1mm thick polycrystalline nickel foil (as supplied by Alfa Aesar -Johnson Matthey, purity 99.9945% (metals basis)) with a geometric surface area of 0.16 cm2. Prior to each experiment the surface of the working electrode was polished with 1200 grit carbimet paper, dipped in H2SO4, wiped, and polished with a slurry of 0.3 micron alumina powder until a “mirror bright” finish was achieved. A platinum wire electrode (CH Instruments, cat no. CHI 115) was employed as the counter electrode and a mercury-mercuric oxide (Hg/HgO) reference electrode (CH Instruments, cat no. CHI 152) was utilised as the reference standard, therefore all voltages are quoted against this reference electrode1. When used in NaOH solutions of different concentrations, the potential of the Hg/HgO electrode was checked relative to a second Hg/HgO, 1 M NaOH electode, both before and after the experiment. No significant potential drift was noted after such experiments, implying that the concentration of the NaOH in the reference electrode chamber remains effectively constant over the time scale of typical polarisation measurements. In any case, the 1M NaOH solution in the reference electrode, was changed regularly to ensure experimental consistency.
Aqueous NaOH solutions (in the range between 0.1 and 5.0 M) served as both the electro-polymerisation medium and the supporting electrolyte for the redox switching and electrocatalytic studies. This solution was prepared from sodium hydroxide pellets (Sigma-Aldrich, minimum 99% purity) using Millipore water (resistivity > 15 MΩ cm). Before commencing each experiment, nitrogen gas was bubbled through the electrolyte solution for 20 min.
The electrochemical measurements were performed using a number of high performance digital potentiostats including a BAS 100B Electrochemical Analyser and a CH Model 760 D Bi-potentiostat system.
Both workstations were controlled by high end desktop Personal Computers (Dell). The uncompensated solution resistance was determined using a method developed by He and Faulkner [17]. Typically the uncompensated solution resistance (90% compensation level) varies from ca. 0.30
1
The equilibrium potential of the cell Pt/H2/OH
Ω for [OH-] = 5.0 M to ca. 4.3 Ω for [OH
-] = 0.1 M. This parameter was specifically considered in the Tafel plot measurements, where the data is presented in iR compensated form. Unless otherwise specified, all values of current density are normalised with respect to the geometric surface area.
Charge storage capacity (redox capacity), Q, were determined via integration of the peaks recorded in the voltammetric profiles at slow sweep rates. The redox capacity is directly proportional to the layer thickness.
The polymeric Ni oxy-hydroxide films were prepared via multi-cycling the Ni electrode between the switching potentials of -1.450 V and 0.65 V at a scan rate of 0.15 V s-1. Films of different thicknesses were prepared by varying the number of growth cycles. The charge storage capacity or redox capacity (Q) was determined, following the growth of each film, by integration of the peaks in a voltammetric profile recorded at a slow sweep rate (40 mV s-1). The redox capacity is directly proportional to the layer thickness. Tafel plots were recorded for each film using linear sweep voltammetry performed at a sweep rate of 1 mV s-1.
3. RESULTS AND DISCUSSION
3.1 Hydrous Oxide growth via repetitive potential sweep multicycling (RPSM)
As commented by Gottesfeld and Srinivasan; “ the “science” of the OER is a “science” of the oxides and their properties” [18]. We agree that this statement is particularly pertinent for Ni electrochemistry in base. One of the most versatile and convenient techniques used to generate hydrous oxides in a form suitable for the real time determination of their redox switching and electrocatalytic behavior is that of potential cycling . In this method the potential of an electrode of the parent metal (which may be noble or non-noble) is cycled repetitively between suitable lower and upper limits in an aqueous solution of appropriate pH. The type of potential perturbation used for oxide growth – sinusoidal, square or triangular wave- apparently makes little difference . Indeed the triangular wave is most convenient as changes in the current vs potential response (the voltammogram) can be employed during the oxide growth reaction to monitor changes in redox behavior associated with the latter [22], although Arvia and co-workers [23] contend that a repetitive square wave potential pulse is also very effective for the controlled generation of hydrated metal oxy-hydroxide films on metallic supports, especially if one wishes to form relatively thick oxide films. Typical voltammetric profiles recorded for an initially bright, and multicycled Ni electrodes in 1.0 M NaOH are presented in figures 1 – 3. The sweep rate utilized was 50 mV/s.
Figure 1. Typical cyclic voltammetric response recorded for an uncycled Ni electrode in 1.0 M NaOH. Sweep rate, 50 mV/s. Inset shows the peak set labeled A1 and C1 recorded at low potentials prior to the onset of active hydrogen evolution at ca. – 1.08 V (vs Hg/HgO).
Figure 3. Typical cyclic voltammetric response recorded for multi-cycled (N = 300 cycles) Ni electrode in 1.0 M NaOH. Sweep rate, 50 mV/s. Inset shows the peak set labeled A1 and C1 recorded at low potentials prior to the onset of active hydrogen evolution at ca. – 1.08 V (vs Hg/HgO).
It is almost universally agreed that the lower anodic peak observed in the potential region between -0.6 V and – 0.8 V is principally associated with the oxidation of metallic Ni(0) to Ni(II) species. There has been historically some disagreement about the nature of the Ni(II) oxide species formed at this potential with, for example, Makrides[28] proposing the production of NiO and Ni(OH)2, while Okuyama [29] suggested that the oxide film in this potential region was non -stoichiometric, consisting of NiO and Ni3O4. By analogy with the situation found at low potentials for Fe in base [15,16] we can visualize the following sequence of reactions at low potentials:
Ni + OH- → NiOH(ads.) + e- (1)
NiOH(ads.) + OH- → Ni(OH)2 + e- (2)
NiOH(ads.) + OH- → NiO(ads) + H2O + e- (3)
The overall interfacial reaction resulting in Fe(II) film formation may be more complex than that outlined above due to a variety of other possible reactions. For instance hydroxylation reactions such as:
NiO + H2O → Ni(OH)2 (4)
layer. Place exchange processes [30] can result in an increase in the thickness of the surface layer. The latter type of growth process has been proposed to involve a rapid place exchange step followed by a rate determining Temkin discharge of OH- ions onto sites in which a surface iron atom is already attached to a hydroxyl group displaced into the first layer beneath t he surface, viz:
NiOH(ads) → HONi (fast) (5)
HONi + OH- → HONiOH(ads) (slow rds) (6)
HONiOH(ads) → Ni(OH)2 → NiO + H2O (7)
One should note that with a non noble metal such as Nickel or iron, the aforementioned surface processes are likely to be accompanied by film thickening (i.e. place exchange reactions [30]), even at quite low potentials.
More recently the complex nature of the film even at these low potentials has been emphasised. Based on the variation of the voltammetric peak potential with changes in pH in alkaline solution (typically the redox potential for the anodic reaction decreases by ca. 13 mV per unit change in pH with respect to a pH independent reference electrode), Burke and Twomey [24] proposed that both oxidation and hydrolysis processes were operative in this region, leading to the formation of a species with anionic character which was tentatively assigned, for purposes of rationalization, the formula Ni(OH)2.40.4 -. The reaction sequence proposed by the latter workers was:
Ni + 2 OH- → Ni(OH)2 + 2 e- (8)
Ni(OH)2 → [NiO0.4(OH)1.6]0.4- + 0.4 H+ (9)
Note that eqn.9 may be represented as a hydroxide ion adsorption step since the reaction occurs in alkaline solution:
Ni(OH)2 + 0.4 OH- → Ni(OH)2.40.4- (10)
Hence in very simple terms the net anodic reaction corresponding to peak A1 can be represented as:
Ni + 2.4 OH- → [Ni(OH)2.4]0.4 – (11)
the region – 0.6 to -1.0 V (vs Hg/HgO) irregardless of whether the nickel electrode has been subjected to a potential multicycling perturbation or not. The cathodic peak C1 is observed provided the upper limit of the potential sweep is reversed at a potential (ca. – 0.2 V) far from the onset of the development of the main charge storage peaks (the latter occur at E > 0.2 V). We agree with the conclusion proposed by Burke and Twomey [24] that the reversal in sweep direction at low potentials causes the initially produced hydrous oxide species to transform to a more anhydrous form, such as to NiO say. Hence the C1 reduction peak could be due to:
NiO + H2O + 2e- → Ni + 2 OH- (12)
In essence the Burke-Twomey [24] proposal is that due to post electrochemical place exchange reactions, the anionic oxide becomes neutral before being reduced back to Ni metal. They also suggest that that the lower oxidation peak appears to be superimposed on a background current that is probably due to a combination of adsorbed hydrogen oxidation and formation of a layer of adsorbed hydroxyl species as outlined in eqn.1. In an ellipsometric study de Souza et al.[26 ] found that the first layer of oxide formed at potentials close to the lower anodic peak A1 consists of NiO. However this becomes covered with a thick film of Ni(OH)2 upon further increase of potential. A further significant observation of Burke and Twomey [24] was that the magnitud e and position of the lower anodic peak did not alter much with repetitive potential cycling. Our data presented in fig. 1 – fig. 3 support this observation. We therefore support the Burke-Twomey [24] contention that it is the inner, compact oxide layer that is reduced at significant cathodic potentials, and thus, even on cycling, the A1 peak is associated with oxidation of Ni metal to Ni(II) at the metal/porous hydrous oxide interface.
Two distinct sets of anodic (A2, A2*) and cathodic (C2, C2*) peaks may be observed at more elevated anodic potentials greater than ca. 0.20 V at a Ni electrode that has not been subjected to a multicycling procedure (fig.1). Peak A2* disappears on potential multicycling and peak A2 increases considerably in magnitude with increasing number of potential cycles as noted in fig. 2 for N = 30 cycles, and in fig.3 for N = 300 cycles. The cathodic peak doublet C2 and C2* remain even after considerable multicycling corresponding to the formation of a thick hydrous oxide deposit on the nickel surface. Hence raising the upper limit of the voltammetric sweep from – 0.20V to E > 0.7 V ensures the occurrance of further restructuring of the surface layer involving more complete protonation and further uptake of oxygen resulting not only in increased film thickness but also generation of Ni(III) or even Ni(IV) sites in the oxide film. This results in the generation of a more stable oxide coating so that the lower cathodic peak C1 at – 0.95 V is no longer observed (fig. 2 and fig. 3). The lower limit of the potential sweep has to be extended well into the active hydrogen evolution region before significant reduction of the hydrous oxide occurs. Indeed we have found that the optimum lower limit for efficient hydrous oxide formation is ca. – 1.45 V.
product in the formation of a hydrous oxide layer. In the anhydrous film ions are held in a rigid manner in an extended network of polar covalent bonds which drastically reduce ion transport through (and consequently extension of) the surface layer. The next stage of the film thickening process, the hydration reaction, is generally very slow, because as in phase transformation reactions, it involves rupture of primary coordination metal-oxygen bonds. It has been shown that the extent of hydrous oxide growth depends strongly on the value chosen for the upper and lower limit of the potential sweep as well as on the cycling frequency adopted, the solution temperature and the solution pH.
The marked dependence of oxide growth rate on the lower limit of the potential sweep (found for a wide number of noble and non-noble transition metals) is indicative of the essential role that partial reduction of the anhydrous oxide plays in the production of a thick deposit. Partial reduction of the compact oxide layer apparently facilitates rearrangement of oxycation species at the metal surface, leaving it in a somewhat disrupted state. It is established that in the case of both platinum [32] and gold [32, 33] the anhydrous film is reduced much more read ily than the hydrated film. The greater stability of the latter is possibly due to a variety of reasons such as lower repulsion between cations owing to greater separation and decreased charge (the latter effect being due to hydroxyl ion coordination by cations present) and polymer formation. Indeed it has been established that in the case of metal-gas interactions [34] the adsorption-desorption process effects displacement of atoms in the outer layer of the metallic phase, and that potential cycling causes roughening of the surface of noble metals such as platinum under certain conditions [35].
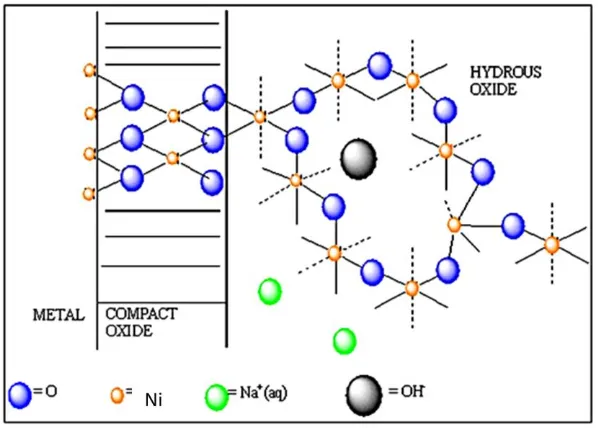
On subsequent re-oxidation of the partially reduced metal surface the compact layer is restored but the outer region of the compact film is present in a more dispersed form. On further reduction the latter material becomes incorporated into the hydrated outer layer. It is not clear whether this rearrangement process involves detachment of oxycations, i.e. a dissolution -reprecipitation mechanism, or a certain weakening, with only a partial detachment of oxycation binding in the compact oxide layer. In the latter case the partially reduced cations are assumed to be displaced from normal lattice sites, and, as such, are more susceptible to oxidation in the subsequent anodic sweep during which they complete their oxygen coordination shell of six oxygen atoms to form a rather open polymeric inorganic bronze or zeolite type structure. Hence under conditions of thick film growth the interfacial region may be represented by : M/MOx/MOa(OH)b(OH2)c/aqueous phase as is outlined in figure 4. This is the duplex layer model of the oxide/solution interphase region. Here MOx represents the inner compact layer and MOa(OH)b(OH2)c denotes the outer hydrous layer. This model was first suggested by Burke and O’Sullivan [36].
Figure 4. Burke-O’Sullivan [36] duplex layer model of oxide/solution interface.
Figure 5. Growth of hydrous nickel oxide thin film on Ni support electrode monitored via analysis of the evolution of the real time voltammogram in 1.0 M NaOH. Sweep rate 350 mV/s.
The upper peaks observed in the potential region 0.3 to 0.6 V are greatly enhanced when the Ni support electrode is subjected to a repetitive potential sweep. These are labeled the main charge storage or redox switching peaks. However only peak A2 and the cathodic doublet peaks C2 and C2* may be observed when the electrode surface is coated with a thick hydrous oxide layer.
[image:10.596.158.440.342.543.2]
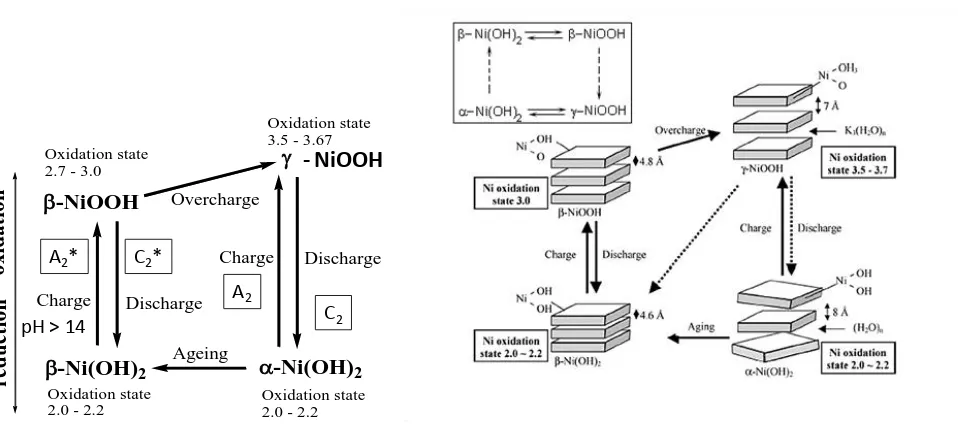
Figure 6. Schematic representation of Bode Scheme of squares.
The discharged or reduced Ni(OH)2 material can exist either as a largely anhydrous phase designated as – Ni(OH)2 (denoted -Ni(II)) or as a hydrated phase denoted as -Ni(OH)2 (in short represented as -Ni(II)). Oxidation of the -Ni(II) material is envisaged to produce a phase referred to as -NiOOH or -Ni(III). In contrast oxidation of the -Ni(II) material produces -Ni(III) or -NiOOH. Hence one expects two distinct redox transitions : (II)/(III) and (II)/(III). The corresponding redox peaks are designated A2*/C2* and A2/C2 respectively. Burke and Twomey designated the latter peak sets as AA/CA and AH/CH respectively. We note from fig.6 that upon ageing, especially in more concentrated alkali solution, the -Ni(OH)2 can dehydrate and re-crystallize as -Ni(OH)2 . Furthermore, upon overcharge (which occurs at more elevated potentials) -NiOOH can convert to -NiOOH. The non-stoichiometric nature of both the discharged and charged material is indicated by the average oxidation state of Ni in each phase as indicated in the structural representation of the various phases in the rhs schematic presented in fig.6. It is important to note that while there is a general acceptance for the general features of the Bode scheme, one must understand that it is inappropriate to think about the for mation of a compound or a phase with definite stoichiometry during the chemically complex Ni(OH)2/NiOOH transformation. Instead the four phases mentioned in the Bode scheme should be considered as the limiting forms of the divalent and trivalent materials – the actual composition of the oxide at a given potential depending on a range of factors including its history, method of preparation, degree of hydration, defect concentration etc.
In simple terms peaks A2*/C*2, can be attributed to the following Ni(II)/Ni(III) redox transformation:
Ni(OH)2 + OH- → NiOOH + H2O + e- (13)
-Ni(OH)2
-Ni(OH)2
-NiOOH
Oxidation state 2.0 - 2.2 Oxidation state
2.0 - 2.2 Oxidation state 2.7 - 3.0
Oxidation state 3.5 - 3.67
o
x
id
a
ti
o
n
re
d
u
ct
io
n
Ageing Charge
Charge
Discharge
Discharge Overcharge
A2
C2
A2* C2*
pH > 14
According to Burke and Lyons [38] the potential for an ideal oxide electrode system in aqueous solution at 25ºC, decreases with increasing pH by ca. 59 mV/pH unit, with respect to a pH independent reference electrode such as the NHE or the saturated calomel electrode (SCE). Such a shift in potential with pH, is referred to as a Nernstian shift, since it is predicted by the Nernst equation. It should be noted that if the reference electrode is pH dependent, such as the reversible hydrogen electrode (RHE) or the Hg/HgO electrode, no potential pH shift will be observed, since the potential of this type of electrode also alters by ca. 59 mV per unit change in pH at 25ºC. Furthermore, Burke and Lyons [38] have discussed super-Nernstian shifts that have been observed for various hydrous oxide systems – in these cases the potential/pH shift differs from the expected 0.059V/pH unit at 250C. The mathematical treatment of this situation is beyond the scope of the present review, but suffice to say, the phenomena have been qualitatively summarized [24,38,39]. Thus, a zero potential shift (with respect to a pH dependent reference electrode) implies that both the reactants and the product possess the same net charge. A positive potential shift with pH, is indicative of an oxidised state that is more positive than the reduced state, whereas the converse is true in the case of an observed negative potential/pH shift.
However, it was previously shown [24] that the anhydrous A2*/C*2 peaks exhibit a regular Nernstian shift whereas the hydrous counterparts A2/C2 exhibit the characteristic of a hydrous or hyper-extended oxide [38], i.e. a super-nernstian potential-pH shift, which typically has the value of dE/dpH = -2.303(3RT/2F) = -0.088V/pH unit at T = 298 K. Accordingly, by analogy with a scheme produced by Burke and Whelan [40] for redox switching of iridium oxide films, it has been proposed that the main redox switching reaction may be written as:
[Ni2(OH)6(OH2)3]n2- + 3nOH- → [Ni2O3(OH)3(OH2)3]n3- +3nH2O + 2ne- (14) corresponding to an Ni(II)/Ni(III) redox transition in a polymeric microdispersed hydrous oxide layer. This redox switching reaction is illustrated schematically in scheme A below.
Scheme A
5.0 M. Typical results are presented for moderate cycling (N = 30 cycles) in fig.7 and fo r more extended multicycling (N = 120) in fig. 8. Attention is focused on the Ni(II)/Ni(III) redox transition involving the peaks A2, C1* and C2.
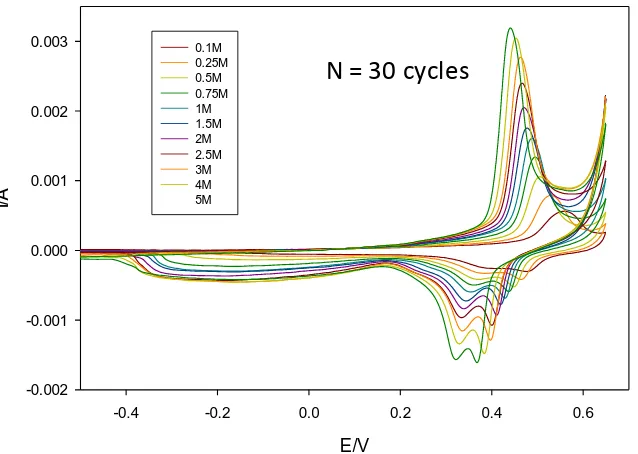
Figure 7. Voltammetric behaviour of a multicycled (in 1.0 M NaOH for N = 30 cycles) oxide coated Ni electrode as a function of base concentration.
Figure 8. Voltammetric behaviour of a multicycled (in 1.0 M NaOH for N = 30 cycles) oxide coated Ni electrode as a function of base concentration.
E/V
-0.4 -0.2 0.0 0.2 0.4 0.6
I/A
-0.002 -0.001 0.000 0.001 0.002
0.003 0.1M
0.25M 0.5M 0.75M 1M 1.5M 2M 2.5M 3M 4M 5M
[image:13.596.132.451.164.391.2] [image:13.596.130.469.453.713.2]
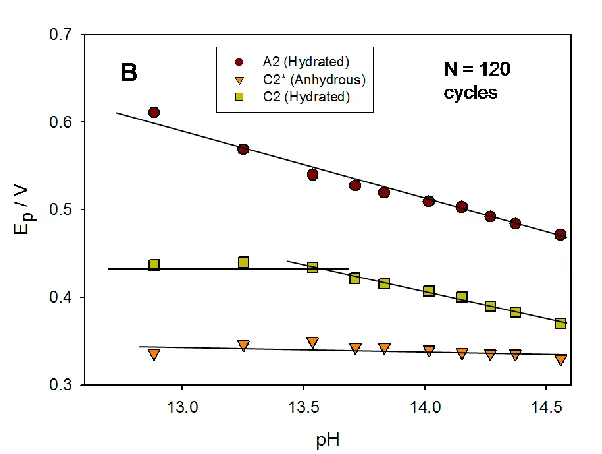
We may note a number of features of interest. First the peak potentials vary with number of potential cycles or in effect with oxide charge capacity. For instance, at a given hydroxide ion concentration, the A2 peak potential shifts to a more anodic value as the oxide film becomes thicker. Secondly, for all layer thicknesses examined the A2 peak potential shifted to less anodic values and the C2 potential to more cathodic values with increase in base concentration whereas the C2* peak potential shifted only slightly with increasing value of the latter. These trends are illustrated quantitatively in fig.9 for an oxidized Ni electrode subjected to 30 cycles and in fig.10 to 120 potential cycles. We indicate the variation of voltammetric peak potential both with [OH-] and with solution pH, the latter being calculated using the following expression: pH log
KW mOH
, where denotesthe mean ionic activity coefficient for NaOH solutions taken from Robinson and Stokes [41], and OH
m is the molality of the hydroxide ion. We have taken KW = 1.0 x 10⁻¹⁴. Note also that no attempt
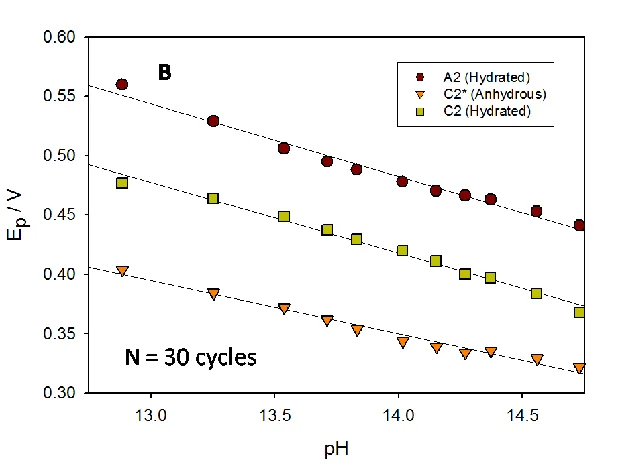
Figure 9. Voltammetric behaviour of a multicycled (in 1.0 M NaOH for N = 30 cycles) oxide coated Ni electrode as a function of base concentration. (A) Variation of peak potential with [OH-]. (B) Variation of peak potential with calculated solution pH.
[image:15.596.146.455.66.299.2]
Figure 10. Voltammetric behaviour of a multicycled (in 1.0 M NaOH for N = 120 cycles) oxide coated Ni electrode as a function of base concentration. (A) Variation of peak potential with [OH-]. (B) Variation of peak potential with calculated solution pH.
The values obtained for the variation of peak potential with decade change in calculated solution pH are interesting. For instance for peak A2 : dEp/dpH = - 0.061 V dec-1 for an oxide film grown for N = 30 cycles, whereas dEp/dpH = - 0.079 V dec-1 for a thicker oxide film (N = 120 cycles). These numerical values are quoted with respect to the Hg/HgO reference electrode, which in our experiments is set up to be pH independent akin to the SHE. The behaviour observed for the C2* peak is different. The peak potential decreases with increase in solution pH as dEP dpH 0.045V for an electrode modified with a relatively thin oxide layer (30 cycles). In contrast, the C2* peak potential does not vary with solution pH when the electrode has been modified with a thick oxide layer. The latter zero shift in peak potential is quoted with respect to the Hg/HgO reference electrode scale. The behaviour of the C2 peak is complicated. For electrodes modified with a thin oxide film (N = 30 cycles) the potential of the C2 peak decreases by ca. 0.060 V per decade change in pH (measured wrt to the Hg/HgO scale). In contrast, for electrodes modified with a thick hydrous oxide layer (corresponding to N = 120 cycles), we note that the potential does not shift with pH when data is taken in dilute base solution, but shifts in a manner similar to that observed for the A2 peak in more concentrated base solution, where we note dEP dpH 0.061V. It must be admitted that the pH range is narrow, but the shifts in voltammetric peak potential are very obvious as noted from the voltammograms presented in fig.7 and fig.8.
3.2 Analysis of redox switching within the hydrous oxide layer 3.2.1. Potential Step Chronoamperometry
[image:16.596.148.449.67.294.2]
charge percolation through the hyrated layer. The redox switching reaction (associated with the A2/C2 voltammetric peaks) reflects the change in oxidation state of the film as a result of a potential perturbation. Redox centres immediately adjacent to the support electrode are directly affected by the electrode potential, whereas charge is further propagated along the oxy-iron polymer strands in the hydrous layer via a sequence of electron self exchange reactions between neighbouring oxy-metal sites. This process is envisaged to be analogous to redox conduction exhibited by electroactive polymer films. In the simplest terms this electron “hopping” may be modelled in terms of a diffusional process, and so the charge percolation rate may be quantified in terms of a charge transport diffusion coefficient, DCT. In the case of hydrous iron oxide, the latter may reflect either the electron hopping rate or the diffusion of of OH- (or equivalently H3O+) ions via a rapid Grotthus type mechanism. The charge transport diffusion coefficient may be quantitatively estimated using cyclic voltammetry and potential step chronoamperometry.
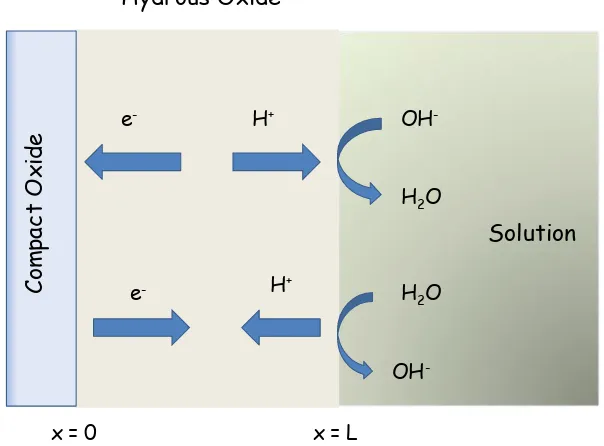
As previously noted the charge/discharge reaction involving a Ni(II)/Ni(III) redox transition within the hydrous oxide is simplistically viewed as a Ni(OH)2/NiOOH transition of the type outlined in eqn.14. MacArthur [43], Zimmerman and Effa [44] Weidner and co-workers[45] and Mao et al [46] have suggested that the charge/discharge process is controlled by the diffusion of protons. We suggest that the latter occurs within the hydrated layer. Hence during discharge a proton diffuses from the film/electrolyte interface into the hydrous oxide region and an electron enters across the conducting compact oxide/hydrous film interface. During charging the proton diffuses to the film/electrolyte interface to react there with hydroxyl ions to form water. This idea is presented schematically in figure 11 below.
Figure 11. Schematic representation of charge/discharge redox switching mechanism occuring within the microdispersed hydrous nickel oxide layer. The thickness of the hydrous layer is L. The redox switching mechanism involves proton diffusion within the film coupled with chemical reaction at the outer interface.
e- OH
-H2O
H+
H2O
OH
-H+
e
-x = 0 x = L
Hydrous Oxide
Com
pa
ct
O
xi
de
[image:17.596.147.449.467.690.2]
We initially examine the response of the Ni(OH)2/NiOOH system to a step in potential and compute theoretical expressions both for the chronoamperometric and chronocoulometric responses as a function of time. We focus attention of the diffusion of protons through the hydrous layer and their reaction at the outer film/solution interface. This process is of course accompanied by the Ni(II)/Ni(III) redox transformation which is described , to a first approximation as an electron hopping process between adjacent Ni sites in the hydrous film. Hence we apply a potential step of amplitude E and monitor either the current response or the charge response as a function of time. The diffusion of protons in the hydrous layer is described by the Fick diffusion equation given by: 2 2 c c D t x
(15)
The following initial and boundary conditions apply
0 0
0 0
x
x L
t c c
dc x
dx
dc i
x L f D kc
dx nFA (16)
Note this boundary value problem is different to that defining the electron hopping mechanism involving the Ni sites in the layer. In the latter problem kinetics at the x = L boundary are not considered and we have:
0 0 ( , 0)
0 (0, ) 0
0
x
x L
t c x c
dc i
x c t f D
dx nFA dc x L dx (17)
We now introduce the following normalized variables:
2
c x Dt kL
u
c L L D
(18)
diffusive rate in the layer. Note also that D is the diffusion coefficient of protons in film, k defines a pseudo first order rate constant and c is the total proton concentration in the layer. Translating the
boundary value problem defined by eqn.15 and eqn.16 into normalized variables produces:
2 2 0 0 1 10 , 0 1
0 0 1 u u u du u d Li du u nFADc d (19)
The problem is most readily solved using the method of Laplace Transformation. Hence the Fick diffusion equation takes the following form in Laplace space:
2
2 1 d u pu
d
(20)
Where we have noted that u
, 0
1. We may readily show that: 1cosh sinh
sinh cosh
u A p B p
p du
p A p pB p
d (21)
Now when 0 u0 0and soB0. Furthermore when 1 u1 u1. Also
1 sinh
u p A p. Furthermore we note that: u1 p1Acosh p u1, and simplifying the latter expression and solving for A we get:
1 1
cosh sinh
A p p p p
. Hence the
expression for the reaction flux in Laplace space is given by:
1
1 sinh sinh cosh sinh p p du
p A p
d p p p p
(22)
1
1
tanh
1 tanh
p du
d p p p
(23)
We can examine various limiting forms of the general result expressed in eqn.23. We first examine the situation where the reaction/diffusion parameter is large which corresponds to the case of fast kinetics and one may consider ion transport in the hydrous layer to be slow and rate determining. This is a very common situation and especially so for proton transport hydrous oxide layers where the reaction between H+ and H2O is expected to be finetically facile. Under these circumstances 10 and eqn.23 reduces to:
1/2
1
tanh du
p p
d
(24)
Taking the inverse Laplace Transform of eqn.24 produces the following expressions for the chronoamperometric response:
2 2 0 1 2 1 1 11 exp exp
1
1 2 1 exp
m m m m m du m d m
(25)These expressions define the so called finite Cottrell equation for diffusion is a finite region.
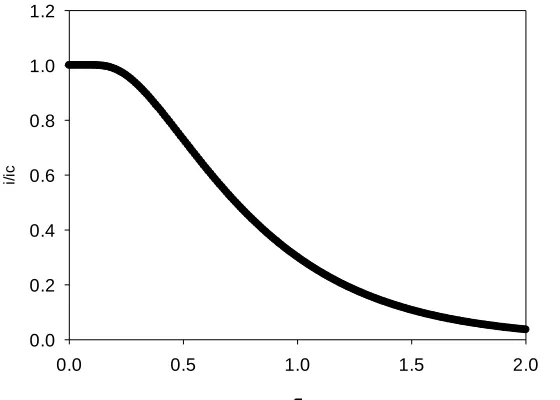
Figure 12. Variation of normalised current response (defined in terms of the ratio of the current response at any time to that corresponding to the Cottrell equation at that same time) with normalised time Dt L2 .
0.0 0.5 1.0 1.5 2.0
[image:20.596.157.437.500.700.2]
We can show that eqn.25 may be written as:
1/2
2 21
1 2 1 mexp
m
D Q m L
i t
t L Dt
(26)In the latter expression the charge passed during the transient is Q nFAL c nFA. The corresponding expression for the current when diffusion is semi -infinite is given by the Cottrell equation:
1/ 2
2
1 ( )
C
D
i t Q
L t
(27)
Hence from eqn.26 and eqn.27 we get:
2 2
2
2 1
1 2 1 mexp 0
m c
i m L
Dt L
i Dt
(28)The latter expression has the form of a Theta function [47]. We illustrate eqn.28 in figure 12. Note that for short times 1and the diffusion in the layer is semi-infinite in nature. Here at short times when tD L2 1, the concentration polarization within the film does not reach the outside of the film and the simple Cottrell equation is valid.
Figure 13. (a) Variation of normalised current response (defined in terms of the ratio of the current response at any time to that corresponding to the Cottrell equation at that same time) with the inverse square root of normalised time Dt L2. (b) Typical normalised Cottrell plot showing deviation from simple semi-infinite diffusion behaviour brought about by finite diffusion effects at longer times.
0.0 0.5 1.0 1.5 2.0 2.5 3.0
i/ic
0.0 0.2 0.4 0.6 0.8 1.0 1.2
1/ 1/2
0 2 4 6 8 10 12
i(
At longer times when 2
1
tD L the concentration polarization in the hydrous layer reaches the outer surface and the diffusion limited current falls below that given by the Cottrell expression outlined in eqn.27. This may be noted from the working curves presented in figs. 12 and 13. The deviation from simple Cottrell behavior can be ascribed to the operation of the exponential terms in the infinite series presented in eqn.26.
We note that the chronoamperometric current transient is usually analysed by plotting i(t) vs t-1/2 and fitting the experimental curve to the theoretical working curve illustrated above in fig.13(b). This fitting procedure can produce a value of the diffusive time constant 2
D L . Note that a value for the diffusion coefficient D can be estimated provided that the parameters Q and L may be estimated.
Secondly, we examine the situation when transport within the hydrous layer is fast and the interfacial kinetics are slow. This corresponds to the case where the reaction/diffusion parameter
is small. We return to eqn.23 and examine the limit of small p and large p corresponding to long and short experimental timescales respectively and derive approximate analytical expressions for the pertinent chronoamperometric current responses. Now when p1we assume tanh p p and the normalised current in Laplace Space is given by:
(29)
Taking the inverse Laplace transformation we obtain:
1 exp
u
(30)
Hence a prediction of simple first order kinetics is proposed for the current decay during an applied potential step at long times, when transport within the hydrous film is rapid and interfacial kinetics at the film/solution interface is slow and rate determining. The situation pertaining in the short time regime is more complex. When p1 we set tanh p 1in eqn.23 to obtain:
1 u
p p
(31)
Again taking the inverse Laplace Transform of eqn.31 we obtain:
2
1 exp ,
u erfc F
(32)
We note that F
, 0as . In contrast when , . The properties of 11
p u
p p
p
0
the function F
, exp 2 erfc have been discussed by Spanier and Oldham [48]. We note that the function exp 2 increases rapidly in magnitude as the product 2 increases, whereas the function erfc suffers a dramatic decrease. The competition between these two opposing effects causes the product function F
, to diminish in a very leisurely fashion towards zero as . Spanier and Oldham [48] note that an accurate approximation for the function F x
valid for all values of the product 2x is :
2 1
exp
1 2
2
1 1 1
exp 5 7
F x x erfc x
x
x x
(33)
They note that the latter approximation exploits the following inequality valid for x 0:
2 2
2 4
1 1 1 1
xF x
x x
(34)
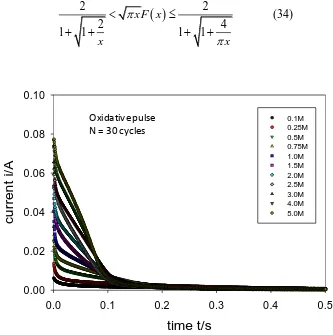
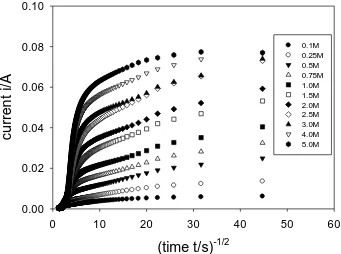
Figure 14. Typical current transients recorded as a function of hydroxide ion concentration for a multicycled Ni electrode (N = 30 cycles) after application of an oxidative potential step from 0.3 0.55 V (vs Hg/HgO).
time t/s
0.0 0.1 0.2 0.3 0.4 0.5
cu
rre
n
t
i/
A
0.00 0.02 0.04 0.06 0.08 0.10
0.1M 0.25M 0.5M 0.75M 1.0M 1.5M 2.0M 2.5M 3.0M 4.0M 5.0M
[image:23.596.123.456.371.706.2]
Typical chronoamperometric response profiles to a double potential step perturbation to a multicycled Ni electrode (N = 30 cycles) in 1.0 M base are outlined in figure 14 and figure 15 below. below.
Figure 15. Typical current transients recorded as a function of hydroxide ion concentration for a multicycled Ni electrode (N = 30 cycles) after application of a reductive potential step from 0.55 0.30 V (vs Hg/HgO).
Figure 16. Cottrell analysis of oxidative PSCA data presented in fig.14.
time t/s
0.0 0.1 0.2 0.3 0.4 0.5 0.6
cu
rre
n
t
i/
A
0.00 0.02 0.04 0.06 0.08
0.1 M 0.25 M 0.5 M 0.75 M 1.0 M 1.5 M 2.0 M 2.5 M 3.0 M 4.0 M 5.0 M
Reductive Pulse N = 30 cycles
(time t/s)
-1/20 10 20 30 40 50 60
cu
rr
e
n
t
i/
A
0.00 0.02 0.04 0.06 0.08 0.10
[image:24.596.119.460.474.728.2]
Figure 17. Cottrell analysis of reductive PSCA data presented in fig.15.
It is clear that the shape of the current transients are complex both for the oxidative and reductive potential steps. Simple current decay curves are only observed for potential steps performed only in the most dilute solutions. The response profiles deviate from simple decay when the experiment is performed in more concentrated base solution. The oxidative and reductive profile shapes also differ from one another.
The chronoamperometric transients presented in fig.14 and fig.15 are re-plotteed in Cottrell format in fig. 16 and fig. 17. The latter experiments clearly indicate that simple Cottrellian finite diffusion behaviour coupled with interfacial kinetics at the film/solution interfa ce as discussed previously may not provide a complete representation of the situation, even if the hydrous oxide layer is relatively thin (layer generated after 30 potential cycles). This contention is supported by the results obtained for thicker oxide films as presented in fig. 18-21.
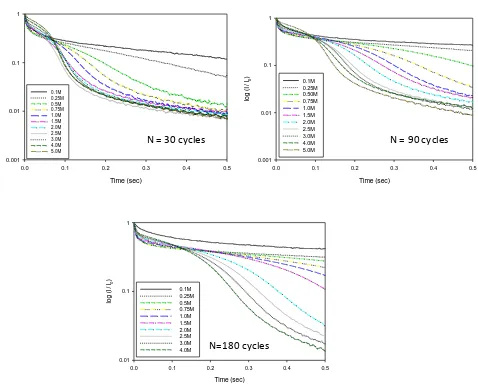
Typical chronoamperometric response profiles to a double potential step perturbation applied across the main charge storage peaks are presented in figure 18 -21 below. The results for an oxidative potential step (0.30 0.55 V, 0.5 s pulse width) are presented in linear (fig.18) and semi-logarithmic (fig. 19) formats and the corresponding responses for the reductive step (0.55 0.30 V, 0.5 s pulse width) are outlined in fig. 20 and fig. 21 in the same formats. This data was collected for a variety of hydrous oxide film thicknesses and over a range of base concentration between 0.1 M – 5.0 M. Data for N = 30, 90 and 180 oxide growth cycles are presented here.
The results from the latter experiments require a detailed and careful analysis which will be presented in a forthcoming paper. For the present we are content to make the following general comments.
First, the transients are not of a simple type. Indeed the overall shape varies with the
(time t/s)-1/2
0 10 20 30 40 50 60
cu
rr
e
n
t
i/
A
0.00 0.02 0.04 0.06 0.08
hydrous oxide layer thickness (for a fixed base concentration), and when recorded for a fixed number of oxide growth cycles, with the magnitude of the hydroxide ion concentration.
Figure 18. Normalised oxidative potential step chronoamperometry response transients (extracted from the first stage of a double potential step experiment of duration 0.5 s) recorded for hydrous oxide coated Ni electrodes which have been subjected to various numbers of oxide growth potential cycles in 1.0 M NaOH solution. In each case the transient is record ed in NaOH solutions of concentration in range 0.1 – 5.0 M.
Second, we note that a simple decay profile is observed only for transients recorded in the most dilute hydroxide ion solutions, typically between 0.1 – 0.5 M. For more concentrated base the decay curve is seen to conprise of two distinct regions: the first consisting of an initial decay followed by a a second, more pronounced region of more rapid current decay, the rate of which subsequently decreases at longer times.
Third, the reductive transients are less complex than those observed for the oxidative redox switching process. Indeed as oulined in fig. 16 the transients exhibit an initial rather rapid decay
Time (sec)
0.0 0.1 0.2 0.3 0.4 0.5
I / I0 0.0 0.2 0.4 0.6 0.8 1.0 0.1M 0.25M 0.5M 0.75M 1.0M 1.5M 2.0M 2.5M 3.0M 4.0M 5.0M Time (sec)
0.0 0.1 0.2 0.3 0.4 0.5
I / I0 0.0 0.2 0.4 0.6 0.8 1.0 0.1M 0.25M 0.50M 0.75M 1.0M 1.5M 2.0M 2.5M 3.0M 4.0M 5.0M
t / s
0.0 0.1 0.2 0.3 0.4 0.5
i/ i0 0.0 0.2 0.4 0.6 0.8 1.0 1.2 0.1M 0.25M 0.5M 0.75M 1.0M 1.5M 2.0M 2.5M 3.0M 4.0M
N=30 cycles N = 90 cycles
which is essentially complete within the first 0.02 s of the pulse. This feature is then followed by a more gradual monotonically decreasing transient which persists over the remainder of the potential pulse. When the data is examined in semi-logarithmic format , three distinct linear regions may be discerned which are temporally well separated. The fine structure inherent in the transients becomes more obvious when the latter is recorded in more concentrated alkaline solutions.
[image:27.596.63.541.181.573.2]
Figure 19. Normalised oxidative potential step chronoamperometry response transients (extracted from the first stage of a double potential step experiment of duration 0.5 s) recorded for hydrous oxide coated Ni electrodes which have been subjected to various numbers of oxide growth potential cycles in 1.0 M NaOH solution. The transient is recorded in semi -logarithmic format. In each case the transient is recorded in NaOH solutions of concentration in range 0.1 – 5.0 M.
Clearly the redox switching process is somewhat complex. This might perhaps not be totally unexpected since Weidner and co-workers [49] reported from galvanostatic charging and discharging experiments that the active material in nickel oxide electrodes cannot be fully accessed at high currents or for thick films. They proposed that the utilization of the active material is
Time (sec)
0.0 0.1 0.2 0.3 0.4 0.5
lo g ( I / I0 ) 0.001 0.01 0.1 1 0.1M 0.25M 0.5M 0.75M 1.0M 1.5M 2.0M 2.5M 3.0M 4.0M 5.0M
N = 30 cycles
Time (sec)
0.0 0.1 0.2 0.3 0.4 0.5
lo g ( I / I0 ) 0.01 0.1 1 0.1M 0.25M 0.5M 0.75M 1.0M 1.5M 2.0M 2.5M 3.0M
4.0M N=180 cycles
Time (sec)
0.0 0.1 0.2 0.3 0.4 0.5
lo g ( I / I0 ) 0.001 0.01 0.1 1 0.1M 0.25M 0.50M 0.75M 1.0M 1.5M 2.0M 2.5M 3.0M 4.0M 5.0M
controlled by the diffusion rate of protons through the film as outlined in fig. 11. The fraction of material utilized during charge (oxidative redox switching) is greater than that utilized during discharge (reduction). The latter asymmetry could be attributed to a proton diffusion c oefficient that is a function of the state of charge of the active material. This clearly implies that the reaction/diffusion expression presented in eqn.19 must be modified along the lines suggested by Weidner and co-workers [49]. Furthermore, we recall fig.6 and note that structural transformations occur between the nickel oxides within the region of redox switching. It is therefore not unexpected that the chronoamperometric response will exhibit features that are reminescent of nucleation/growth transients seen during electrochemical phase formation processes. We will explore this issue in greater detail in a forthcoming paper.
[image:28.596.68.526.325.678.2]One rather significant comment which we will make at this stage however is that although potential step chronoamperometry is perhaps the most simple of transient electrochemical techniques to employ practically, the current transient response profile is very sensitive to deviations from the simple predicted finite diffusive behaviour.
Figure 20. Normalised reductive potential step chronoamperometry response transients (extracted from the second stage of a double potential step experiment of duration 0.5 s) recorded for hydrous oxide coated Ni electrodes which have been subjected to various numbers of oxide growth potential cycles in 1.0 M NaOH solution. In each case the transient is recorded in NaOH solutions of concentration in range 0.1 – 5.0 M.
Time (sec)
0.5 0.6 0.7 0.8 0.9 1.0
I / I0 0.0 0.2 0.4 0.6 0.8 1.0 0.1M 0.25M 0.5M 0.75M 1.0M 1.5M 2.0M 2.5M 3.0M 4.0M 5.0M
N = 30 cycles
Time (sec)
0.5 0.6 0.7 0.8 0.9 1.0
I / I0 0.0 0.2 0.4 0.6 0.8 1.0 0.1M 0.25M 0.50M 0.75M 1.0M 1.5M 2.0M 2.5M 3.0M 4.0M 5.0M
N = 90 cycles
Time (sec)
0.5 0.6 0.7 0.8 0.9 1.0
I / I0 0.0 0.2 0.4 0.6 0.8 1.0 0.1M 0.25M 0.5M 0.75M 1.0M 1.5M 2.0M 2.5M 3.0M 4.0M
Figure 21. Normalised reductive potential step chronoamperometry response transients (extracted from the second stage of a double potential step experiment of duration 0.5 s) recorded for hydrous oxide coated Ni electrodes which have been subjected to various number s of oxide growth potential cycles in 1.0 M NaOH solution. The transient is recorded in semi -logarithmic format. In each case the transient is recorded in NaOH solutions of concentration in range 0.1 – 5.0 M.
As such it is a very useful simple technique to employ in the study of oxide modified electrodes where redox switching can prove in some cases (such indeed as the present case) to be quite complex.
3.2.2 Potential Sweep Voltammetry
We now examine the redox switching behaviour of the hydrated nickel oxide electrode in aqueous base to a potential sweep perturbation. Although we have noted in the previous section that the redox switching proces may be somewhat more complex, we will attempt to apply a simple first order finite diffusion model to obtain quantitative transport information pertaining to the proton diffusion coefficient through the hydrous layer. In the present work we utilise the
Time (sec)
0.5 0.6 0.7 0.8 0.9 1.0
lo g ( I / I0 ) 0.01 0.1 1 0.1M 0.25M 0.50M 0.75M 1.0M 1.5M 2.0M 2.5M 3.0M 4.0M 5.0M
N = 90 cycles
Time (sec)
0.5 0.6 0.7 0.8 0.9 1.0
lo g ( I / I0 ) 0.001 0.01 0.1 1 0.1M 0.25M 0.5M 0.75M 1.0M 1.5M 2.0M 2.5M 3.0M 4.0M 5.0M
N = 30 cycles
Time (sec)
0.5 0.6 0.7 0.8 0.9 1.0
lo g ( I / I0 ) 0.01 0.1 1 0.1M 0.25M 0.5M 0.75M 1.0M 1.5M 2.0M 2.5M 3.0M 4.0M
mathematical formalism of Aoki and co-workers [50] and extended by others [51], to derive an expression for the inverse diffusive time constant 1 2
D D L
. These workers solved the finite
diffusion problem under conditions of a linear potential sweep. Transport information may be readily extracted from an analysis of the shape of the voltammetric response as a function of sweep rate. We have recently reported the utilization of this analysis to examine the redox switching process for multicycled iron electrodes in aqueous base [52].
[image:30.596.124.477.338.592.2]We will apply the most simple variant of the Aoki model and consider the situation where the charge percolation along the oxide polymer strands between adjacent Ni sites and the accompanying proton diffusion in the pores can be considered to be irreversible. The conditions under which the latter conditions pertain may be discerned by examining the variation of the voltammetricp peak potential with sweep rate. The results of such an experiment is presented in fig. 22 below. Here the cyclic voltammetric response as a function of sweep rate is examined for various hydrated nickel oxide films of varying thickness (the latter scaling with the number of potential cycles employed during the layer growth process).
Figure 22. Variation of voltammetric peak potential with log sweep rate for a series of multicycled Ni electrodes in 1.0 M NaOH at 298 K. Attention is focused on the main anodic and cathodic charge storage peaks corresponding to the Ni(II)/Ni(III) redox transition located at potentials prior to active oxygen evolution.
In short, when the diffusive charge percolation process is reversible the voltammetric peak potentials will remain invariant with changes in sweep rate. In this way we define the time window in which the electrochemical reversibility pertains. We note that the peak potential begins to shift significajntly with increasing sweep rate for values greater than 1 Vs-1. Between 0.3 Vs-1 and
log
-3.5 -3.0 -2.5 -2.0 -1.5 -1.0 -0.5 0.0 0.5
E / Vp
-0.2 0.0 0.2 0.4 0.6 0.8 1.0 1.2
0 cycles 30 cycles 60 cycles 90 cycles 120 cycles 180 cycles 240 cycles 360 cycles
-3.5 -3.0 -2.5 -2.0 -1.5 -1.0 -0.5 0.0 0.5 0.0
1.0Vs-1 an intermediate transition region is observed. Below 0.3 Vs-1 the peak potential remains invariant with sweep rate and the redox switching reaction is regarded to be kinetically reversible.
Figure 23. Variation of voltammetric redox charge capacity Q with analytical sweep rate for a series of Ni oxide hydrous films grown under potential cycling conditions for various number of cycles. Attention is focused on the main anodic charge storage peak corresponding to the Ni(II)/Ni(III) redox transition located at potentials prior to active oxygen evolution.
The variation of hydrous oxide charge capacity Q (which is proportional to the redox charge capacity C defined for electroactive polymer films in the work of Murray et al [53,54], with analytical sweep rate is presented in fig. 23. We note that the recorded charge capacity values for reasonably thin oxide films (less than 60 cycles growth) remain invariant with sweep rate between 2 Vs-1 until ca 10 mVs-1, and then increase slightly as the sweep rate is decreased further. This trend is most marked for thicker films (180 cycles growth and greater). Indeed for a thick nickel oxide layer it may be noted that the charge capacity increases by nearly 50% when the sweep rate in decreases from ca. 1 Vs-1 to ca. 10 mVs-1. A similar result has been recently noted for hydrous iron oxide films in base [52].
These results may be readily rationalised in terms of a simple diffusive model as previously noted [52]. With thinner films there is sufficient time at normal sweep rates for the redox reaction to extend to virtually all regions of the dispersed hydrous layer, i.e. a situation of Nernstian equilibrium pertains through the hydrous film, and the redox charge capacity will be effectively
V s-1
0.0 0.5 1.0 1.5 2.0
Q
(
C
)
0.000 0.005 0.010 0.015 0.020 0.025 0.030
[image:31.596.94.496.142.433.2]
independent of experimental time scale (i.e. sweep rate). However with thicker films there is not enough time (apart from the lowest sweep rates or alternatively longest time scales) for the redox reaction to propagate throughout the entire extent of the dispersed hydrous region. Thus the charge capacity values drop dramatically as the analytical sweep rate is increased.
[image:32.596.94.503.294.590.2]The variation of voltammetric peak width at half peak height for the main anodic charge stroage peak A2 with sweep rate is outlined in fig.24 below. We present data for a range of oxide film thicknesses. We note that in all cases examined the peak width at half peak height increases regularly with increasing sweep rate from an initial value of ca. 30 mV at the lowest values of sweep rate to considerably larger values at higher sweep rates. Furthermore it was noted that at a particular sweep rate the peak width at half peak height increased regularly with number of potential cycles.
Figure 24. Variation of peak width at half peak height with sweep rate for a series of multicycled nickel electrodes in 1.0 M NaOH.
Lyons [55] has noted that the peak width at half peak height Ep2value extracted from the voltammogram recorded for an electrode chemically modified with an electroactive polymer thin film conveys very useful information about the electrochemistry of redox switching in the layer. Similar considerations arise in the present case. Laviron [56] has developed a useful theory to describe redox switching within space distributed electroactive redox polymer films where charge is transferred via nearest neighbour electron hopping both intrastrand and interstrand. The analysis
V s-1
0.0 0.5 1.0 1.5 2.0
p1/2
/ V
0.0 0.1 0.2 0.3 0.4 0.5 0.6
has been further extended by Aoki and co-workers [50]. These models enable the cyclic voltammetric response to be analysed quantitatively as a function of sweep rate. In particular these models enable a prediction to be made concerning the shape of the voltammetric response both for reversible, totally irreversible and indeed quasi-reversible redox switching reactions occuring both in monolayer and multilayer modified electrodes thin films, both in the absence of and in the presence of interactions between the participating redox centers. These models have been wel l described by Lyons [55]. In the latter models, if it is assumed that redox switching is electrochemically reversible then the peak width at half peak height is assumed to be given by:
/2
2 3.53
ln 3 2 2
p
RT RT
E
nF nF
(35)
Keeping in mind the representation of the Ni(II)/Ni(III) redox switching reaction presented in scheme A previously we can assign n= 2 and for T=298 K we predict that Ep/2 45.3mV
which is in excellent agreement with the experimental data recorded in fig.24 in the low sweep rate limit. Now in many situations it is established that voltammetric peaks are either broader or narrower than this ideal value. This observation implies that either repulsive or attractive interactions operate within the thin film. Furthermore such as occurrence signifies that either not all sites in the film have the same standard potential or thermodynamic activity effects must be considered. Occupied redox sites with repulsive interactions tend to avoid one another, whi ch ultimately promotes an alternating site occupancy; this is essentially the same as compound formation. This effect results in a broadening of the voltammetric peak response compared with that expected ideally as outlined in eqn.35 for a reversible reaction. In contrast when the interactions are attractive, occupied sites tend to cluster together, which leads to phase separation and considerable narrowing in the voltammogram compared with the ideal. In electroactive polymer materials the extent of peak broadening or narrowing depends to a great extent on the nature of the solvent and the identity and concentration of the charge compensating counterions.
According to Aoki [50] the peak width is related to an empirical interaction parameter as follows:
/2
2 1
ln 1 p
RT E
nF
(36)
In the latter expression we note that gc g LG RTwhere g denotes the Temkin interaction parameter which is negative if repulsive interactions operate and positive if attractive interactions pertain, and G denotes the Gibbs energy of interaction between the redox sites2. Furthermore, c Ldenotes the site concentration within the hydrous layer, and ,Lrepresents
2
the surface coverage and layer thickness respectively. Furthermore we note that: 2 4 (37)
Under reversible conditions the voltammetric peak corresponding to the redox switching reaction within the hydrous oxide layer is identical in shape to the theoretical reversible monolayer peak for reasonably slow sweep rates3. The fact that the peak width at half peak height indicates that the voltammetric peaks exhibit an increasingly more prominent ‘tailing’ effects as the experimental timescale decreases, in which the peaks exhibit an increasing asymmetry about E-Ep. The latter occurrence may be attributed to the fact that there is not enough time at faster sweep rates at the beginning of the scan for the redox reaction to propagate through the film. This of course is a diffusive effect.
Aoki has shown that the voltammetric response for a thin film in which the redox reaction is reversible takes the following form:
1/2 2 2 0 exp 0, , 1 exp Wyi nFA L nFD RT W y dy nFA L nFD RT F W
Wy
(38)Where we have set:
1/2 2 2 0 exp , 0, 1 exp WyF W W y dy
Wy
(39)In the latter expression we note that:
0
2i
nF nFL
E E
RT RT
(40)
Also we note that Dt L2, and we introduce the Theta function as:
22
1
1
0, 1 2 1 expk
k k y y y
(41)We also note that the parameter W is given by:
3 This is given by the expression sech2