COMMISSION OF THE EUROPEAN COMMUNITIES
Brussels, 22.3.2005
SEC(2005) 419
COMMISSION STAFF WORKING PAPER
PROGRESS TOWARDS THE LISBON OBJECTIVES
IN EDUCATION AND TRAINING
2005 Report
THE REPORT IS WRITTEN WITHIN THE FRAME OF THE OPEN METHOD OF CO-ORDINATION AND THE “DETAILED WORK-PROGRAMME ON THE FOLLOW-UP OF THE OBJECTIVES OF
CONTENTS
Executive Summary
Preface
Part A
INTRODUCTION
1.
Introduction: Summary of progress1.1 Summary of progress in education and training since the Lisbon Summit in 2000 - Early school leavers
- Key competencies
- Completion of upper-secondary education - Mathematics, science and technology graduates - Participation in lifelong learning
- Investment in education and training
1.2 Learning from the best performers
1.3 Best performers in the five benchmark areas
II.
Education and Training 20102.1 Implementation of the Lisbon strategy through the Open Method of Co-ordination
2.2 Indicators and Benchmarks within the Open Method of Co-ordination
2.3 “Education and Training 2010” within the Lisbon strategy
Part B
PERFORMANCE AND PROGRESS
I. Improving the quality of teachers and trainers
1.1 Introduction
1.2 Performance and progress in improving the quality of teachers and Trainers 1.2.1 Number of young people in the population
1.2.2 Age of teachers
1.2.3 Ratio of pupils to teaching staff
1.3 Conclusion
II. Developing skills for the knowledge society
2.1 Introduction
2.2 Performance and progress in the field of skills for the knowledge society 2.2.1 Developing key competencies
2.2.2 Distribution and mean performance of students
2.2.3 Mathematics and science
2.2.4 Literacy and socio-economic background
2.3 Performance and progress in the completion of upper-secondary education 2.3.1 Completion of upper-secondary education by gender
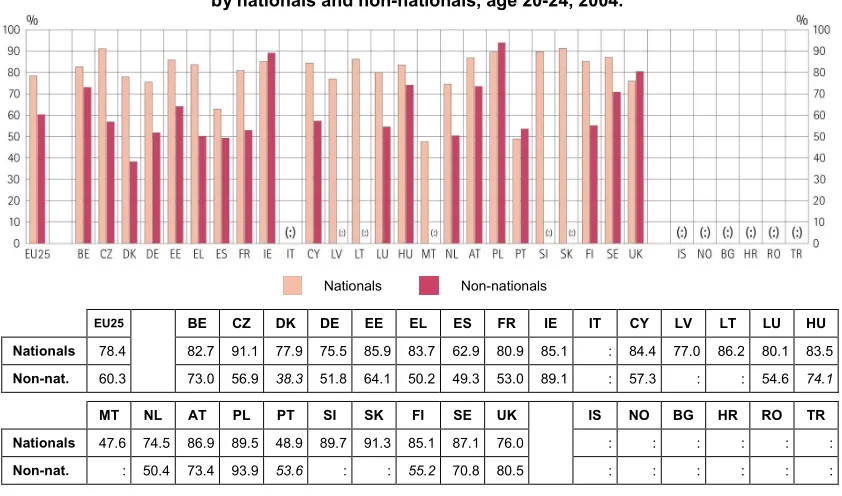
2.3.2 Completion of upper-secondary of non-nationals
2.4 Conclusion
III. Increasing recruitment to scientific and technical studies
3.1 Introduction
3.2 Performance and progress in the field of increasing recruitment to scientific and technical studies
3.2.1 Total number of graduates in Mathematics, Science and Technology
3.2.2 Students enrolled in MST as a proportion of all students in tertiary education
3.2.3 Graduates in MST as a percentage of all graduates in tertiary education
3.2.4 Number of tertiary graduates in MST per 1000 inhabitants aged 20-29
3.2.5 Gender imbalance in graduates
IV. Making best use of resources
4.1 Introduction
4.2 Performance and progress on best use of resources 4.2.1 Public expenditure on education and training
4.2.2 Private expenditure on education and training
4.2.3 Enterprise expenditure on continuing vocational training
4.2.4 Expenditure on educational institutions per pupil/student
4.2.5 Expenditure per pupil/student compared to GDP per capita
4.3 Conclusion
V. Open learning environment, social inclusion, active citizenship
5.1 Introduction
5.2 Performance and progress towards Lifelong Learning 5.2.1 Participation in lifelong learning
5.2.2 Participation of population with low prior education levels
5.2.3 Participation and performance by gender
5.3 Active citizenship
5.4 Conclusion
VI. Making learning more attractive
6.1 Introduction
6.2 Performance and progress in the field of making learning more attractive 6.2.1 Early school leavers
6.2.2 Participation rates of 15-24-year olds in education
6.2.3 Socio-demographic background of students in tertiary education
6.2.4 Vocational training courses organized by enterprises
6.3 Conclusion
VII. Improving foreign language learning
7.1 Introduction
7.2 Performance and progress on improving foreign language skills 7.2.1 Average number of foreign languages learned by pupils
7.2.2 Foreign languages learned per pupil in secondary education
7.3 Conclusion
VIII. Mobility and co-operation
8.1 Introduction
8.2 Performance and progress in promoting mobility 8.2.1 Foreign students in tertiary education
8.2.2 Origin of foreign students
8.2.3 Tertiary students enrolled outside their country of origin
8.2.4 Flow of EU/EEA/Candidate country students
8.2.5 Mobility within the Erasmus programme
8.2.6 Inward and outward mobility of Erasmus students
8.2.7 Mobility of teachers
8.2.8 Mobility within the Leonardo da Vinci programme
8.3. Conclusion
IX. Ensuring access to ICT for everyone
9.1 Introduction
9.2 Performance and progress in ensuring access to ICT for everyone 9.2.1 The ICT infrastructure in schools
9.2.2 Integration of ICT in the school curriculum
BIBLIOGRAPHY
ANNEXES
1. Full title of the 29 indicators for monitoring performance and progress of education and training systems in Europe (technical definitions)
Executive summary
EXECUTIVE SUMMARY
Following the Conclusions of the Heads of State and Governments in Lisbon in 2000 and their endorsement of the common objectives for education and training in Europe in Barcelona, 2002, a radically new process of co-operation was launched in this area, with the overall objective of making education and training systems in Europe a world quality reference by 2010.
This Commission Staff Working Paper “Progress towards the Lisbon Objectives in Education and Training" is the second annual report examining performance and progress of education and training systems in the EU using indicators identified and endorsed by experts from the participating countries.
Monitoring of performance and progress is an essential part of the Lisbon process. Periodic monitoring allows the identification of strengths and weaknesses, thereby providing guidance and strategic direction in implementing the Education &Training 2010 strategy. Consequently, an annual report “Progress towards the Lisbon Objectives in Education and Training" will be prepared.
Of the many observations and conclusions to be found in this report, the following come to the fore:
The high number of early school leavers is an obstacle to securing greater social cohesion in the EU.
In 2004, almost 16% of young people aged 18-24 in the EU left school prematurely and were in danger of being on the fringes of the knowledge society. The Council has agreed to reduce this rate to 10% by 2010. Although some progress has been made, the majority of Member States need to increase their efforts in coming years to help reach the EU target. Best performing EU countries as regards the share of early school leavers are: Poland, the Czech Republic and Slovakia.
An adequate supply of scientists is crucial for a knowledge-based economy
The Council has set two objectives: to bring about an increase of at least 15% in the number of graduates in these fields by 2010 and at the same time to redress the imbalance between women and men. At current trends both objectives will be achieved, the first objective even ahead of schedule. Slovakia, Poland and Spain are the EU countries with the strongest growth in MST graduates. Best performing countries with regard to MST graduates per 1000 population 20-29, are: Ireland, France, and the UK, while Portugal, Estonia, and Latvia have the best gender balance.
Successful participation in the knowledge society requires the basic building blocks offered by an upper secondary-level education.
The Council agreed that, by 2010, at least 85% of 22-year-olds in the European Union should have completed upper-secondary education. However, the completion rate has been fluctuating around 76.5% since 2000. New initiatives and redoubled efforts are needed if the target is to be reached. Best performing EU countries are: Slovakia, the Czech Republic and Slovenia.
Individuals must update and complement their knowledge, competencies and skills throughout life through participation in lifelong learning.
Executive summary
Acquiring basic competencies is a first step to participation in the developing knowledge society.
In the fundamental domain of reading literacy the most recent data suggests that in 2003 about 20% of young people under the age of 15 in EU Member States achieved only the lowest level of proficiency. The average performance did not improve compared to 2000. The EU has still a long way to go to reach the objective set by the Council of reducing this percentage by 20% (to reach 15.5%) by 2010. Best performing EU countries are: Finland, Ireland and the Netherlands.
The EU suffers from under-investment in human resources, especially in higher education.
Public investment in education and training as a percentage of GDP has grown slightly since the adoption of the Lisbon strategy, and is comparable with levels in the USA (and higher than in Japan). Rates of private investment in education and training are, however, modest in almost all Member States compared with the leading countries in the world, especially in higher education.
The EU needs to attract more than one million teachers to the teaching profession.
The high proportion of older teachers in school education in the EU implies that within the period 2005-2015 more than one million teachers in Europe will have to be replaced. High-quality initial teacher training, in conjunction with a process of continuous professional development, is necessary to equip the teaching body with skills and competencies for its role in the knowledge society over the coming decades.
Most EU pupils do not reach the objective of proficiency in at least two foreign languages.
At present (2002), an average of only 1.3 and 1.6 foreign languages per pupil are taught in the Member States in general lower- and upper-secondary education respectively. Major efforts will have to be made by most countries in order to reach the objective of a European average level of at least two foreign languages learned by all.
Almost half of the Member States are among the three best performing countries in at least one of the areas mentioned above. Good practice and expertise are therefore widespread and not confined to a few countries of the Union. Several new Member States are performing at the highest level, especially in relation to attainment levels in school education.
Preface
PREFACE
With this Commission Staff Working Paper, “Progress towards the Lisbon Objectives in Education and Training,” the Commission “takes the temperature” regarding the performance and progress of education and training systems in some 30 countries, with the aid of 29 indicators identified and endorsed by experts from the participating countries.
The Introduction includes an overall summary of the major results of the analysis and provides an account of the context of the Lisbon strategy, the genesis of the system of indicators and benchmarks and their role in the open-method of co-ordination (OMC). It also explores the process of implementing the OMC in the area of education and training.
The main section of the report is divided into ten chapters detailing the 29 indicators and five European benchmarks of average European performance adopted by the Council. In each chapter an analysis is made of the most recent valid and comparable data, with the aim of measuring performance and progress and identifying instances of good policy practice. In areas which are relevant for European benchmarks, the analysis, where possible, draws conclusions on the prospect of reaching the targets set for 2010.
The following section gives a brief overview of the themes of the individual chapters, as well as the distribution of indicators among the chapters, as endorsed by the Commission’s working group of national experts, the Standing Group on Indicators and Benchmarks.1
Chapter I: Improving the Quality of Teachers and Trainers. The ageing of the teaching body is producing a more experienced teaching force, but also implies a challenge in terms of the motivation, retention and retirement of teachers. The retirement of up to 50% of the current teaching force within the next 15 years will necessitate the recruitment and training of at least one million new teachers.
Indicator n°1 Age of teachers
Indicator n°2 Number of young people Indicator n°3 Ratio of pupils to teaching staff
Chapter II: Developing Skills for the Knowledge Society, analyses several key indicators related to indispensable skills and minimum attainment levels for the modern economy. The Council has set ambitious policy targets to improve participation rates and performance levels in education and training.
Indicator n°4 Completion of upper-secondary education Indicator n°5 Low-achieving students in reading literacy Indicator n°6-8 Performance in reading, mathematics and science Indicator n°9 Participation in education or training of initially low-
qualified people
European Benchmarks 2010
- At least 85% of 22-year-olds in the European Union should have completed upper-secondary education.
- The percentage of low-achieving 15-year-olds in reading literacy in the European Union should have decreased by at least 20% compared to the year 2000.
1
Preface
Chapter III: Increasing Recruitment to Scientific and Technical Studies, focuses on the fact that an adequate supply of scientific specialists is essential for the EU in becoming the most dynamic and competitive knowledge-based economy in the world. The Stockholm European Council in 2001 highlighted the need to encourage young people, particularly young women, to become interested in scientific and technological studies.
Indicator n°10 Enrolment in mathematics, science and technology Indicator n°11-13 Graduates in mathematics, science and technology
European Benchmark 2010
- The total number of graduates in mathematics, science and technology in the European Union should increase by at least 15%, while at the same time the level of gender imbalance should decrease.
Chapter IV: Making Best Use of Resources, springs from the Lisbon European Council’s call for a “significant yearly increase in per capita investment in human resources.” Public investment in education and training (as a percentage of GDP) has increased in recent years, but there is increasing awareness of the need for efficient use of resources, including private investment.
Indicator n°14 Public expenditure on education
Indicator n°15 Private expenditure on educational institutions
Indicator n°16 Enterprise expenditure on continuing vocational training Indicator n°17-18 Total expenditure on educational institutions per pupil/student
Chapter V: Open Learning Environment, examines indicators relating to adult participation in lifelong learning. In a rapidly changing environment, individuals will have to update and complement their knowledge and skills continuously for personal and professional development.
Indicator n°19 Participation in lifelong learning
European Benchmark 2010
- The European Union average level of participation in lifelong learning should be at least 12.5% of the adult working age population (25-64 age group).
Chapter VI: Making Learning Attractive, looks at indicators relating to participation in education, based on the recognition that a minimum knowledge base is required in order to participate effectively in the knowledge society.
Indicator n°20-21 Participation in continuing vocational training Indicator n°22 Participation rates in education
Indicator n°23 Early school leavers
European Benchmark 2010
Preface
Chapter VII: Improving Foreign Language Learning, monitors adherence to the Barcelona European Council’s recommendation that all European citizens should be taught at least two foreign languages from an early age.
Indicator n°24 Pupils learning foreign languages Indicator n°25 Number of foreign languages learned
Chapter VIII: Mobility and Cooperation, concentrates on the need to promote the free circulation of students and teaching staff within the EU, both as part of the process of internationalising European education and training systems to improve teaching and learning, and in order to foster international cooperation. Inward mobility is also an indicator of the relative attractiveness of the EU as a destination for academic and research talent.
Indicator n°26 Mobility of teachers and trainers Indicator n°27-29 Mobility of students and trainees
Chapter IX: Ensuring Access to ICT for everyone, follows from the precept that every citizen should be equipped with the skills needed to live and work in the new information society. The educational use of ICT accordingly features prominently in the Commission's e-learning strategy. The indicators utilised focus on the ICT infrastructure in schools and the place of ICT in the school curriculum.
Not all of the thirteen concrete objectives are covered by the indicators listed above. Very important objective areas such as active citizenship, entrepreneurship and European co-operation are not currently covered. In other areas like teachers and trainers, languages and adult education, the indicators used neglect some important aspects. For a proposal of short-, medium- and long-term strategies in these and other areas, see the Staff Working Paper “New Indicators on Education and Training.”2
The report covers performance and progress in the following countries: the 25 Member States of the European Union (EU); the four Candidate Countries (CC - Bulgaria, Romania, Croatia, Turkey); and three countries of the European Economic Area (EEA - Iceland, Liechtenstein, Norway). Where valid data is available, comparisons are made with the performance of Japan and the US.
2
PART A
Introduction
I.
INTRODUCTION
Education has always been a powerful formative influence on society, yet its instrumentality has taken on new dimensions as a result of globalisation and the knowledge revolution. Every serious long-term strategy to increase economic competitiveness, prosperity and social cohesion in the European Union is built on a foundation of education and training.
The European Council in Lisbon in 2000 responded to the changing global formation by devising a comprehensive economic and social policy strategy: to become, by 2010, “the most competitive and dynamic knowledge-based economy in the world, capable of sustainable economic growth, with more and better jobs and greater social cohesion.”3
The onus put on European education and training systems by the institutionalisation of this goal is immense. The very nature of education and training systems has had to be thoroughly reconsidered to accommodate the changing needs and values of society and citizens: these relate to the skills and competencies people need to prosper in the knowledge society, to the quality of education and training systems, to principles of equity and inclusiveness, and to the European dimension of education and civil life. The new social and economic formation also demands increased recognition of knowledge and skills acquired outside the formal education system, and increased support for non-formal and informal training for all age- and social groups.
The Lisbon strategy is more urgent than ever at the end of 2004, as highlighted in the Report from the High Level Group chaired by former prime minister of the Netherlands Wim Kok.4 In its Communication to the Spring European Council, the Commission confirms the need for urgent action in the face of an ageing population and global competition. 5 The Communication calls for a “dynamic economy to fuel our wider social and environmental ambitions, and it underlines that “knowledge and innovation are the beating heart of European growth”.
Education and training help deliver what European citizens desire most – personal fulfilment, jobs, prosperity, greater social cohesion and a cleaner environment. Without first-rate education and training systems, a skilled, flexible workforce, a cohesive, participative society, research into high-value and technologically-advanced products, it will not be possible to achieve the Lisbon goals.
The high ambitions in the field of European education and training were also expressed in the wish of the Barcelona European Council of March 2002, that European education and training systems should become “a world reference for quality by 2010.”
This annual report6 charts progress towards Europe’s targets in the area of education and training using a framework of indicators, benchmarks and statistics, and puts performance, where useful and possible, into a global perspective. The data gives an indication of the direction European education systems are moving in and of Europe’s potential to fulfil the objectives set at Lisbon.
The Council has grouped the strategic objectives of European education and training systems into three broad categories, concerning: firstly, the quality and effectiveness of education systems; secondly, access to education; and thirdly, opening up education systems to the
3
Presidency Conclusions, Lisbon, paragraph 37.
4
Facing the Challenge: The Lisbon strategy for growth and employment. November 2004
5
Communication to the Spring European Council “Working together for growth and jobs – a new start for the Lisbon Strategy” COM (2005) 24 02.02.2005.
6
Introduction
wider world.7 In addition to these overall strategic objectives, the Council has set precise targets or “benchmarks,” in five exemplary areas of education policy, namely early school leavers, completion of upper-secondary education, reading literacy, participation in lifelong learning, and graduates in maths, science and technology (MST). These benchmarks are not concrete targets for individual states, but rather “reference levels of European average performance.”8 They are targets for the Union as a whole, and the collective responsibility of the Member States to reach the targets by 2010 is translated into action at national level on the basis of specific national policy priorities, fully respecting the principle of subsidiarity, as stipulated by the Treaty (Article 149 and 150).9
1.1
Summary of progress in education and training since the Lisbon Summit
in 2000.
The five European benchmarks adopted by the Council in May 2003 still pose a serious challenge for EU education and training systems. In the fields of increasing participation in lifelong learning and decreasing the proportion of low achievers in school education, the EU has made little progress up to 2003, the last year for which data is available. In terms of early school leavers and completion of upper-secondary education, some progress has been registered, but Member States need to increase their efforts substantially if the benchmarks are to be achieved by 2010. However, the benchmark set for the increase in the number of maths, science and technology graduates has already proved more than manageable, and will probably be achieved as early as 2005.
7
Adopted by the European Council, Stockholm, 2001. Work programme approved by the European Council, Barcelona, 2002.
8
Council Conclusions, 5 May 2003
9
Introduction
European Benchmark
By 2010, an EU average ratio of no more than 10% early school leavers should be achieved.
Early school leavers
That three of the five European benchmarks are closely related to issues of access to and participation in education clearly demonstrates the will of the Union to spread prosperity and increase social cohesion. Reducing the numbers of early school leavers is thus one of its foremost priorities. Encouraging young people to participate in post-compulsory education is vital for their social and labour-market integration, since those who leave school without qualifications are in danger of being left behind in today’s increasingly competitive society.
The average rate of early school leaving in the EU is still high but decreasing steadily. There was an improvement in the average EU ratio of almost 1.5% over the period 2000-2003, bringing the latest figure to 15.9% (2004). However, this is still far in excess of the benchmark of a rate of early school leavers of only 10%. It will take considerable political action to achieve the benchmark in this area – the yearly decrease would have to triple to achieve the benchmark.
Early school leavers
Share of the population aged 18-24 with only lower-secondary education and not in education or training
European Union (EU25)
Japan
USA
2000 2003 2004
Source: DG EAC. Data source: Eurostat (Labour Force Survey) * 2003 : change in series
At the current rate of improvement, the ratio of early school leavers will reach approximately 14% by 2010. In 2004, eight EU countries already had ratios of early school leavers below the European benchmark: the Czech Republic (6.1%), Denmark (8.1%), Lithuania (9.5%), Austria (9.2%), Poland (5.7%), Slovakia (7.1%), Finland (8.7%) and Sweden (8.6%). In general, the new Member States perform particularly well in this area, with an average ratio of early school leavers of 7.5% - well below the European benchmark.Introduction
European Benchmark
By 2010, the percentage of low-achieving 15-year-olds in reading literacy in the European Unionshould have decreased by at least 20% compared to the year 2000.
Key competencies
All individuals need a core set of competencies and skills for employment, social inclusion, lifelong learning and personal fulfilment. The European benchmark of a 20% decrease in the percentage of low-achieving 15-year-olds in reading literacy by 2010 implies a decrease from 19.4% in 2000 to 15.5% by 2010.
The latest data from 2003, however, shows a slight increase compared to 2000, so that in 2003, 19.8% of 15-year-old pupils in the EU countries participating in the OECD PISA survey were found to be low achievers in reading literacy. The relative difference between the strongest and weakest pupils varies considerably between countries. Such levels of low-achieving 15-year-olds imply that each year some 1 million young people in the EU (one fifth of a cohort) risk entering working life without the most basic competencies.
Key Competencies
Percentage of pupils with reading literacy proficiency level 1 and lower in the PISA reading literacy scale
European Union *
Japan
USA
2000 2003
Source: DG EAC. Data source: OECD, PISA 2003 database.
Explanatory note
* In 2000, in the 16 EU countries for which comparable date was available both for 2000 and 2003, the percentage of 15 years old in level 1 or below was 19.4. This implies a benchmark of 15.5 (- 20%).
Reaching the target of 15.5% in the proportion of low achievers by 2010 will be a difficult task for the Union, despite the strong performance of countries such as Finland (5.7%), Ireland (11%) and the Netherlands (11.5%). The present ratio of low achievers in the 16 EU countries for which data is available is 19.8% - approximately the same level as is found in the US (19.4%) and Japan (19%). The only countries of the EU to improve their mean performance significantly from 2000-03 were Latvia, Luxembourg and Poland.Introduction
European Benchmark
By 2010, at least 85% of 22-year-olds in the EU should have completed upper-secondary education.
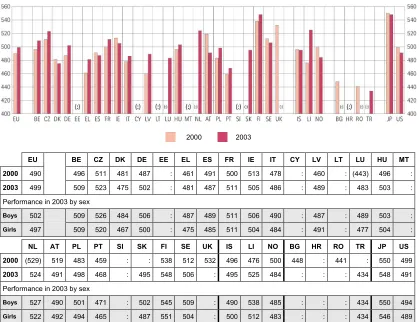
Completion of upper-secondary education
Completing upper-secondary education is increasingly important not just for successful entry into the labour market, but also to allow students access to the learning and training opportunities offered by higher education. It will take considerable efforts to raise the completion rate from its present level of 76.4% to the target of 85%, given that the completion rate has hovered between 76 and 77 % since 2000. The completion rate would have to improve by 1.5 percentage points per year in order to reach 85% by 2010.
Completion of upper-secondary education
Percentage of those aged 20-24 who have successfully completed at least upper-secondary education (ISCED 3)
European Union (EU25)
Japan
USA
2000 2003 2004
Source: DG EAC. Data source: Eurostat (Labour Force Survey).
Youth education attainment levels hardly changed between 2000 and 2004, yet would have to increase by 1.5 percentage points per year in order to reach the benchmark by 2010.
The new Member States have particularly high completion rates, with the Czech Republic and Slovakia at over 90%.
Introduction
European Benchmark
The total number of graduates in maths, science and technology in the EU should increase by at least 15% by 2010, while at the same time the level of gender imbalance should decrease.
Mathematics, science and technology graduates
Europe’s future competitiveness in the global market will depend to a great extent on its supply of scientific specialists. Since 2000, the numbers of graduates in mathematics, science and technology have been increasing rapidly, indicating that the benchmark will more than likely be met by as early as 2005. However, there are still between two and four times as many men as women graduating in the technological disciplines in European countries, although the imbalance is decreasing. The EU also has a higher proportion of graduates in these areas than the USA or Japan. However, it is clearly failing to capitalise on this potential, as it has fewer active researchers in the labour force. Europe needs to develop and increase the attractiveness of its research labour market, in order both to retain its own talent and to attract researchers and scientists from abroad.
Mathematics, science and technology
Total number of tertiary (ISCED 5A, 5B and 6) graduates from mathematics, science and technology fields
European Union (EU25)
Japan
USA
2000 2001 2002
Source: DG EAC. Data source: Eurostat (UOE) Additional note :
Greece: Data not available.
The tendency of some of the best brains to leave Europe is very likely one of the consequences of the relatively lower levels of funding of Research and Development in the EU, with only 1.9% of GDP allocated to R&D in 2003 (in comparison with a target of 3% by 2010 set by the European Council, and a current US equivalent of 2.9%). To develop the labour market for R&D personnel over the next five years will entail not only redoubled efforts to redress the marked gender imbalance, but they will need to be backed up by higher levels of investment education and research if the EU is to achieve its goal of becoming a more attractive location for researchers.
If the trend continues, the EU will probably have reached the benchmark in numbers of MST graduates by 2005. However, it may be difficult to maintain these high levels in the future due to demographic changes in the numbers of young people in the EU.
In 2001, almost 25% of all tertiary graduates were in MST fields, compared to 17% in the US and 22% in Japan.
Introduction
European Benchmark
By 2010, the European Union average level
of participation in Lifelong Learning should be at least 12.5% of the adult working-age population (working-age 25-64)
Participation in lifelong learning
In a knowledge society, individuals must continuously update and complement their knowledge, competencies and skills for personal and professional development. The average level of participation in lifelong learning of the adult working-age population in the EU is 9.4%. This is the proportion of the adult population that has participated in formal or non-formal learning activities within “the last four weeks.” The participation rate is increasing, but not at a sufficient rate to meet the benchmark of “at least 12.5%” by 2010. In addition, the participation gap between those with high and those with low educational attainment levels has widened. At present, those with a high educational attainment level are more than seven times as likely to participate in lifelong learning than those with low levels.
Lifelong learning
Percentage of population aged 25-64 participating in education and training in the four weeks prior to the survey
European Union (EU25)
Japan
USA
2000 2003 2004
Source: DG EAC. Data source: Eurostat (Labour Force Survey) * 2003 : change in series
The yearly increase in lifelong learning participation would have to accelerate from the present 0.1-0.2% to 0.5% in the period 2004-10 to reach the European benchmark of 12.5% by 2010.
The average level of participation in lifelong learning of the three best performing countries, Sweden, Denmark and Finland, is over 24%.
Introduction
Investment in education and training
Between 2000 and 2001 some progress was made in line with the Lisbon ambition of “a substantial annual increase in per capita investment in human resources.” Public expenditure on education as a proportion of GDP has increased across Europe – and the level is generally comparable with that of the US. However, private expenditure on higher education, as a percentage of GDP, is eight times higher in the US and three times higher in Japan, reflecting fundamentally differing approaches to the financing of tertiary education.
1.2 Learning from the best performers
The objective of benchmarking of performance and progress in the field of education and training is not to rank Member States, but rather to identify countries which perform well, so that expertise and good practice can be shared with others. This is why the Council, when adopting the Detailed Work Programme on the follow-up of the objectives of education and training systems in Europe,10 asked for the identification of the three leading countries in the objective areas.
Almost half of Member States are among the three leading countries in at least one of the five areas. Good practice and expertise in the field of education and training are not, therefore, confined to a few countries of the Union. The Scandinavian countries (Sweden, Denmark and Finland, but also Norway, as non-member), though often cited with reference to the quality of their education and training systems, are not the only countries reaching standards of excellence in education – several new Member States (Poland, the Czech Republic, Lithuania, Slovakia and Slovenia) are also performing on that level in certain areas.
10
Detailed Work Programme, 2002, p. 45.
Public expenditure on education and training as a percentage of GDP and in absolute levels has increased since 2000 in the EU. Especially Member States have made visible efforts to raise expenditure, but spending increased also markedly in Greece, Italy, the Netherlands, Portugal, Finland and the UK. Denmark and Sweden have the highest public spending levels (over 7% of GDP),
Introduction
1.3 Best performers in the five benchmark areas
Benchmark area
Concrete Target
2010
Three best performers in the EU EU25
average
USA Japan
2004
Share of early school leavers (18-24) in EU.
No more than
10% Poland
5.7%
Czech Rep. 6.1%
Slovakia
7.1% 15.9% (:) (:) Change in the share of low achievers in %, 2000-2003
Latvia
-40.2%
Poland
-27.6%
Finland
-18.6% +2.1% +8.4% +88.1%
% of low achievers in 2003
Ratio of low-achieving 15-year-olds in reading literacy in EU.
At least 20% decrease (to reach 15.5%) Finland 5.7% Ireland 11.0% Netherlands
11.5% 19.8% 19.4% 19.0% 2004
Upper-secondary completion rate in EU (20-24).
At least 85%
Slovakia
91.3%
Czech Rep. 90.9%
Slovenia
89.7% 76.4% (:) (:)
Average annual increase 2001 and 2002
Slovakia
+22.6%
Poland
+12.7%
Spain
+10.4% +4.6% +2.7% -0.8% Graduates per 1000 population in 2001
Graduates in MST in EU
Increase of at least 15% (=100,000 graduates or 1.6% annual
increase in period 2001-2010) Ireland 21.7 France 20.2 UK
19.5 10.9 9.9 12.8 2004 Adult participation in Lifelong Learning in EU (25-64). At least 12.5% Sweden 35.8% Denmark 27.6% Finland
24.6% 9.4% (:) (:)
Introduction
II. EDUCATION AND TRAINING 2010
When European Heads of State and Government met at the European Council in Lisbon in March 2000, most European countries were experiencing moderate to high economic growth and were generally optimistic that information and communication technologies (ICT) could provide new opportunities and a new way of organising the economy.
However, there were also some worrying signs, in terms of low employment rates, high long-term structural unemployment, an underdeveloped service sector, and widening skills gaps, especially in information technology. Most importantly, in terms of key economic variables, the EU was being outperformed by the US. The US had a faster economic growth rate, as well as higher employment rates and labour productivity. In spite of the completion of the internal market, the successful introduction of the Euro and strengthened co-ordination of employment and economic policies, Europe seemed to be at risk of falling behind in the long-term.
The rapid and accelerating pace of change meant that it was urgent for the Union to act without delay. The European Council at Lisbon drew up a pro-active programme of radical economic and social reforms, respecting the imperatives of both competitiveness and social cohesion, to provide impetus to a number of policy areas, including employment, the information society, research, and education and training.11 The strategy adopted at the European Council Spring Summit set a new goal for the European Union, namely that of becoming:
“the most competitive and dynamic knowledge-based economy in the world, capable of sustainable economic growth, with more and better jobs and greater social cohesion.”12
The Lisbon strategy was a balanced strategy, which on one hand endeavoured to respond to the challenges of globalisation and the new knowledge revolution, and on the other, was consistent with European values and the European social model. Furthermore, the European Council committed itself to a more coherent effort, and a more effective monitoring of progress towards its goals, by agreeing that the Lisbon agenda would henceforth be discussed at every Spring European Council.
The European Council clearly recognised the need to build knowledge-economy infrastructures, to promote innovation and economic reform and to modernise social welfare and education systems.13 The broad scope of the strategy can be appreciated from the examples below of concrete benchmarks formulated at subsequent European Council meetings.
11
See Presidency Conclusions, Lisbon, paragraph 4.
12
Presidency Conclusions, Lisbon, paragraph 5.
13
Introduction
Examples of benchmarks formulated by the first three Spring European Council meetings
Lisbon (2000)
Ensure generalised electronic access to main basic public services by 2003
Ensure that all schools have access to the Internet and multimedia resources by the end of 2001
Implement the Financial Services Action Plan by 2005
A substantial annual increase in the per capita investment in human resources
Halve by 2010 the number of 18-24 years old with only lower-secondary level education
Raise the overall employment rate to 70% by 2010 and to 60% for women.
Stockholm (2001)
By 2010 increasing the average EU employment rate among older workers (55-64 years old) to 50%
Transposition target of 98.5% of internal market directives
Downward trend in state aid by 2003
Barcelona (2002)
Substantial progress in enhancing energy efficiency by 2010
Significantly reduce the number of people at risk of poverty and social exclusion by 2010
Provide childcare by 2010 to at least 90% of children between 3 years old and the mandatory school age and at least 33% of children under 3 years of age.
A progressive increase of about 5 years in the effective average age at which people stop working in the EU before 2010.
Overall spending on R&D and innovation in the Union should be increased with the aim of approaching 3% of GDP by 2010. Two-thirds of this new investment should come from the private sector.
2.1 Implementation of the Lisbon strategy through the Open Method of Co-ordination
The Lisbon European Council also outlined a new method of European co-operation to realize the strategic goal:
“Implementation of the strategic goal will be facilitated by applying a new open method of co-ordination as the means of spreading best practice and achieving greater convergence towards the main EU goals. This method, which is designed to help Member States to progressively develop their own policies, involves:
− fixing guidelines for the Union combined with specific timetables for achieving the goals which they set, in the short, medium and long term;
− establishing, where appropriate, quantitative and qualitative indicators and benchmarks against the best in the world and tailored to the needs of different Member States and sectors as a means of comparing best practice;
− translating these European guidelines into national and regional policies by setting
specific targets and adopting measures, taking into account national and regional differences;
− periodic monitoring, evaluation and peer review, organised as mutual learning processes.”14
14
Introduction
On one hand, this open method of co-ordination (OMC) provides orientation towards common outcomes or objectives in a given policy area; on the other, the OMC is an instrument for identifying good policy practice from among the grand reservoir of diverse policy approaches in the European area. It is a soft-law approach in sensitive policy areas where Member States do not want to cede power to the EU, but agree that mutual learning processes at international level can inspire better legislation at national level. The OMC is also a way of bringing international peer pressure to bear on national reform processes, and of increasing momentum in processes of mutual accountability. This might be particularly important in cases where reforms that are deemed necessary cannot garner enough public support.
The OMC is inspired by economic policy co-ordination. Since 1993, with the entry into force of the Maastricht Treaty, and in preparation of the Economic and Monetary Union, this has taken place through the broad economic policy guidelines.15 Moreover, the European Employment strategy, which was launched by the Luxembourg European Council in 1997 and codified in the Amsterdam Treaty, offers another early example of the OMC.16 In these two areas, however, the open method of co-ordination is enshrined in the Treaty. In the Lisbon strategy the institutional framework is not as clear – the Lisbon and subsequent Spring Summit conclusions provide general policy directions, but there is no clear mechanism for “translating” the European Council conclusions into operational community policies or implementing them at national level.
As noted in the Report from the High Level Group17 chaired by Wim Kok, former president of the Netherlands, the open method of co-ordination, as the central tool for the implementation of the Lisbon strategy, has fallen short of expectations. The Kok Report locates the weakness of the OMC in the failure of Member States to enter fully into the spirit of mutual benchmarking.
In its Communication to the Spring European Council18, the Commission confirms the criticism levelled by the Kok Report, and responds by suggesting a new start for the Lisbon strategy. The renewed Lisbon strategy should focus on growth and jobs, and ensure that “knowledge and innovation are the beating heart of European growth”. Remedial actions include more focussed actions on policies that will have greatest impact, the establishment of a broad and effective ownership of the Lisbon goals in order to mobilise support for change, and a simplified and streamlined strategy which clearly clarifies who does what, simplifies reporting requirement and backs up delivery by National Lisbon Action Programmes.
2.2 Indicators and Benchmarks within the Open Method of Co-ordination
Presidency Conclusions at Lisbon and at subsequent Councils accorded a central role to indicators and benchmarks within the open method of co-ordination (OMC). Indicators have several functions. They reveal disparities in performance levels between and within states and encourage constructive dialogue on the underlying reasons for those disparities. They can thus be used as an instrument to stimulate the exchange of expertise and policy approaches. This function is even more pertinent considering that a number of Member States are already achieving world-best performances in a number of objective areas, whereas others are faced with serious challenges.
In the OMC, indicators are also used as instruments for monitoring progress towards common objectives and benchmarks where these have been adopted. The stated ambition of becoming the most dynamic knowledge-based economy in the world would be hollow if it did not entail the measurement of progress. Therefore a range of guidelines and benchmarks are utilised to break
15
For the 2004 Broad Economic Policy Guidelines, see:
http://europa.eu.int/comm/economy_finance/publications/broadeconomypolicyguidelines_en.htm
16
For 2003 guidelines in the area of employment, see:
http://europa.eu.int/comm/employment_social/employment_strategy/guidelines_en.htm
17
Facing the Challenge: the Lisbon strategy for growth and employment, November 2004, pp.42-43.
18
Introduction
down the overall ambition into manageable goals in different policy areas. The Commission reports to the Spring summits, the so-called Synthesis reports, present an analysis of progress using a framework of structural indicators (including a short-list of 14 headline indicators19 and a longer list20 of 42 indicators in 2004).21
2.3 “Education and Training 2010” within the Lisbon strategy
The Lisbon strategy and the open method of ordination radically changed European policy co-operation in the area of education and training. Until the European Council meeting in Lisbon, the main focus of European co-operation in the area of education and training had been the implementation of the Socrates and Leonardo programmes. The Lisbon strategy provided a platform to discuss education and training policies at European level, and the OMC offered the opportunity to build a coherent policy framework without impinging on national interests.
Recognising the pivotal role of education and training in the knowledge society, the European Council (Lisbon) invited Ministers of Education “to reflect on the concrete future objectives of education systems,” and to concentrate on “common concerns and priorities.” A year later, the European Council in Stockholm endorsed a report on the “concrete future objectives” in the field of education and training.22 It furthermore requested the Council (Education and Youth) and the Commission to present jointly to the Spring European Council in 2002 (Barcelona) a detailed work programme on the implementation of education and training “objectives,” including “an assessment of their achievement in a world-wide perspective.”23 In Barcelona the European Council approved the “Detailed Work Programme on the follow-up of the objectives of education and training systems” for 201024 and set the objective of “making [European] education and training systems a world quality reference by 2010.”25
Following the adoption of the Detailed Work Programme, eight working groups were set up to focus on one or more of the 13 concrete objectives. Comprising experts from 31 European countries, as well as other stakeholders and interested EU and international organisations, their role is to support the national implementation of the common objectives set for education and training systems, through exchange of good practice, study visits, peer learning activities, etc. Moreover, a Standing Group on Indicators and Benchmarks was set up to assess progress towards the objectives, and to identify models of successful policy practice with the aid of indicators.
The Joint Interim Report, “Education and Training 2010: the success of the Lisbon strategy hinges on urgent reforms”, adopted by the Commission and the Council in February 2004, was the first evaluation of progress in terms of the implementation of the Detailed Work Programme. The report identifies three levers as crucial to reaching the goal of making education and training systems in Europe a world-wide quality reference: firstly, focusing reform and investment on the key areas for the knowledge society; secondly, making lifelong learning a concrete reality; and thirdly, establishing a “Europe of Education and Training.” It is a sign of the willingness of
19
This shortlist has been agreed with the Council and allows for a more concise presentation and a better assessment of achievements over time vis à vis the Lisbon agenda. In keeping with the recent streamlining of procedures in the wider context of the Lisbon strategy, it is intended to keep this list stable for three years.
20
Cf. Communication from the European Commission on “Structural Indicators.”
21
In this short-list of indicators, one is of particular relevance in the area of education and training, namely educational attainment of those aged 20-24. In the long list of structural indicators there are five which are relevant for education and training. These cover: Spending on human resources, lifelong learning, science and technology graduates, early school leavers and educational attainment.
22
Report from the Education Council to the European Council, 14 February 2001.
23
Presidency Conclusions, Stockholm, paragraph 11.
24
Detailed Work Programme.
25
Introduction
Member States to discuss education policies at European level that two of these priority areas are clearly national policy domains.
If the Lisbon Strategy changed policy cooperation in the area of education and training, in no area is this more apparent than in terms of the increased focus on the use of indicators and benchmarks in education and training policy at European level.
Firstly, the Education Council has clearly stated its intention to monitor and measure the contribution of education and training to the overall Lisbon strategy through the use of indicators and benchmarks. The Detailed Work Programme, which provides a coherent framework of 13 concrete objectives for supporting and guiding education and training policy-making at national level, was presented jointly by the Commission and the Council26 to the European Council meeting in Barcelona in 2002 with an indicative list of 33 indicators for measuring progress towards the agreed objectives.
Secondly, the Joint Interim Report of February 2004 discusses EU performance, and provides evidence of the accomplishments of individual countries on the basis of indicators. Moreover, the report points to a number of warning signs in areas such as early school leavers, key competencies, investment in human resources, etc.
Thirdly, the Education Council of May 2003 strengthened the role of indicators and benchmarks when, on the basis of a proposal27 from the Commission, it adopted a list of five reference levels of European average performance (“benchmarks”).28 In its conclusions the Council reaffirmed the central role of indicators and benchmarks in setting objectives and measuring progress towards the Lisbon goals.
Lastly, the Joint Interim Report underlined the need to improve the quality and comparability of existing indicators, particularly in the field of lifelong learning. Consequently, it requested the Standing Group on Indicators and Benchmarks and all existing Working Groups to propose, by the end of 2004, a limited list of new indicators for development. In response to these requests, and with the assistance of the Standing Group on Indicators and Benchmarks (SGIB) and of Objective Working Groups composed of experts from all Member States, the Commission established a framework of 29 indicators for measuring progress towards the Common Objectives.
This is the second progress report measuring performance and progress towards the common objectives in education and training.29 Moreover, since the current indicators give a very partial picture of progress, a Staff Working Paper on the development of new indicators, “New Indicators on Education and training,” (composed in response to a request in the Joint Interim Report), suggests strategies for the development of new indicators in nine areas of relevance for the Education & Training 2010 process. In each of the following chapters detailing the 29 indicators, an analysis is given of the indicators currently in use, as well as an indication of those which are foreseen for the future.
26
Presidency Conclusions, Stockholm, paragraph 11.
27
“European benchmarks in education and training: follow-up to the Lisbon European Council.”
28
Council Conclusions of 5 May 2003. The five benchmarks adopted cover: early school leavers; graduates in mathematics, science and technology; population having completed upper-secondary education; key competencies; and lifelong learning.
29
PART B
I. Teachers and Trainers
I
.
IMPROVING THE QUALITY OF TEACHERS AND TRAINERS
Main messages
An increasing proportion of teachers in the EU is aged over 50 – in Sweden and Germany more than 40% of teachers in both primary and secondary education are above this age. Policies and initiatives are being developed to motivate older teachers to remain in the profession and to integrate them into a dynamic of continuous professional development.
Pupil-teacher ratios vary substantially within the EU, from 9:1 in Lithuania to almost 20:1 in the UK. The majority of EU countries have pupil-teacher ratios below 15:1.
The high proportion of older teachers in school education in the EU implies that within the period 2005-2015 more than one million teachers in Europe will have to be replaced. High-quality initial teacher training, in conjunction with a process of continuous professional development are necessary to equip the teaching body with skills and competencies for its role in the knowledge society over the coming decades.
1.1
Introduction
“Improving education and training for teachers and trainers” is the first of the thirteen concrete objectives in education and training systems in Europe.30 It is the sine qua non of measures to improve the quality and effectiveness of education systems, and in turn to strengthen Europe’s position in the modern knowledge economy. As acknowledged in the Joint Interim Report of 2004,31 the success of reforms undertaken in education and training systems hinges on the motivation and quality of teaching staff.
Teachers and trainers are traditionally one of the most important interfaces between individuals and society. They have always played a crucial role in the transmission of knowledge and cultural values. However, the economic and social changes in Europe proceeding from the knowledge revolution are placing increasingly complex demands on the teaching body, in terms of its required new skills profile, especially in the areas of information and communication technologies, foreign languages and European culture and citizenship, which are all essential skills and competencies for the next generation of Europeans.
Moreover, the current state of affairs in the employment of teachers and trainers has implications for Europe’s economic and social ambitions. As the Detailed Work Programme points out, “attracting and retaining well-qualified and motivated people in the teaching profession, which is faced with massive recruitment needs due to the ageing of the teaching population, is a short- and medium-term priority in most European countries.”32
30
See Report from the Education Council to the European Council: “The concrete future objectives of education and training systems,” 2001.
31
“Education & Training 2010:” the success of the Lisbon strategy hinges on urgent reforms, p.24.
32
I. Teachers and Trainers
The ageing of the labour force affects all sectors of the economy and has been addressed repeatedly by the European Council (for example in Barcelona33 and Brussels34). An older teaching body implies relatively more experienced teachers, but also signifies that a wave of recruitment to replace retirees will be necessary. As a consequence, many countries will have the opportunity to exploit imminent changes in the teaching force. Much will depend on the capabilities of teacher training institutions to answer the challenges ahead.35
The Commission’s expert Working Group on Improving the Education of Teachers and Trainers has made a number of policy recommendations on the question of how to ensure that the teaching profession is made more attractive, and that teachers and trainers are adequately supported for their role in the knowledge society.36 These recommendations range from the development of coherent lifelong teacher education and professional development processes, quality assurance and accreditation systems, to partnership between schools and teacher-education institutions, research-based teacher teacher-education and increased mobility. A common European framework for teacher and trainer competencies and qualifications will now be elaborated. The purpose of the framework is to stimulate and support the development of policies at national level, which should increase the quality of teacher and trainer education and the capacity for innovation, thereby helping to retain well-qualified and highly-motivated teachers in the profession.37
Indicators for monitoring performance and progress
Three indicators have been selected in the objective area of teachers and trainers to monitor progress:
Number of young people in the 0-14 and 15-19 age groups and as percentage of total population
Age distribution of teachers together with upper and lower retirement age
Ratio of pupils to teaching staff by education level
Quality and availability of data and indicators
The indicators address the most easily quantifiable aspect of the objective, namely the shortage or surplus of teachers in a country. Data on the age distribution of teachers and the pupil-teacher ratio allows a certain insight into the future need for teachers and trainers, and hence the need for policy development in relation to retention, retirement, and recruitment of teaching staff. The ratio of pupils to teaching staff is also an indicator of the resources devoted to education.
However, these indicators do not capture the complexity of the objective area.38 Firstly, the three indicators do not address the very important matter of the quality and content of teaching, or of the quality of teacher-training and support systems. Secondly, the only levers
33
“Efforts should be stepped up to increase opportunities for older workers to remain in the labour market, for instance, through flexible and gradual retirement formulas and guaranteeing real access to lifelong learning. A progressive increase of about 5 years in the effective average age at which people stop working in the European Union should be sought by 2010.” Presidency Conclusions, Barcelona, p.12.
34
“The European Union is facing a pension problem, which should be redressed by encouraging active ageing and by discouraging early retirement incentives.” Presidency Conclusions, Brussels, p.20.
35
On this subject see also OECD, “Teachers Matter: Attracting, Developing and Retaining Effective Teachers,” November 2004, p. 13.
36
Working Group Progress Report, “Improving the education of teachers and trainers,” (2004)
37
ibid.
38
I. Teachers and Trainers
policy makers have in relation to these indicators is the pupil-teacher ratio, through policies related to retention, retirement and recruitment of staff.
The Commission, in co-operation with experts from Member States, has devised a plan to respond to these insufficiencies. In the short term, Eurydice will undertake a survey on the evaluation of teacher training institutions in Member States in 2005, based on official policy documents. In the medium term, the Commission will examine the option of collecting empirical information on the learning environment of students and teachers at school level through other vehicles (for example, through the planned OECD teacher survey).39
1.2
Performance and progress in Improving the Quality of teachers and
Trainers
1.2.1 Number of young people in the population
[image:30.595.89.511.364.574.2]The number of young people in the European Union is declining steadily. The number of young people in the EU15 (figures for the EU25 are only available after 1995) aged 0-14 has decreased by almost a quarter since 1975 (from 83 million in 1975 to 63 million in 2000).
Figure 1.1: Numbers of young people in the 0-14 and 15-19 age groups in the European Union, 1975 to 2000.
(million)
1975 1980 1985 1990 1995 2000
EU-15 83.2 77.4 70.5 66.6 65.4 63.3
0-14 age group
EU-25 81.7 77.1
EU-15 26.7 29.2 29.0 26.1 23.4 22.8
15-19 age group
EU-25 29.6 28.8
Source: DG EAC. Data source: Eurostat (Population Statistics)
Between 1995 and 2000, the population aged 0-14 years in the EU25 decreased by 5% and the population aged 15-19 by 2.5%. Projections indicate a continuing downward trend for 0-19 year olds over the period 2000-2010.
39
I. Teachers and Trainers
1.2.2 Age of teachers
A high proportion of older teachers implies a relatively more experienced teaching body, but also one which will be increasingly out of touch with new developments in the field if adequate provision of continuing teacher education for teachers is not made. The measures taken by various countries to retain older teachers range from bonus pay to reduction of teaching hours and changes in job profiles (for instance giving tutorship roles to experienced teachers so they can support inexperienced colleagues in a final on-the-job qualifying phase).40
As a consequence of the ageing of the teaching profession, a potentially serious shortage of staff may materialize when the current generation of older teachers reaches retirement age.41 This is a matter of some concern, considering that most teachers leave the profession before ‘normal’ retirement age,42 and that some countries experience significant difficulties in attracting qualified new teachers and trainers.43 At present the Union counts around six million teachers (2001)44 in primary and secondary education; assuming a constant pupil-teacher ratio, and taking into consideration demographic trends and projections, a minimum of one million new teachers will have to be recruited over the period 2005-2015 to satisfy replacement needs.
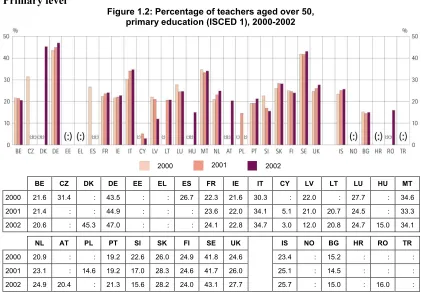
[image:31.595.87.508.320.613.2]Primary level
Figure 1.2: Percentage of teachers aged over 50, primary education (ISCED 1), 2000-2002
2000 2001 2002
BE CZ DK DE EE EL ES FR IE IT CY LV LT LU HU MT
2000 21.6 31.4 : 43.5 : : 26.7 22.3 21.6 30.3 : 22.0 : 27.7 : 34.6
2001 21.4 : : 44.9 : : : 23.6 22.0 34.1 5.1 21.0 20.7 24.5 : 33.3
2002 20.6 : 45.3 47.0 : : : 24.1 22.8 34.7 3.0 12.0 20.8 24.7 15.0 34.1
NL AT PL PT SI SK FI SE UK IS NO BG HR RO TR
2000 20.9 : : 19.2 22.6 26.0 24.9 41.8 24.6 23.4 : 15.2 : : :
2001 23.1 : 14.6 19.2 17.0 28.3 24.6 41.7 26.0 25.1 : 14.5 : : :
2002 24.9 20.4 : 21.3 15.6 28.2 24.0 43.1 27.7 25.7 : 15.0 : 16.0 :
Source: DG EAC. Data source: Eurostat (UOE)
40
See also Eurydice, The teaching profession in Europe: profile, trends and concerns, report IV, chapter 6.
41
In most Eastern and Central European Countries, measures have been taken recently to postpone teachers’ official retirement age. Reforms are increasing the age gradually over the next two decades until it is brought in accordance with the retirement age in the “old” EU member states. Often the retirement age of women are brought into line at the same time-see also Eurydice “The teaching profession in Europe: profile, trends and concerns” report IV chapter 6. For an analysis of official retirement age please see the statistical annex.
42
Eurydice, Key Data on Education in Europe , p. 142.
43
“The concrete future objectives of education and training systems” 2001.
44
I. Teachers and Trainers
Additional notes:
2002: BE Data excludes German community 2002: DK ISCED 1 includes ISCED 2
2000-02: LU Public sector only; NL ISCED 1 includes ISCED 0; IS ISCED 1 includes ISCED 2; BE Data excludes independent private institutions
Germany, Denmark and Sweden have a high proportion of older teachers at primary level, with 40% of teachers being over 50 years old (Figure 1.2). Conversely, Cyprus has an extremely low proportion of older teachers in primary education (3%), followed by Latvia (12%), with Hungary, Bulgaria and Romania all at around 15%.
Over the period 2000-2002 the proportion of teachers older than 50 at primary level increased significantly in the Netherlands, the UK, Germany and Italy, whereas it decreased in Belgium, Latvia, Slovenia, Finland, Luxembourg, Cyprus and Malta.
[image:32.595.91.509.276.556.2]Secondary level
Figure 1.3: Percentage of teachers aged over 50, secondary education (ISCED 2-3), 2000-2002
2000 2001 2002
BE CZ DK DE EE EL ES FR IE IT CY LV LT LU HU MT
2000 29.7 32.3 : 44.9 : : 19.8 32.9 28.0 43.6 : 32.4 31.9 29.2 : 22.0
2001 29.8 : : 46.7 : : : 31.1 28.9 48.7 26.1 27.6 22.9 30.7 : 24.7
2002 30.2 : : 48.8 : : : 34.8 32.8 47.9 22.7 23.6 24.2 30.7 25.7 22.9
NL AT PL PT SI SK FI SE UK IS NO BG HR RO TR
2000 35.4 : : 12.0 19.2 26.5 35.0 44.8 24.1 37.5 35.2 22.3 : 24.7 :
2001 37.1 : 21.1 12.1 19.1 28.3 36.1 44.6 26.0 37.6 36.3 22.0 : 25.1 :
2002 38.2 18.5 : 13.8 20.1 28.2 36.3 44.1 31.0 39.5 37.6 22.9 : 28.6 :
Source: DG EAC. Data source: Eurostat (UOE) Additional notes:
2000-2001: BE Data excludes independent private institutions. Teachers in social advancement education in the French Community not included. ISCED 3 includes ISCED 4. 2002 BE Data excludes German community.
2000: ES ISCED 3 includes ISCED 4
2000-2002: IE ISCED 4 included; LU Public sector only; FI ISCED 3 includes ISCED 4 and 5 vocational and technical programmes; UK ISCED 3 includes ISCED 4; IS ISCED 4 partly included in ISCED 3; NO ISCED 3 includes ISCED 4.
At secondary level, more than 40% of teachers in Germany, Sweden and Italy were over 50 in 2002, while in Austria (18.5%), and especially in Portugal (13.8%), teachers were on average significantly younger (Figure 1.3).