R E S E A R C H A R T I C L E
Open Access
PRIMEtime CE: a multistate life table model
for estimating the cost-effectiveness of
interventions affecting diet and physical
activity
Adam D. M. Briggs
1*, Linda J. Cobiac
1, Jane Wolstenholme
2and Peter Scarborough
1Abstract
Background:Non-communicable diseases are the leading cause of death in England, and poor diet and physical inactivity are two of the principle behavioural risk factors. In the context of increasingly constrained financial resources, decision makers in England need to be able to compare the potential costs and health outcomes of different public health policies aimed at improving these risk factors in order to know where to invest so that they can maximise population health. This paper describes PRIMEtime CE, a multistate life table cost-effectiveness model that can directly compare interventions affecting multiple disease outcomes.
Methods:The multistate life table model, PRIMEtime Cost Effectiveness (PRIMEtime CE), is developed from the Preventable Risk Integrated ModEl (PRIME) and the PRIMEtime model. PRIMEtime CE uses routinely available data to estimate how changing diet and physical activity in England affects morbidity and mortality from heart disease, stroke, diabetes, liver disease, and cancers either directly or via raised blood pressure, cholesterol, and body weight. Results:Model outcomes are change in quality adjusted life years, and change in English National Health Service and social care costs.
Conclusion:This paper describes PRIMEtime CE and highlights its main strengths and limitations. The model can be used to compare any number of public policies affecting diet and physical activity, allowing decision makers to understand how they can maximise population health with limited financial resources.
Keywords:Public health economics, Modelling, Economic modelling, Non-communicable disease, Diet, Physical activity, Public health
Background
Non-communicable diseases (NCDs) are responsible for 88% of the total disease burden in England, 38% of which is attributable to potentially amenable behavioural, envi-ronmental, and metabolic risk factors [1]. The four leading behavioural risk factors for disease in England are tobacco, unhealthy diets, alcohol and drug misuse, and physical inactivity [1]. Of these, poor diet and physical inactivity account for a quarter of the total attributable disease
burden, a burden that could be significantly reduced through public health interventions [1–4].
Over recent years, there have been increasing pressures on acute health services in England and as a consequence, health providers are arguing for there to be a greater emphasis placed on prevention. Both the 2019 NHS Long Term Plan and the UK Secretary of State for Health and Social Care’s 2018 vision for prevention explicitly state that prevention and population health improvement are policy priorities [5,6]. In order for prevention and public health to play their part in maintaining the sustainability of the NHS, public health practitioners and decision makers need to have the information, influence, and
© The Author(s). 2019Open Access This article is distributed under the terms of the Creative Commons Attribution 4.0
International License (http://creativecommons.org/licenses/by/4.0/), which permits unrestricted use, distribution, and reproduction in any medium, provided you give appropriate credit to the original author(s) and the source, provide a link to the Creative Commons license, and indicate if changes were made. The Creative Commons Public Domain Dedication waiver (http://creativecommons.org/publicdomain/zero/1.0/) applies to the data made available in this article, unless otherwise stated.
* Correspondence:[email protected]
1
Centre on Population Approaches for Non-Communicable Disease Prevention and NIHR Biomedical Research Centre at Oxford, Nuffield Department of Population Health, University of Oxford, Old Road Campus, Headington, Oxford OX3 7LF, UK
resources to make the best decisions about how to spend finite resources.
In 2013, the structure of public health in England changed with public health responsibility moving from the NHS to local government [7]. This allows public health professionals to influence more readily the wider determinants of health whilst also making them vulne-rable to local government budget constraints [8]. In 2016 the UK Health Select Committee highlighted the chal-lenges faced by public health professionals, citing evidence that real-terms funding of public health in England will be cut from £3.47bn to just over £3bn between 2015/ 16 and 2020/21 [9].
Despite shrinking public health budgets, there is still significant potential to improve population health using prevention strategies that may be cost-effective or cost saving [2,3,10,11]. To make informed choices about how to maximize population health with limited resources, local and national decision makers need to quantify and compare the possible impact, cost, and opportunity costs of different interventions.
Public health economic modelling
There are well established methods for modelling the cost-effectiveness of healthcare interventions. For ex-ample, the International Society for Pharmacoeconomics and Outcomes Research-Society for Medical Decision Making (ISPOR-SMDM) guidelines for modelling re-search have published multiple best practice guidelines [12]. Furthermore, The National Institute for Health and Care Excellence (NICE) has guidance on methods for health economic modelling [13]. The ISPOR-SMDM guidelines and NICE guidance aim to standardise methods for health technology assessments (HTAs) so that the re-sults from different studies can be directly compared with each other against a decision framework, such as the NICE cost effectiveness threshold of £20,000 to £30,000 [13]. However, economic evaluations of public health in-terventions have their own specific challenges compared with HTAs such as quantifying long term outcomes, wider societal consequences and the impact on inequalities, and the effects of multicomponent interventions [14–24].
In 2005, NICE started producing guidance on public health interventions, including economic modelling [13, 25, 26]. The NICE reference case now includes advice on how to address some of the challenges of public health economic evaluations: for example, the time horizon should be long enough to incorporate all important costs and effects; the perspective on costs may be public sector, societal, or any other as appropriate; and non-health bene-fits to local government and other settings may also be included [13]. However, the guidance is not prescriptive, meaning that different public health economic modellers often use different model structures, time horizons, health
and economic perspectives, epidemiological data, and out-come measures [24]. Even within academic fields with a well-established history of health economic modelling, such as diabetes, chronic obstructive pulmonary disease (COPD), and cancer, different model structures and assumptions can produce very different outcomes despite modelling the same intervention [27–29]. Therefore, often it is not possible to compare results directly when prio-ritising different public health policies. As such, standar-dised processes are required for assessing and modelling the cost, health impact, and cost-effectiveness of public health interventions.
Aim
In this paper we describe the PRIMEtime Cost Effective-ness (PRIMEtime CE) model. PRIMEtime CE addresses some of the challenges outlined above by being able to directly compare the cost-effectiveness of public health policies aimed at improving population diet or levels of physical activity.
Methods
PRIMEtime CE estimates the cost-effectiveness and return on investment of interventions affecting the population distribution of physical activity levels and 13 dietary risk factors in a modelled population. Modelled interventions can affect risk factors either in isolation or in any given combination.
PRIMEtime CE was developed from the Preventable Risk Integrated ModEl (PRIME) and the PRIMEtime model. PRIME is a cross-sectional comparative risk assessment model that estimates the age and sex-specific impact on NCD mortality from changing the population distribution of 10 dietary risk factors, plus physical activity, smoking, and alcohol. Modelled diseases include seven types of car-diovascular disease, diabetes, 13 cancer subtypes, chronic obstructive pulmonary disease, kidney disease, and liver disease. Each parameter used in the model is drawn from a meta-analysis of either prospective cohort studies or ran-domised controlled trials. The statistical detail underlying PRIME has been previously published, including listing various publications arising from the model [30].
PRIMEtime
developed by Cobiac and colleagues in Australia and New Zealand [32–34]. It simulates a closed adult population cohort (aged 15 and above) by single year of age and by sex over the lifetime of the cohort or until individuals reach 100 years of age. It uses UK specific data by age and sex (where available) on baseline disease incidence, preva-lence, case-fatality rates (the annual mortality rate among prevalent cases), and disease trends.
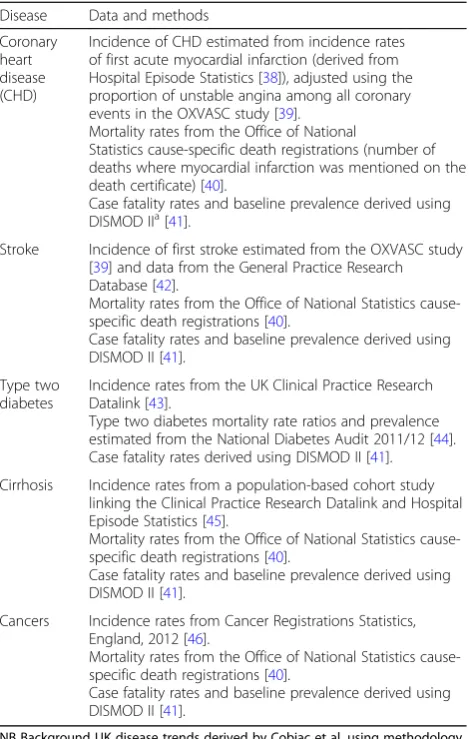
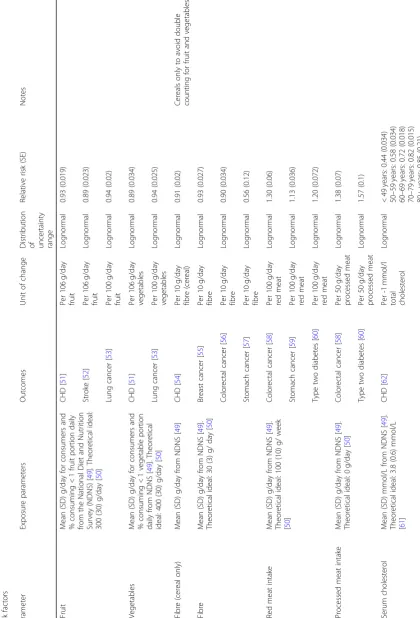
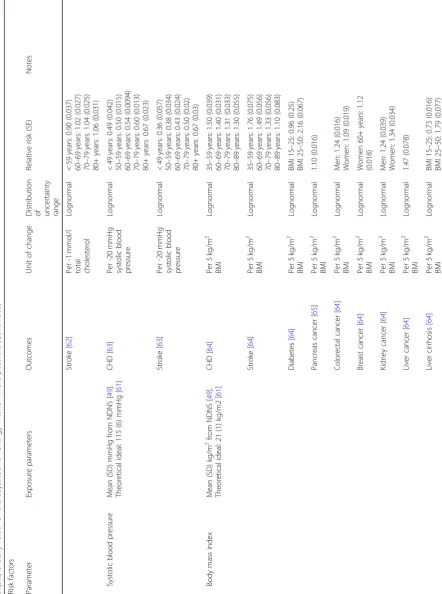
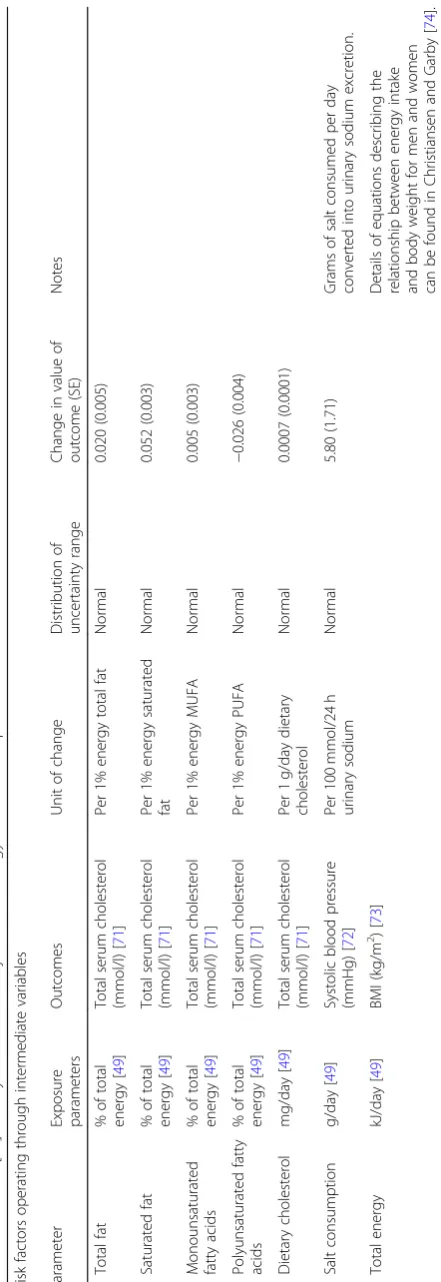
As with PRIME, the relationships between diet and di-sease are parameterised using meta-analyses of randomised controlled trials or prospective observational studies and are modelled either as direct effects or via one of three intermediate risk factors: blood pressure, BMI, and total cholesterol. PRIMEtime is built in Microsoft Excel and uses Ersatz and EpiGearXL add-ins from EpiGear International to run Monte Carlo probabilistic sensitivity analyses and quantify the uncertainty in model input data [35–37]. The 2.5th and 97.5th percentiles of multiple model runs are used to estimate 95% uncertainty intervals (UIs, usually 2000 runs by which point uncertainty ranges have con-verged on a stable value). Tables1, 2,3,4, 5 and6 show the sources of input data and uncertainty distributions in-cluded in PRIMEtime and PRIMEtime CE.
PRIMEtime CE
PRIMEtime CE is developed from PRIMEtime by adding healthcare and social care costs, estimates of morbidity based on age, sex, and disease state, and physical activity as a behavioural risk factor. The relationship between free sugars and total cholesterol is currently not included in PRIMEtime CE, although this could be added.
The conceptual modelling framework for public health economic models published by Squires’et al. was used to guide the development of a conceptual model [81]. The initial conceptual model was shared with multiple stake-holders who provided feedback on the proposed model outcomes, the relationships described, and its face validity. Stakeholders included national governmental organi-zations, local governmental organiorgani-zations, charitable orga-nizations, health professional and academic orgaorga-nizations, and patients and public (see Table7). The final conceptual model is shown in Fig.1.
Adding physical activity as a risk factor
Population physical activity levels by age and sex are taken from the Active People Survey, 2010–2011 (APS) [68]. The APS collects information on sport participation rates from a representative English population sample and includes the degree of participation in a variety of acti-vities. Physical activity data from APS were used to calcu-late the total number of metabolic equivalent of task (MET) minutes per week for each respondent. A MET is defined as consuming 3.5 ml of oxygen per kg of body weight per minute, the resting metabolic rate. Levels of
physical exertion can be measured in relation to this rest-ing metabolic rate, for example runnrest-ing at seven miles per hour is equivalent to 11 METs [82]. The APS includes data for 166,275 adults aged 16 years and over after out-liers reporting over 200 MET hours/week were removed.
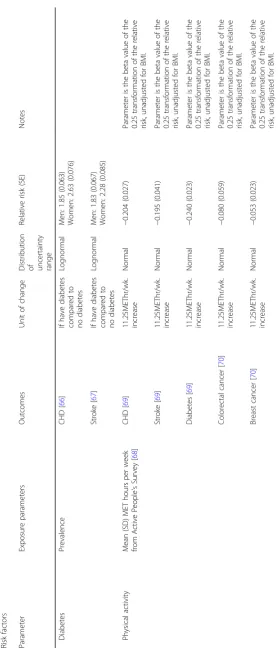
The relationships between physical activity and IHD, stroke, type two diabetes, breast cancer, and colorectal can-cer are included in PRIMEtime CE. The beta-coefficient describing the dose-response relationship between physical activity and disease was derived using two recent meta-ana-lyses of observational studies, both conducted by the same research group using the same methodology [69,70]. The parameters are unadjusted for obesity as this is assumed to act on the causal pathway (the effect of physical activity on disease is modelled directly rather than via BMI).
[image:3.595.305.540.120.490.2]Each age and sex group in the population is divided into four categories: sedentary (zero minutes of moderate phys-ical activity per week), under active (less than 60 min of
Table 1Disease specific data inputs for PRIMEtime CE (all age and sex specific), reproduction of table 1 in supplementary file of Cobiac et al. (with permission) [31]
Disease Data and methods
Coronary heart disease (CHD)
Incidence of CHD estimated from incidence rates of first acute myocardial infarction (derived from
Hospital Episode Statistics [38]), adjusted using the
proportion of unstable angina among all coronary
events in the OXVASC study [39].
Mortality rates from the Office of National
Statistics cause-specific death registrations (number of deaths where myocardial infarction was mentioned on the
death certificate) [40].
Case fatality rates and baseline prevalence derived using
DISMOD IIa[41].
Stroke Incidence of first stroke estimated from the OXVASC study
[39] and data from the General Practice Research
Database [42].
Mortality rates from the Office of National Statistics
cause-specific death registrations [40].
Case fatality rates and baseline prevalence derived using
DISMOD II [41].
Type two diabetes
Incidence rates from the UK Clinical Practice Research
Datalink [43].
Type two diabetes mortality rate ratios and prevalence
estimated from the National Diabetes Audit 2011/12 [44].
Case fatality rates derived using DISMOD II [41].
Cirrhosis Incidence rates from a population-based cohort study
linking the Clinical Practice Research Datalink and Hospital
Episode Statistics [45].
Mortality rates from the Office of National Statistics
cause-specific death registrations [40].
Case fatality rates and baseline prevalence derived using
DISMOD II [41].
Cancers Incidence rates from Cancer Registrations Statistics,
England, 2012 [46].
Mortality rates from the Office of National Statistics
cause-specific death registrations [40].
Case fatality rates and baseline prevalence derived using
DISMOD II [41].
NB Background UK disease trends derived by Cobiac et al. using methodology from the global burden of disease project [31,47,48].
a
Table
4
PRIMEtime
CE
risk
factors'
theoretical
minimum
risk
and
modelled
uncertainty
distributions.
Adapted
and
updated
from
Cobiac
et
al.[
32
]
Risk
facto
rs
’
theoretical
minim
um
risk
Para
meter
Expo
sure
paramete
rs
Out
comes
Un
it
of
chang
e
Distri
bution
of
unc
ertainty
ran
ge
Minim
um
risk
valu
e
(SE
)
Notes
Body
mas
s
index
(kg/m
2 )[
61
]
––
–
Norm
al
21
(1)
Systo
lic
blood
press
ure
(mmHg)
[
61
]
––
–
Norm
al
115
(6)
Tot
al
chol
esterol
(mmo
l/L)
[
61
]
––
–
Norm
al
3.8
(0.6)
Vege
table
inta
ke
(g/d
ay)
[
50
]
––
–
Norm
al
400
(30)
Fruit
inta
ke
(g
/day)
[
50
]
––
–
Norm
al
300
(30)
Fibre
intake
(g/day)
[
50
]
––
–
Norm
al
30
(3)
Red
meat
inta
ke
(g/day)
[
50
]
––
–
Norm
al
14.3
(1.43
)
Proc
essed
meat
inta
ke
(g/d
ay)
[
50
]
––
–
Norm
al
0
Phy
sical
activ
ity
(METhrs
/wk)
[
74
]
––
–
Norm
al
133
(13.3
)
SD
standard
deviation,
NDNS
National
Diet
and
Nutrition
Survey,
CHD
coronary
heart
disease,
BMI
body
mass
index,
MET
Metabolic
Equivalent
of
Table
5
PRIMEtime
CE
mediation
factors,
exposure
parameters,
outcomes,
and
modelled
uncertainty
distributions.
Adapted
and
updated
from
Cobiac
et
al.[
32
]
Medi
ation
facto
rs
Para
meter
Exposu
re
parameters
Outcom
es
Unit
of
chang
e
D
istribution
of
unc
ertainty
ran
ge
Change
in
value
of
out
come
(SE
)
Notes
Ischae
mic
stroke
mediati
on
BMI
(kg/m
2)
Systoli
c
blood
pre
ssure
(mm
Hg)
[
74
]
Norm
al
0.65
(0.04
)
Fruit
intake
(g/day)
Systoli
c
blood
pre
ssure
(mm
Hg)
[
74
]
Norm
al
0.42
(0.17
Vegeta
ble
intake
(g/day)
Systoli
c
blood
pre
ssure
(mm
Hg)
[
74
]
Norm
al
0.54
(0.2)
Fruit
intake
(g/day)
Total
choles
terol
(mm
ol/L
)
[
74
]
Norm
al
0.027
(0.017)
Vegeta
ble
intake
(g/day)
Total
choles
terol
(mm
ol/L
)
[
74
]
Norm
al
0.047
(0.026)
Ischae
mic
heart
disease
me
diation
BMI
(kg/m
2)
Systoli
c
blood
pre
ssure
(mm
Hg)
[
74
]
Norm
al
0.31
(0.01
6)
Fruit
intake
(g/day)
Systoli
c
blood
pre
ssure
(mm
Hg)
[
74
]
Norm
al
0.39
(0.15
)
Vegeta
ble
intake
(g/day)
Systoli
c
blood
pre
ssure
(mm
Hg)
[
74
]
Norm
al
0.47
(0.21
)
Fruit
intake
(g/day)
Total
choles
terol
(mm
ol/L
)
[
74
]
Norm
al
0.008
(0.0057)
Vegeta
ble
intake
(g/day)
Total
choles
terol
(mm
ol/L
)
[
74
]
Norm
al
0.012
(0.01)
SD
standard
deviation,
NDNS
National
Diet
and
Nutrition
Survey,
CHD
coronary
heart
disease,
BMI
body
mass
index,
MET
Metabolic
Equivalent
of
moderate physical activity per week but not sedentary), ac-tive (60–150 min per week), and recommended (meeting the UK Chief Medical Officers’recommendations of 150 min of moderate physical activity per week or more) [83]. Examples of moderate physical activity include brisk walk-ing and cyclwalk-ing. The mean and standard error MET hours/ week is calculated from APS for each age and sex group in each physical activity category. These can then be applied to results from the meta-analyses to estimate the relative risk of disease compared to being sedentary. These relative risks are used in PRIMEtime CE to predict the change in disease burden following an intervention.
Furthermore, in PRIMEtime CE, decreasing the preva-lence of type two diabetes reduces the risk of the modelled cohort developing IHD and stroke. Using the relationships describing the effect of physical activity on IHD, stroke, and diabetes derived using Wahid et al. would over-estimate the effect of physical activity on IHD and stroke as falls in diabetes would result in additional CVD reduc-tions beyond those estimated in the meta-analyses. There-fore, the relative risk of physical activity on IHD and stroke from Wahid et al. was adjusted downwards using results from Cobiac and Scarborough such that the overall effect of physical activity on CVD is the sum of the direct effect plus that mediated via diabetes [84].
Uncertainty in the size of the relationship between physical activity and disease (the beta-coefficient) was estimated from 95% confidence intervals reported in the
meta-analyses. Both this uncertainty and uncertainty in the mean physical activity level for each age and sex group based on the standard error reported in APS are included in PRIMEtime CE.
[image:10.595.305.534.97.547.2]A limitation of this method is that Wahid et al. include domains of physical activity such as occupational activity and household activity that are not captured in the APS. Therefore, the disease relative risks used by PRIMEtime CE are based on higher levels of physical activity than those reported by the APS, where only leisure time phys-ical activity is recorded. As a result, the overall health benefit modelled by PRIMEtime CE may be an over-estimate because the effect of physical activity on health is
Table 6PRIMEtime CE sources and uncertainty distributions for baseline population data, costs, and utilities. All inputs are age and sex specific
Parameter Data and methods
English population
From Office for National Statistics census data, no
uncertainty estimated [75].
Mortality rates Extracted from the Human Mortality Database, no
uncertainty estimated [76].
Health sector costs
Disease specific costs derived from NHS England
programme budgeting data [77] and unrelated disease
costs estimated using NHS England cost curves [78].
Using the same approach as Blakely et al., [34] health
sector costs are assumed to be“moderately uncertain”,
and therefore uncertainty is estimated using a generic multiplication factor across all health sector costs with a gamma distribution based on a normal distribution (mean 1, SD 0.1).
Societal costs Disease specific and unrelated productivity, social care,
and wider societal costs estimated using a Department of Health tool published as a supplementary file in
Claxton et al [79]. As with health sector costs,
uncertainty estimated using a generic multiplication factor across all societal costs with a gamma
distribution based on a normal distribution (mean 1, SD 0.1).
Utilities Baseline mean EQ-5D utility scores and disease specific
decrements and their standard errors taken from Sullivan et al., with adjustments made for age and
[image:10.595.57.292.119.386.2]number of chronic conditions [80].
Table 7List of stakeholders
Stakeholder category Stakeholder
(i) National governmental organisations
National governmenta,b
Department of Healtha,b
National Institute for Health and Care
Excellencea,b
Public Health Englandb
Physical activity and diet responsibility
dealb
(ii) Local governmental organisations
Local Government Associationb
Thames Valley Public Health England
Centreb
Oxfordshire County Council Public
Health Departmentb
(iii) Charitable organisations The Wellcome Trust (project funder)
UK Health Foruma,b
British Heart Foundationa,b
Food Ethics Councila,b
Consensus Action on Salt and
Hypertension / Action on Sugara,b
World Obesity Federationa,b
Diabetes UKa,b
Sustaina,b
Blood Pressure UKa,b
(iv) Health professional and academic organisations
Association of Directors of Public
Healthb
Academy of Medical Royal Collegesa,b
Faculty of Public Healtha,b
International Society for Physical
Activity and Healthb
International Society of Behavioural
Nutrition and Physical Activityb
The Nutrition Societya,b
Association for the Study of Obesitya,b
(v) Patients and the public Members of the publica
Patients with chronic diseasea
a
contacted to identify scenarios to test;b
non-linear with greater health benefits accruing from gains at lower baseline physical activity levels.
Estimating healthcare and social care costs
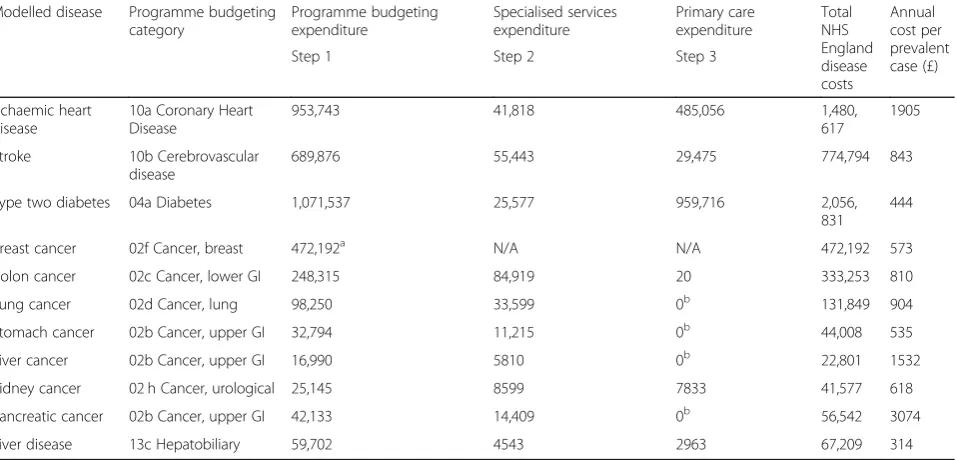
Annual disease specific NHS England costs per prevalent case that are comparable between different diseases are de-rived from 2013/14 programme budgeting data, [77] de-tailed methods and model costs can be found in Briggs et al [85]. In summary, a macro top-down approach was taken
where total NHS England expenditure in 2013/14 is disag-gregated to the level of ICD-10 code for diseases included in PRIMEtime CE. Total disease specific costs were divided by the estimated 2014 prevalence of each individual disease in PRIMEtime CE to give the annual cost per prevalent case, averaged across the entire population irrespective of time since diagnosis. The remaining NHS England budget not accounted for by diseases included in PRIMEtime CE was used to calculate the age and sex specific annual
[image:11.595.55.542.88.322.2]Fig. 1The PRIMEtime CE conceptual model
Table 8Total 2013/14 expenditure by modelled disease (£000 s except cost per prevalent case) Reproduction of Tables2,3,4and5
in Briggs et al. (with permission) [85]
Modelled disease Programme budgeting
category
Programme budgeting expenditure
Specialised services expenditure
Primary care expenditure
Total NHS England disease costs
Annual cost per prevalent case (£)
Step 1 Step 2 Step 3
Ischaemic heart disease
10a Coronary Heart Disease
953,743 41,818 485,056 1,480,
617
1905
Stroke 10b Cerebrovascular
disease
689,876 55,443 29,475 774,794 843
Type two diabetes 04a Diabetes 1,071,537 25,577 959,716 2,056,
831
444
Breast cancer 02f Cancer, breast 472,192a N/A N/A 472,192 573
Colon cancer 02c Cancer, lower GI 248,315 84,919 20 333,253 810
Lung cancer 02d Cancer, lung 98,250 33,599 0b 131,849 904
Stomach cancer 02b Cancer, upper GI 32,794 11,215 0b 44,008 535
Liver cancer 02b Cancer, upper GI 16,990 5810 0b 22,801 1532
Kidney cancer 02 h Cancer, urological 25,145 8599 7833 41,577 618
Pancreatic cancer 02b Cancer, upper GI 42,133 14,409 0b 56,542 3074
Liver disease 13c Hepatobiliary 59,702 4543 2963 67,209 314
a
[image:11.595.61.540.485.715.2]healthcare spend on diseases unrelated to those explicitly modelled by PRIMEtime CE that accrues as people age. A summary of included model costs is shown in Table8.
Social care costs are estimated using the wider societal costs tool developed by the Department of Health [78]. The tool estimates the age and sex specific effect on pro-duction (paid and unpaid) and consumption following a change in quality of life (quantified using utility values measured by the EQ-5D-3L questionnaire) and ICD-10 code. Consumption includes social care (described as formal care by the tool), informal care (care provided by family and friends), private paid (goods and services purchased for consumption), private unpaid (benefit from goods and services not paid for, such as domestic work), and government (services provided by the government not included in other categories). Social care costs are estimated as a function of age and quality of life, in PRIMEtime CE they are included from the age of 75 years (as per the Department of Health tool) and assume an average monthly cost of £4826 per person (the 2013/14 monthly local authority residential care cost [87]) [79]. This reflects the total societal costs of adult social care rather than the direct costs to local authorities because many people are required to fund a proportion of their care from personal savings.[88]
In PRIMEtime CE, both the change in social care costs arising as a result of changes to modelled diseases and from unrelated diseases due to increasing longevity are included. Age and sex specific utility values for quality of life at baseline and for each disease are calculated using the methods described under ‘Estimating utilities’ below. Productivity gains and wider societal costs can be readily included as sensitivity analyses. A key assumption underlying the Department of Health wider societal costs tool is that quality of life is the key driver of costs, irrespective of diagnosis (stroke and dementia are excep-tions to this). In reality this may underestimate the effect of certain diagnoses on an individual’s ability to care for themselves or to be productive.
Estimating utilities
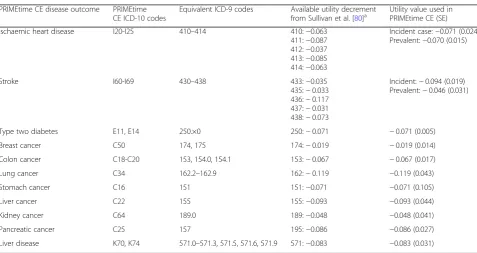
Morbidity is estimated using Sullivan et al.’s catalogue of EQ-5D utility values [80, 89]. The EQ-5D results were collected by Sullivan et al. from annual US medical ex-penditure surveys between 2000 and 2003, and included 79,522 unique responses with linked clinical data for the preceding year covering 135 ICD-9 codes; an equivalent representative UK source of EQ-5D results does not exist. The EQ-5D survey results were then valued using time trade off methods by a representative UK popula-tion sample (as recommended by NICE) [90].
Matching the ICD-9 disease codes published by Sulli-van et al. to ICD-10 codes used by PRIMEtime CE was done with the website www.icd10data.com [91]. The
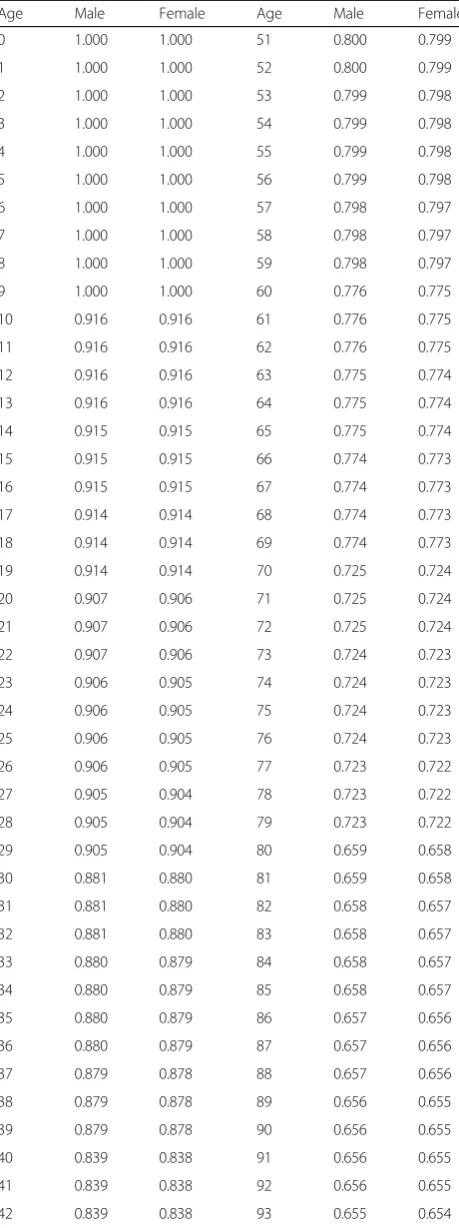
calculation of baseline utility values by age and sex, and disease specific utility decrements followed guidance published by Sullivan et al. in their UK and US papers [80, 92]. To use these utility values to estimate the change in quality adjusted life years (QALYs) in PRIME-time CE following an intervention, the age and sex spe-cific utility values change with age based on number of years that the model has been running for, and on changes to the proportion of the population in different disease states. If thought important, as with other input parameters to PRIMEtime CE, it is possible to change the utility decrements used within the model either for a primary analysis or for sensitivity analyses. Baseline age and sex specific utility values and the disease spe-cific utility decrements used in PRIMEtime CE are pre-sented in Tables9and10.
The additional change in utility decrement based on an individual’s number of chronic conditions (as esti-mated by Sullivan et al.) was not included in PRIMEtime CE because of the inability to accurately estimate the baseline prevalence of co-morbidity and how it changes following an intervention. To test the impact of this limitation on results, the model was run firstly using a theoretical scenario without any decrement arising from co-morbidity, and secondly, assuming that everybody had the maximum possible additional decrement. Re-sults were not significantly different from one another.
Sullivan et al. EQ-5D scores are sampled from a non-English patient population survey and there is likely to be underrepresentation of those at very early and late stages of disease as these population groups may be too unwell or unwilling to participate. In order to identify whether utility values published in the Sullivan et al. catalogue were similar to those identified in other popu-lations using different methods, we compared Sullivan et al. with EQ-5D derived breast cancer utility values that were systematically identified from the literature. We used a pre-defined protocol following NICE guidance (see Additional file1for protocol) [90].
The systematic review identified 196 studies for full text review from which 23 studies were included for data-extraction. Four studies received the joint highest study quality and applicability score (see Additional file 1 for scoring method) and the extracted utility values from these four studies are shown in the Additional file1: Table S1. The utility values from each of these four studies overlap with the mean utility value among breast cancer patients reported by Sullivan et al [80].
Results
Estimating the effects and costs of the interventions and model validation
in question. Examples of this and a discussion of the model’s validation can be found in Briggs et al [93].
Following stakeholder feedback, the primary outcomes of PRIMEtime CE are cost-effectiveness and return on investment (for interventions that are cost-saving) from an English health and social care perspective over a 10-year time horizon. Cost-effectiveness is cal-culated as: (Cb–Ca) / (Eb–Ea); where Cbis the sum of intervention costs and expenditure on health and social care in the 10 years following the intervention; Ca is the 10 year costs of health and social care in the scenario where there is no intervention; Ebis the total number of QALYs experienced by the modelled population in the 10 years following the intervention; and Ea is the same but where no intervention is modelled. In the case where (Cb – Ca) is negative and therefore the intervention is cost saving compared with no intervention, return on investment is the money saved for every £1 spent: (Cb – Ca) / Ci; where Ci is the cost of the intervention. Included are all costs of the intervention, whether they are incurred by government organisations such as the NHS and local authorities, or by industry where appropriate, as these costs may be relevant to decision makers. Costs and health outcomes are discounted at 1.5% as recommended by NICE for interventions likely to have long-term health benefits [13] (see Table 11). However, there is flexibility within the PRIMEtime CE model to manipulate all of these parameters to either change the model’s primary outcomes, or as sensitivity analyses (see Table12for a list of potential PRIMEtime CE sensitivity analyses).
Sensitivity analyses
Sensitivity analyses can be used with PRIMEtime CE to explore the effects on cost-effectiveness of changing various assumptions including time horizon, discount rate, and removing industry related costs (Table9).
Discussion
[image:13.595.58.288.110.725.2] [image:13.595.306.539.110.236.2]This paper describes the PRIMEtime CE model and its data inputs. PRIMEtime CE can help public health decision
Table 9Baseline EQ-5D utility values by age and sex for use in PRIMEtime CE
Age Male Female Age Male Female
0 1.000 1.000 51 0.800 0.799
1 1.000 1.000 52 0.800 0.799
2 1.000 1.000 53 0.799 0.798
3 1.000 1.000 54 0.799 0.798
4 1.000 1.000 55 0.799 0.798
5 1.000 1.000 56 0.799 0.798
6 1.000 1.000 57 0.798 0.797
7 1.000 1.000 58 0.798 0.797
8 1.000 1.000 59 0.798 0.797
9 1.000 1.000 60 0.776 0.775
10 0.916 0.916 61 0.776 0.775
11 0.916 0.916 62 0.776 0.775
12 0.916 0.916 63 0.775 0.774
13 0.916 0.916 64 0.775 0.774
14 0.915 0.915 65 0.775 0.774
15 0.915 0.915 66 0.774 0.773
16 0.915 0.915 67 0.774 0.773
17 0.914 0.914 68 0.774 0.773
18 0.914 0.914 69 0.774 0.773
19 0.914 0.914 70 0.725 0.724
20 0.907 0.906 71 0.725 0.724
21 0.907 0.906 72 0.725 0.724
22 0.907 0.906 73 0.724 0.723
23 0.906 0.905 74 0.724 0.723
24 0.906 0.905 75 0.724 0.723
25 0.906 0.905 76 0.724 0.723
26 0.906 0.905 77 0.723 0.722
27 0.905 0.904 78 0.723 0.722
28 0.905 0.904 79 0.723 0.722
29 0.905 0.904 80 0.659 0.658
30 0.881 0.880 81 0.659 0.658
31 0.881 0.880 82 0.658 0.657
32 0.881 0.880 83 0.658 0.657
33 0.880 0.879 84 0.658 0.657
34 0.880 0.879 85 0.658 0.657
35 0.880 0.879 86 0.657 0.656
36 0.880 0.879 87 0.657 0.656
37 0.879 0.878 88 0.657 0.656
38 0.879 0.878 89 0.656 0.655
39 0.879 0.878 90 0.656 0.655
40 0.839 0.838 91 0.656 0.655
41 0.839 0.838 92 0.656 0.655
42 0.839 0.838 93 0.655 0.654
Table 9Baseline EQ-5D utility values by age and sex for use in PRIMEtime CE(Continued)
Age Male Female Age Male Female
43 0.838 0.837 94 0.655 0.654
44 0.838 0.837 95 0.655 0.654
45 0.838 0.837 96 0.655 0.654
46 0.838 0.837 97 0.654 0.653
47 0.837 0.836 98 0.654 0.653
48 0.837 0.836 99 0.654 0.653
49 0.837 0.836 100 0.653 0.652
makers by estimating and directly comparing the cost ef-fectiveness of interventions affecting population dietary habits and levels of physical activity, using the same under-lying data and assumptions. Furthermore, PRIMEtime CE quantifies the health and social care costs - as well as any reduction in quality of life - arising as a consequence of de-veloping diseases unrelated to those modelled. This makes it possible for decision makers to be reasonably confident (within the uncertainty intervals presented) that one inter-vention is likely to be more cost effective than another given the time horizon and economic perspective used.
Addressing the challenges of public health economic modelling
PRIMEtime CE addresses some of the challenges of pub-lic health economic modelling, namely quantifying long
term health outcomes, wider societal consequences, and the effects of multicomponent interventions [15,17,23].
Multistate life table models are well suited to modelling long terms health impacts and PRIMEtime CE can model outcomes over a population’s lifetime. Furthermore, both health and social care costs are included, thereby incorp-orating some wider societal consequences of the interven-tions modelled. There is a broader debate in the literature about how best to value outcomes from public health in-terventions where they may have societal and environ-mental costs and benefits beyond health that are not quantified using cost-utility analyses [14–18, 20, 81, 94, 95]. However, using cost utility analyses and reporting the cost per QALY is a useful method for health policy makers in England because it is consistent with the NICE ap-proach to assessing medical interventions and - as things stand - is therefore relatively easy to interpret and com-pare with other health economic assessments [13].
A limitation of multistate life table models (and cohort models more generally) is that they are less flexible than some other modelling approaches (for example, using microsimulation) at modelling heterogeneous populations and quantifying the impact of an intervention on inequal-ities. In order to obtain results by population subgroup using PRIMEtime CE, the user would need to conduct multiple runs, each with a different population subgroup and using subgroup specific model input parameters.
[image:14.595.58.536.97.350.2]Additionally, PRIMEtime CE does not fully address the challenges of modelling multicomponent interven-tions, for example, an intervention including both social
Table 11Values and settings used for PRIMEtime CE primary analyses
Variable Value or setting
Annual discount rate for health outcomes
1.5%
Annual discount rate for costs 1.5%
Economic perspective NHS England and social care
costs for both modelled and unrelated diseases
Intervention costs Costs to government and to
industry where appropriate
[image:14.595.58.291.608.730.2]Time horizon 10 years
Table 10Disease specific utility values used in PRIMEtime CE
PRIMEtime CE disease outcome PRIMEtime
CE ICD-10 codes
Equivalent ICD-9 codes Available utility decrement
from Sullivan et al. [80]a Utility value used inPRIMEtime CE (SE)
Ischaemic heart disease I20-I25 410–414 410:−0.063
411:−0.087
412:−0.037
413:−0.085
414:−0.063
Incident case:−0.071 (0.024)
Prevalent:−0.070 (0.015)
Stroke I60-I69 430–438 433:−0.035
435:−0.033
436:−0.117
437:−0.031
438:−0.073
Incident:−0.094 (0.019)
Prevalent:−0.046 (0.031)
Type two diabetes E11, E14 250.×0 250:−0.071 −0.071 (0.005)
Breast cancer C50 174, 175 174:−0.019 −0.019 (0.014)
Colon cancer C18-C20 153, 154.0, 154.1 153:−0.067 −0.067 (0.017)
Lung cancer C34 162.2–162.9 162:−0.119 −0.119 (0.043)
Stomach cancer C16 151 151:−0.071 −0.071 (0.105)
Liver cancer C22 155 155:−0.093 −0.093 (0.044)
Kidney cancer C64 189.0 189:−0.048 −0.048 (0.041)
Pancreatic cancer C25 157 195:−0.086 −0.086 (0.027)
Liver disease K70, K74 571.0–571.3, 571.5, 571.6, 571.9 571:−0.083 −0.083 (0.031)
a
marketing and legislative changes. Some more complex model structures, such as system dynamics models and discrete event simulation, might be better suited to this as they can simulate interactions between population subgroups, or between the population and the environ-ment [24]. However, multistate life tables do allow for additional disease outcomes to be included without hav-ing to construct a new model meanhav-ing that they can be readily adapted if multicomponent interventions include diseases that are not already simulated. And PRIMEtime CE allows for the effect of an intervention on multiple dif-ferent dietary and physical activity risk factors to be mod-elled simultaneously.
Generalisability and comparisons with other models It is intended that PRIMEtime CE will be used to produce comparable cost-effectiveness estimates of different public health policies, including ranking interventions, to help decision makers prioritise resources. Similar rankings have been compiled in the UK and elsewhere; for example, the
NICE physical activity return on investment tool, [96,97] the ACE Prevention programme of research in Australia, [98] and the BODE3 Programme in New Zealand [99]. The NICE physical activity return on investment tool compares how different physical activity interventions would affect health and costs for a population of interest. The tool is based on a Markov model that estimates how changes to levels of physical activity affect the preva-lence of CHD, stroke, and type two diabetes. The tool has a user-friendly interface whereby various model inputs can be manipulated and the outputs analysed. Unlike PRIMEtime CE, however, the disease costs and utilities used by the model are from a variety of different sources and population groups.
The research programmes in Australia and New Zea-land both used systematic and comparable approaches to estimating the cost-effectiveness of different public health interventions, with the explicit aim of informing policy. As with PRIMEtime CE, these were developed using country specific routine data where possible, with standar-dised approaches to estimating utilities and costs. The BODE3programme of research derived age, sex, and dis-ease specific health costs from Health Tracker - national data that individually links costs with health events, [100] and New Zealand specific disability weights are taken from the Global Burden of Disease study [101]. The ACE programme used the DISMOD tool and data from the Netherlands to estimate disability weights based on Aus-tralian burden of disease data (see Begg et al. for details [102]), and costs were taken from a national dataset with disease specific healthcare cost estimates [103]. The use of country specific data sources mean that al-though results from the ACE and BODE3programmes of research may not be directly applicable to England, both can rank interventions.
Strengths and limitations
PRIMEtime CE has several strengths. Bias is minimised by adopting a consistent and systematic approach to identifying model input parameters, in particular disease costs and utilities; model uncertainty is quantified; there are options for multiple sensitivity analyses; and changes to costs and quality of life from diseases unrelated to those modelled can be estimated.
[image:15.595.56.291.94.485.2]There are some important methodological limitations of both the data sources used by PRIMEtime CE, and the model’s structure. Firstly, multistate life table models assume diseases are independent of one another. This means that the proportion of the cohort existing in one disease state does not affect the probability of the cohort developing any other disease states - the model cannot distinguish between whether the population with breast cancer is the same as that with heart disease. Multistate life table models may therefore over- or under-estimate
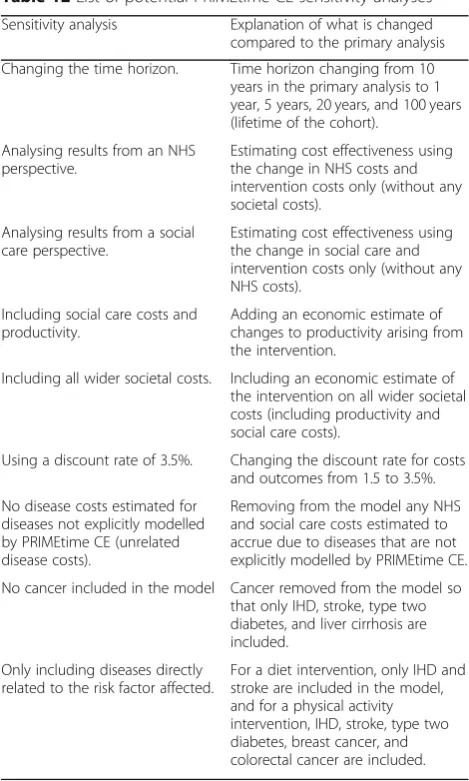
Table 12List of potential PRIMEtime CE sensitivity analyses
Sensitivity analysis Explanation of what is changed
compared to the primary analysis
Changing the time horizon. Time horizon changing from 10
years in the primary analysis to 1 year, 5 years, 20 years, and 100 years (lifetime of the cohort).
Analysing results from an NHS perspective.
Estimating cost effectiveness using the change in NHS costs and intervention costs only (without any societal costs).
Analysing results from a social care perspective.
Estimating cost effectiveness using the change in social care and intervention costs only (without any NHS costs).
Including social care costs and productivity.
Adding an economic estimate of changes to productivity arising from the intervention.
Including all wider societal costs. Including an economic estimate of
the intervention on all wider societal costs (including productivity and social care costs).
Using a discount rate of 3.5%. Changing the discount rate for costs
and outcomes from 1.5 to 3.5%.
No disease costs estimated for diseases not explicitly modelled by PRIMEtime CE (unrelated disease costs).
Removing from the model any NHS and social care costs estimated to accrue due to diseases that are not explicitly modelled by PRIMEtime CE.
No cancer included in the model Cancer removed from the model so
that only IHD, stroke, type two diabetes, and liver cirrhosis are included.
Only including diseases directly related to the risk factor affected.
utilities and costs due to differences occurring between two diseases existing in two separate individuals or being co-morbid within the same individual. To help counter this limitation, PRIMEtime CE has been developed such that there is a dynamic relationship between type two diabetes and cardiovascular disease (an increase in diabetes prevalence increases the risk of the modelled cohort developing IHD and stroke, and the relative risk of IHD and stroke incidence due to changes in BMI or physical activity is adjusted to prevent double counting due to a concomitant rise in diabetes). However, this adjustment does not occur for other diseases which, de-pending on the intervention simulated, may over- or under-estimate the resulting cost per QALY. Secondly, no interactions between individuals within the population or between the population and its environment are simu-lated. Including these interactions requires data on their effects and would generate more uncertainty in model re-sults, but conversely it may also mean the model better represents reality and is more accurate. Thirdly, PRIME-time CE only models the effect of changing a risk factor on disease incidence and not case fatality rates. If sim-ulated interventions lead to reductions in case fatality rates, the model may under-estimate health and cost outcomes arising from increased longevity (both for mod-elled and unrelated diseases).
Further limitations are introduced through using NHS England programme budgeting data to estimate disease costs where miscoding of NHS England expenditure may mean that some annual disease costs are over-estimated, and others underestimated. It is not possible to quantify any misallocation of costs, however the effect on outcomes will be limited by the fact that the majority - 78% - of the NHS England budget is accounted for through disease specific programme budget categories. Disease costs are also only estimated per prevalent case whereas in reality costs vary by time since diagnosis and proximity to end of life. This is a limitation of using a top-down method for estimating costs that may over- or under-estimate total costs, particularly where there are changes to case fatality rates. Further details on the limitations of the costing methods, as well as the PRI-MEtime model and social care costing can be found elsewhere [31,79,85].
Finally, there are limitations of the utility decrements estimated by Sullivan et al [80]. In particular, EQ-5D data are sampled from a 2000–2003 US population rather than a more recent UK population; and individ-uals at very early or late stages of their disease are likely to be under-represented due to being too unwell or unwilling to participate meaning disease specific utility decrements might under-estimate the true average re-duction in quality of life. The systematic review of breast cancer utilities provides some reassurance that the
values reported by Sullivan et al. are reasonable esti-mates. Furthermore, baseline age and sex utility values are derived based on all diseases in the population rather than only unrelated diseases (those not explicitly modelled by PRIMEtime CE). Therefore, utility de-crements that accrue due to increased longevity follow-ing an intervention may over-estimate the true utility decrement. However, the effect of this on model results is limited due to discounting and the relatively smaller pro-portion of the modelled cohort living to old age.
Future intended developments of PRIMEtime CE are to include further testing of the model’s validity [93] and to expand PRIMEtime CE’s scope. This may include consideration of how the model can be used to quantify the effects of policies on inequalities; the addition of further behavioural risk factors such as alcohol and to-bacco, and the use of drugs in primary prevention; how the model can be made more user-friendly by the devel-opment of non-technical interface; and whether results can be quantified at the local authority level.
Conclusions
In this paper we describe PRIMEtime CE, a model that allows public health policies affecting multiple diseases to be directly compared with one another through using the same methods to estimate the effect of changing a risk factor on a disease outcome, disease costs, and disease morbidity. We intend that future work will expand the model’s policy relevance through developing the range of risk factors and outcomes simulated.
Additional file
Additional file 1:Results of the validation of Sullivan et al. utility values, and protocol for systematic review of breast cancer utility values. (DOCX 67 kb)
Abbreviations
APS:Active People Survey; BMI: Body mass index; HTA: Health technology
assessment; IHD: Ischaemic heart disease; ISPOR-SMDM: International Society for Pharmacoeconomics and Outcomes Research-Society for Medical Deci-sion Making; MET: Metabolic equivalent of task; NCDs: Non-communicable diseases; NDNS: National Diet and Nutrition Survey; NHS: National Health Service; NICE: National Institute for Health and Care Excellence; QALY: Quality adjusted life year; UI: Uncertainty interval; WHO: World Health Organization
Acknowledgements Not applicable.
Authors’contributions
ADMB and PS conceptualised the work; ADMB, LC, JW and PS contributed to the methodology and validation; and ADMB conducted the formal analyses. ADMB prepared the original draft and ADMB, LC, JW and PS have read, reviewed, and edited subsequent drafts. All authors have approved the manuscript.
Funding
supported by the NIHR Biomedical Research Centre at Oxford. No other specific funding was used for this work. The funders had no role in study design, data collection and analysis, decision to publish, or preparation of the manuscript.
Availability of data and materials
Datasets used and analysed in this study are publicly available and are either reported in the additional data file or are listed with appropriate references. This with the exception of specialised services expenditure data supplied to the corresponding author by NHS England which the corresponding author does not have permission to share. These data can be made available with permission from both the corresponding author and NHS England. All other data used or generated by the study are available from the corresponding author on request.
Ethics approval and consent to participate Not applicable.
Consent for publication Not applicable.
Competing interests
The authors declare that they have no competing interests.
Author details
1Centre on Population Approaches for Non-Communicable Disease
Prevention and NIHR Biomedical Research Centre at Oxford, Nuffield Department of Population Health, University of Oxford, Old Road Campus,
Headington, Oxford OX3 7LF, UK.2Health Economics Research Centre,
Nuffield Department of Population Health, University of Oxford, Oxford, UK.
Received: 17 April 2018 Accepted: 10 June 2019
References
1. Institute for Health Metrics and Evaluation (IHME). GBD Compare Data
Visualization. 2019.https://vizhub.healthdata.org/gbd-compare/. Accessed
27 Feb 2019.
2. World Health Organization Regional Office for Europe. The case for
investing in public health. Copenhagen; 2014.http://www.euro.who.int/__
data/assets/pdf_file/0009/278073/Case-Investing-Public-Health.pdf
3. Owen L, Morgan A, Fischer A, Ellis S, Hoy A, Kelly MP. The cost-effectiveness
of public health interventions. J Public Health (Oxf). 2012;34:37–45.https://
doi.org/10.1093/pubmed/fdr075.
4. World Health Organization. Interventions on diet and physical activity: what
works: summary report. Geneva; 2009.http://www.who.int/
dietphysicalactivity/summary-report-09.pdf
5. NHS England. The NHS Long Term Plan. London: NHS England; 2019.
6. Department of Health and Social Care. Prevention is better than cure: our
vision to health you live well for longer. London: Department of Health and Social Care; 2018.
7. UK Government. Health and Social Care Act 2012 c.7. 2012.http://www.
legislation.gov.uk/ukpga/2012/7/contents/enacted.
8. Local Government Association. Future funding outlook for councils 2019/20.
Interim 2015 update. London; 2015.https://www.local.gov.uk/sites/default/
files/documents/future-funding-outlook-co-18b.pdf
9. House of Commons Health Committee. Public health post-2013. London;
2016.https://www.publications.parliament.uk/pa/cm201617/cmselect/
cmhealth/140/14002.htm?utm_source=140&utm_medium=fullbullet&utm_ campaign=modulereports
10. van Gils PF, Tariq L, Verschuuren M, van den Berg M. Cost-effectiveness
research on preventive interventions: a survey of the publications in 2008.
Eur J Pub Health. 2011;21:260–4.
11. Masters R, Anwar E, Collins B, Cookson R, Capewell S. Return on investment
of public health interventions: a systematic review. J Epidemiol Community
Health. 2017;71:827–34.https://doi.org/10.1136/jech-2016-208141.
12. Caro JJ, Briggs AH, Siebert U, Kuntz KM. Modeling good research
practices-overview: a report of the ISPOR-SMDM modeling good research practices task
Force-1. Value Health. 2012;15:796–803.https://doi.org/10.1016/j.jval.2012.06.012.
13. National Institute for Health and Care Excellence. Developing NICE guidelines:
the manual. London; 2014.https://www.nice.org.uk/media/default/about/
what-we-do/our-programmes/developing-nice-guidelines-the-manual.pdf
14. Marsh K, Phillips CJ, Fordham R, Bertranou E, Hale J. Estimating
cost-effectiveness in public health: a summary of modelling and valuation methods. Heal Econ Rev. 2012;2:17.
15. Weatherly H, Drummond M, Claxton K, Cookson R, Ferguson B, Godfrey C,
et al. Methods for assessing the cost-effectiveness of public health interventions: key challenges and recommendations. Health Policy. 2009;93: 85–92.https://doi.org/10.1016/j.healthpol.2009.07.012.
16. Walker S, Griffin S, Asaria M, Tsuchiya A, Sculpher M. Striving for a societal
perspective: a framework for economic evaluations when costs and effects fall on multiple sectors and decision makers. Appl Health Econ Health
Policy. 2019.https://doi.org/10.1007/s40258-019-00481-8.
17. Drummond M, Weatherly H, Claxton K, Cookson R, Ferguson B, Godfrey C,
et al. Assessing the challenges of applying standard methods of economic
evaluation to public health interventions. York; 2007.http://phrc.lshtm.ac.uk/
papers/PHRC_D1-05_Final_Report.pdf
18. Edwards RT, Charles JM, Lloyd-Williams H. Public health economics: a
systematic review of guidance for the economic evaluation of public health interventions and discussion of key methodological issues. BMC Public
Health. 2013;13:1001.https://doi.org/10.1186/1471-2458-13-1001.
19. Payne K, McAllister M, Davies LM. Valuing the economic benefits of
complex interventions: when maximising health is not sufficient. Health
Econ. 2013;22:258–71.https://doi.org/10.1002/hec.2795.
20. Kelly MP, McDaid D, Ludbrook A, Powell J. Economic appraisal of public
health interventions. London; 2005.http://citeseerx.ist.psu.edu/viewdoc/
download?doi=10.1.1.476.3820&rep=rep1&type=pdf
21. Shiell A, Hawe P, Gold L. Complex interventions or complex systems?
Implications for health economic evaluation. BMJ. 2008;336:1281–3.https://
doi.org/10.1136/bmj.39569.510521.AD.
22. Cooper K, Brailsford SC, Davies R. Choice of modelling technique for
evaluating health care interventions. J Oper Res Soc. 2007;58:168–76.
https://doi.org/10.1057/palgrave.jors.2602230.
23. Squires H, Chilcott J, Akehurst R, Burr J, Kelly MP. A systematic literature
review of the key challenges for developing the structure of public health
economic models. Int J Public Health. 2016;61:289–98.https://doi.org/10.1
007/s00038-015-0775-7.
24. Briggs ADM, Wolstenholme J, Blakely T, Scarborough P. Choosing an
epidemiological model structure for the economic evaluation of non-communicable disease public health interventions. Popul Health Metrics.
2016;14:17.https://doi.org/10.1186/s12963-016-0085-1.
25. Kaltenthaler E, Tappenden P, Paisley S, Squires H. NICE DSU technical
support document 13: Idenfitfying and reviewing evidence to inform the conceptualisation and population of cost-effectiveness models. Sheffield: National Institute for Health and Care Excellence (NICE); 2011.
26. Kelly M, Morgan A, Ellis S, Younger T, Huntley J, Swann C. Evidence based
public health: a review of the experience of the National Institute of health and clinical excellence (NICE) of developing public health guidance in
England. Soc Sci Med. 2010;71:1056–62.https://doi.org/10.1016/j.
socscimed.2010.06.032.
27. Palmer AJ, Clarke P, Gray A, Leal J, Lloyd A, Grant D, et al. Computer
modeling of diabetes and its complications: a report on the fifth Mount
Hood challenge meeting. Value Health. 2013;16:670–85.https://doi.org/10.1
016/j.jval.2013.01.002.
28. Hoogendoorn M, Feenstra TL, Asukai Y, Briggs AH, Hansen RN, Leidl R,
et al. External validation of health economic decision models for chronic obstructive pulmonary disease (COPD): report of the third
COPD modeling meeting. Value Health. 2017;20:397–403.https://doi.
org/10.1016/j.jval.2016.10.016.
29. Mandelblatt JS, Stout NK, Schechter CB, van den Broek JJ, Miglioretti DL,
Krapcho M, et al. Collaborative modeling of the benefits and harms associated with different U.S. breast Cancer screening strategies. Ann Intern
Med. 2016;164:215–25.https://doi.org/10.7326/M15-1536.
30. Scarborough P, Harrington RA, Mizdrak A, Zhou LM, Doherty A,
Scarborough P, et al. The preventable Risk integrated ModEl and its use to estimate the health impact of public health policy scenarios. Scientifica
(Cairo). 2014;2014:748750.https://doi.org/10.1155/2014/748750.
31. Cobiac LJ, Scarborough P, Kaur A, Rayner M. The Eatwell guide: modelling
the health implications of incorporating new sugar and fibre guidelines.
PLoS One. 2016;11:e0167859.https://doi.org/10.1371/journal.pone.0167859.
32. Cobiac LJ, Vos T, Veerman JL. Cost-effectiveness of interventions to promote
fruit and vegetable consumption. PLoS One. 2010;5:e14148.https://doi.org/1
33. Cobiac LJ, Vos T, Barendregt JJ. Cost-effectiveness of interventions to promote physical activity: a modelling study. PLoS Med. 2009;6:e1000110. https://doi.org/10.1371/journal.pmed.1000110.
34. Blakely T, Cobiac LJ, Cleghorn CL, Pearson AL, van der Deen FS, Kvizhinadze
G, et al. Health, health inequality, and cost impacts of annual increases in tobacco tax: multistate life table modeling in New Zealand. PLoS Med. 2015;
12:e1001856.https://doi.org/10.1371/journal.pmed.1001856.
35. Barendregt JJ. EpiGearXL. 2016.http://www.epigear.com/Products/
EpigearXL/epigearxl.html.
36. Barendregt JJ. Ersatz. 2016.http://www.epigear.com/index_files/ersatz.html.
37. Microsoft. Microsoft Excel. 2013.
38. Smolina K, Wright FL, Rayner M, Goldacre MJ. Incidence and 30-day case
fatality for acute myocardial infarction in England in 2010: national-linked
database study. Eur J Pub Health. 2012;22:848–53.https://doi.org/10.1093/
eurpub/ckr196.
39. Rothwell PM, Coull AJ, Silver LE, Fairhead JF, Giles MF, Lovelock CE, et al.
Population-based study of event-rate, incidence, case fatality, and mortality for all acute vascular events in all arterial territories (Oxford vascular study).
Lancet. 2005;366:1773–83.https://doi.org/10.1016/S0140-6736(05)67702-1.
40. Office for National Statistics. Mortality in England and Wales. London; 2015.
https://www.ons.gov.uk/peoplepopulationandcommunity/ birthsdeathsandmarriages/deaths/datasets/
deathregistrationssummarytablesenglandandwalesreferencetables
41. World Health Organization. DisMod II. 2014.http://www.epigear.com/index_
files/dismod_ii.html.
42. Lee S, Shafe ACE, Cowie MR. UK stroke incidence, mortality and
cardiovascular risk management 1999-2008: time-trend analysis from the
general practice research database. BMJ Open. 2011;1:e000269.https://doi.
org/10.1136/bmjopen-2011-000269.
43. Holden SH, Barnett AH, Peters JR, Jenkins-Jones S, Poole CD, Morgan CL, et al.
The incidence of type 2 diabetes in the United Kingdom from 1991 to 2010.
Diabetes Obes Metab. 2013;15:844–52.https://doi.org/10.1111/dom.12123.
44. Health and Social Care Information Centre. National Diabetes Audit 2011–
12. London; 2013.https://webarchive.nationalarchives.gov.uk/201803072
01242/http://digital.nhs.uk/catalogue/PUB12421
45. Ratib S, West J, Crooks CJ, Fleming KM. Diagnosis of liver cirrhosis in
England, a cohort study, 1998-2009: a comparison with cancer. Am J
Gastroenterol. 2014;109:190–8.https://doi.org/10.1038/ajg.2013.405.
46. Office for National Statistics. Cancer registration statistics, England: 2012.
London; 2014.https://www.ons.gov.uk/peoplepopulationandcommunity/
healthandsocialcare/conditionsanddiseases/bulletins/ cancerregistrationstatisticsengland/2014-06-19
47. Salomon JA, Murray CJL. The epidemiologic transition revisited:
compositional models for causes of death by age and sex. Popul Dev Rev.
2002;28:205–28.https://doi.org/10.1111/j.1728-4457.2002.00205.x.
48. Mathers CD, Loncar D. Projections of global mortality and burden of disease
from 2002 to 2030. PLoS Med. 2006;3:e442.https://doi.org/10.1371/journal.
pmed.0030442.
49. NatCen Social Research, MRC Human Nutrition Research, University College
London Medical School. National Diet and nutrition survey years 1-4, 2008/
09-2011/12. [data collection]. 7th ed; 2015.
https://doi.org/10.5255/UKDA-SN-6533-6.
50. Lim SS, Vos T, Flaxman AD, Danaei G, Shibuya K, Adair-Rohani H, et al.
A comparative risk assessment of burden of disease and injury attributable to 67 risk factors and risk factor clusters in 21 regions, 1990-2010: a systematic analysis for the global burden of disease study
2010. Lancet. 2012;380:2224–60.
51. Dauchet L, Amouyel P, Hercberg S, Dallongeville J. Fruit and vegetable
consumption and risk of coronary heart disease: a meta-analysis of cohort
studies. J Nutr. 2006;136:2588–93.
52. Dauchet L, Amouyel P, Dallongeville J. Fruit and vegetable consumption and
risk of stroke: a meta-analysis of cohort studies. Neurology. 2005;65:1193–7.
53. Vieira AR, Abar L, Vingeliene S, Chan DSM, Aune D, Navarro-Rosenblatt D, et
al. Fruits, vegetables and lung cancer risk: a systematic review and
meta-analysis. Ann Oncol. 2016;27:81–96.https://doi.org/10.1093/annonc/mdv381.
54. Threapleton DE, Greenwood DC, Evans CEL, Cleghorn CL, Nykjaer C,
Woodhead C, et al. Dietary fibre intake and risk of cardiovascular disease:
systematic review and meta-analysis. BMJ. 2013;347:f6879.https://doi.org/1
0.1136/bmj.f6879.
55. Aune D, Chan DSM, Greenwood DC, Vieira AR, Rosenblatt DAN, Vieira R, et
al. Dietary fiber and breast cancer risk: a systematic review and
meta-analysis of prospective studies. Ann Oncol. 2012;23:1394–402.https://doi.
org/10.1093/annonc/mdr589.
56. Aune D, Chan DSM, Lau R, Vieira R, Greenwood DC, Kampman E, et al.
Dietary fibre, whole grains, and risk of colorectal cancer: systematic review and dose-response meta-analysis of prospective studies. Br Med J. 2011;343:d6617.
57. Zhang Z, Xu G, Ma M, Yang J, Liu X. Dietary fiber intake reduces risk for
gastric cancer: a meta-analysis. Gastroenterology. 2013;145:113–120.e3.
https://doi.org/10.1053/j.gastro.2013.04.001.
58. Aune D, Chan DSM, Vieira AR, Navarro Rosenblatt DA, Vieira R, Greenwood
DC, et al. Red and processed meat intake and risk of colorectal adenomas: a systematic review and meta-analysis of epidemiological studies. Cancer
Causes Control. 2013;24:611–27.https://doi.org/10.1007/s10552-012-0139-z.
59. Song P, Lu M, Yin Q, Wu L, Zhang D, Fu B, et al. Red meat consumption
and stomach cancer risk: a meta-analysis. J Cancer Res Clin Oncol. 2014;140: 979–92.https://doi.org/10.1007/s00432-014-1637-z.
60. Aune D, Ursin G, Veierød MB. Meat consumption and the risk of type 2
diabetes: a systematic review and meta-analysis of cohort studies.
Diabetologia. 2009;52:2277–87.https://doi.org/10.1007/s00125-009-1481-x.
61. Danaei G, Ding EL, Mozaffarian D, Taylor B, Rehm J, Murray CJL, et al. The
preventable causes of death in the United States: comparative risk assessment of dietary, lifestyle, and metabolic risk factors. PLoS Med. 2009;6:
e1000058.https://doi.org/10.1371/journal.pmed.1000058.
62. Prospective Studies Collaboration, Lewington S, Whitlock G, Clarke R,
Sherliker P, Emberson J, et al. Blood cholesterol and vascular mortality by age, sex, and blood pressure: a meta-analysis of individual data from 61
prospective studies with 55,000 vascular deaths. Lancet. 2007;370:1829–39.
https://doi.org/10.1016/S0140-6736(07)61778-4.
63. Lewington S, Clarke R, Qizilbash N, Peto R, Collins R. Prospective studies
collaboration. Age-specific relevance of usual blood pressure to vascular mortality: a meta-analysis of individual data for one million adults in 61
prospective studies. Lancet. 2002;360:1903–13.
64. Prospective Studies Collaboration, Whitlock G, Lewington S, Sherliker P,
Clarke R, Emberson J, et al. Body-mass index and cause-specific mortality in 900 000 adults: collaborative analyses of 57 prospective studies. Lancet.
2009;373:1083–96.https://doi.org/10.1016/S0140-6736(09)60318-4.
65. Norat T, Aune D, Vieira AR, Chan D, Navarro Rosenblatt D, Vieira R. The
associations between food, nutrition and physical activity and the Risk of pancreatic Cancer. In: WCRF/AICR systematic literature review continuous
update project report. London; 2011.http://www.wcrf.org/sites/default/files/
SLR_pancreatic_cancer_2011.pdf.
66. Peters SAE, Huxley RR, Woodward M. Diabetes as risk factor for incident
coronary heart disease in women compared with men: a systematic review and meta-analysis of 64 cohorts including 858,507 individuals and 28,203
coronary events. Diabetologia. 2014;57:1542–51.https://doi.org/10.1007/
s00125-014-3260-6.
67. Peters SAE, Huxley RR, Woodward M. Diabetes as a risk factor for stroke in
women compared with men: a systematic review and meta-analysis of 64 cohorts, including 775 385 individuals and 12 539 strokes. Lancet. 2014;383: 1973–80.https://doi.org/10.1016/S0140-6736(14)60040-4.
68. Sport England. Active people survey, 2010–2011; 2013.https://doi.org/1
0.5255/UKDA-SN-7138-3.
69. Wahid A, Manek N, Nichols M, Kelly P, Foster C, Webster P, et al. Quantifying
the association between physical activity and cardiovascular disease and diabetes: a systematic review and meta-analysis. J Am Heart Assoc. 2016;5:
e002495.https://doi.org/10.1161/JAHA.115.002495.
70. Wahid A, Manek N, Nichols M, Kelly P, Foster C, Webster P, et al. Quantifying
the association between physical activity and cancer: a systematic review and meta-analysis. 2016.
71. Clarke R, Frost C, Collins R, Appleby F, Peto R. Dietary lipids and blood
cholesterol: quantitative meta-analysis of metabolic ward studies. BMJ.
1997;314:112–7.
72. He FJ, Li J, MacGregor GA. Effect of longer term modest salt reduction on
blood pressure: Cochrane systematic review and meta-analysis of
randomised trials. BMJ. 2013;346:f1325.https://doi.org/10.1136/bmj.f1325.
73. Christiansen E, Garby L. Prediction of body weight changes caused by
changes in energy balance. Eur J Clin Investig. 2002;32:826–30.
74. GBD 2013 Risk Factors Collaborators, Forouzanfar MH, Alexander L,
Anderson HR, Bachman VF, Biryukov S, et al. Global, regional, and national comparative risk assessment of 79 behavioural, environmental and