An Analytical Method to Find the Optimal
Parameters for Gas Detectors based on Correlation
Spectroscopy using a Fabry-Perot Interferometer.
Everardo Vargas-Rodríguez, and Harvey N. Rutt Optoelectronics Research Centre, University of Southampton, Bldg. B47, Highfield Campus, SO17 1BJ, Southampton, United Kingdom..
fax: +44 (0) 2380593149, email: [email protected]
Abstract
Several designs of infrared sensors use a Fabry-Perot Interferometer (FPI) to modulate the incident light. In this work we analyse the particular case where the FPI fringes are matched with very well defined ro-vibrational absorption lines of a target molecule such as CO2, CO, N2O, or CH4. In this kind of sensor modulation is induced by scanning the FPI cavity length over one half of the reference wavelength. Here we present an analytical method based on the Fourier transform which simplifies the procedure to determine the sensor response. Furthermore, this method provides a simple solution to finding the optimal FPI cavity length and mirror reflectivity. It is shown that FPI mirrors with surprisingly low reflectivity (<50%) are generally the optimum choice for target gases at atmospheric pressure. Finally experimental measurements and simulation results are presented.
1 Introduction
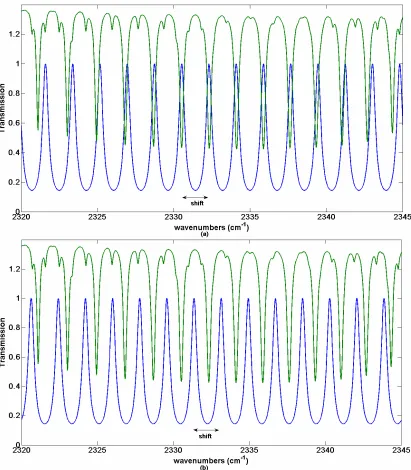
Detectors based on correlation spectroscopy that use a Fabry-Perot Interferometer (FPI) as a modulator are appropriate for detection of molecules with very well defined ro-vibrational absorption lines with pressure-broadened Lorentzian line shapes.1-6 These lines are characteristic of most diatomic and linear molecules, i.e. CO2, CO, N2O, and some specific absorptions bands of symmetric top and spherical top molecules, i.e. NH3, CH4 at one atmosphere pressure. In these sensors the modulation is induced, firstly, by matching the FPI’s fringes with the ro-vibrational absorption lines of the target molecule (Fig. 1a), and then by scanning the cavity length over one half of the reference wavelength . This scan produces a shift of the FPI’s fringes along the wavenumber axis (Fig. 1b) producing a transmission change through the system, and therefore producing an intensity modulation. The integrated transmission through the system at normal incidence is given by
(1)
where is the frequency expressed in wavenumbers (1/cm),
difference between the maximum and the minimum values of which can be expressed as
(2)
It is clear that the sensor response depends on several parameters which increase the complexity of the sensor design. Optimum sensor design requires us to have the maximum possible amplitude modulation when the target gas is present, ie when . But it also requires the minimum amplitude modulation when the target gas concentration is zero, that is when , which we refer to as background modulation. High levels of background modulation are extremely undesirable, as any instability in this value limits the minimum detectable gas concentration. The simplest way to find the optimum values for , , and is by direct numerical evaluation of equation (1). Here, the parameter values are changed simultaneously looking for a combination that provides the best compromise between the minimum background modulation and the maximum amplitude modulation. However, whilst this method is very simple to implement it is time consuming since it takes a long time to compute all the possible parameter values combinations
( , , and ). Furthermore the same procedure must
comparison with the direct numerical evaluation of equation (1). Moreover it is shown that using this method the optimum optical thickness of the FPI can be easily determined. This method also simplifies the procedure to find the optimum value. Furthermore, it is shown that if the modulated sensor signal will be recovered by a Phase Sensitive Detector (PSD, also known as a lock-in amplifier) the optimum value is 0.41 regardless of the target gas.
2 System Response described as a convolution
As was stated above, to induce modulation the FPI’s fringes are shifted along the wavenumber axis by scanning the FPI cavity length. A cavity length scan within the range produces a shift in the FPI fringes equivalent to one Free Spectral Range (FSR) which is the spectral separation between two consecutive FPI fringes.8 As the FPI’s fringe position is shifted along the wavenumber axis due to the cavity length scan therefore it is convenient to make a variable change in Eq. (1) as follows:
(3)
As the filter transmission , the transmission through the gas pathlength , and the source profile do not change while the cavity length is varied it is possible to express the product of these functions as
(4)
(5)
Now, considering that the shape and the symmetry of the FPI’s fringes do not change when they are shifted by one Free Spectral Range (FSR) equation Eq. (4) can be rewritten as
(6)
Therefore the system response expressed by equation (1) can be reduced and expressed as equation (6) which has the form of
(7)
which is the definition of the convolution function. Therefore, the system can be solved in a very simple way by using the Fourier transform properties. It is important to recall that the Fourier transform of a convolution is given by
(8)
Therefore, the Fourier transform of Eq. (6) can be expressed as
(9)
Fourier transform of the functions involved in Eq. (9) and using these characteristics we develop our approach to determine the optimum parameter values.
3 Fourier transforms characterization of the system
functions.
In this section will be show that the optimal parameters nd, and R can be obtained using the characteristics of the Fourier transforms of the system functions
and . Consequently, the detector will be optimized for the filter shape, for the source and for the ro-vibrational absorption lines of the target gas.
3.1 Fourier transform of the FPI’s fringe transmission pattern
For simplicity we will start by analysing the Fourier transform of the FPI’s transmission fringe pattern described by the Airy formula.9 Here, for clarity it is convenient to use the Fourier series expansion of the Airy function10
(10)
, the third harmonic of , and so on. Moreover, the amplitudes of these cosine functions are given by
(11)
Therefore the Fourier transform of the Airy function consists in a set of impulses centred at ‘frequencies’ and magnitude , which can be expressed as
(12)
For instance consider a FPI to be used for detecting CO2 at 4.3 μm with a mirror reflectivity and a cavity length cm, whose transmittance is shown in Figure 2a, and its Fourier transform is shown in Figure 2b. Here it is possible to observe in the Fourier transform spectrum that the first impulse occurs at
cm, with . From Eqs. (11 and 12) we see that the position of the impulses in Fourier due to the FPI fringes depends directly on the optical thickness value and their magnitude depends directly on the reflectivity .
3.2 Fourier Transform characteristics of the
function, and the
optimum nd parameter value.
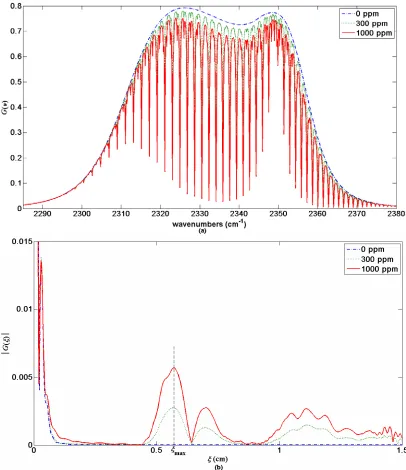
ppm. The Fourier transform of the spectrum is shown in figure 3b where some side-lobes at certain frequencies are clearly defined. The side-lobe positions in the Fourier spectrum give information related to the separation of the ro-vibrational absorption lines. The peak value of the first side-lobe represents the effective average line spacing in the band, whilst the width of the peak indicates the degree of variation in line spacing, caused primarily by differing upper and lower state ro-vibrational constants. In figure 3b it is clear how the magnitude of the side-lobes increases with the gas concentration whilst the magnitude for the other frequencies remains very close to zero. Therefore, as the amplitude modulation of the system is described by a convolution, whose Fourier transform is given by Eq. (9), the modulated signal produced by the system will be maximum if we make that the first impulse frequency of coincide with the frequencies where the first side-lobe peak of
occurs. Thus once has been calculated we simply look for the frequency where the largest side-lobe peak of occurs (Fig. 3b). After is found the optimum value for the optical thickness of the FPI can be derived as .
3.3 Evaluation of the amplitude modulation (AM).
The amplitude of the modulated sensor response , can be easily evaluated using our convolution method approach which consists of the following five steps
1. Evaluate the two Fourier transforms and
.
3. To get the system response as a function of the wavenumber shift apply the inverse Fourier transform to the previous product,
.
4. From extract the segment corresponding to
which is equivalent to a cavity length scan . The system response is now in function of the cavity
length scan .
5. Finally to get AM evaluate the difference between the maximum and the
minimum of the system response as .
The main advantage of this convolution method is that it can evaluate the sensor response much faster than the numerical evaluation of Eq. (1). Furthermore, using the Fourier transform characterization of the functions gives a better insight into the system design.
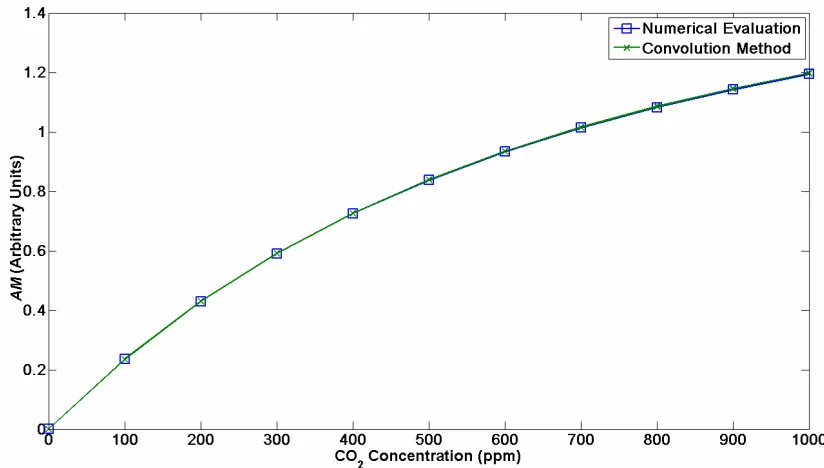
For instance, let us evaluate the amplitude modulation as a function of the concentration for a CO2 gas sensor using the following parameters:
• Ro-vibrational lines of CO2 in the 4.3 μm region. • A fixed gas pathlength of cm;
• a flat source profile ;
• a band pass filter, which is described in figure 3a.
• The FPI has a fixed , and the optical thickness cm. • The gas concentration is varied from 0 to 1000 ppm.
3.4 Evaluation of the optimum value
In order to determine the optimum value of the FPI mirrors reflectivity it is necessary to evaluate the system response considering the possible values of the reflectivity . This can be done easily using the convolution method since here we know the optimum value of the optical thickness , see section 3.2. Therefore evaluation of Eq. (9) for different values of implies that if the gas concentration does not change the function remains constant and only
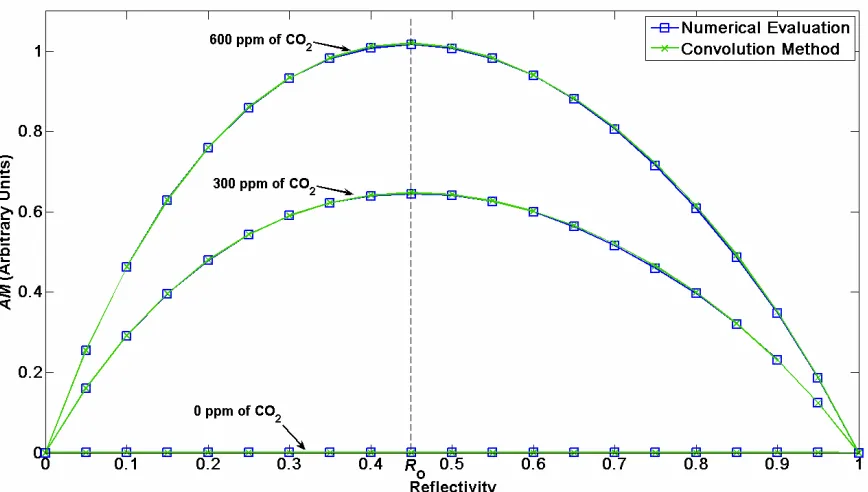
needs to be evaluated for each value, greatly reducing the number of computational operations. In this way is obtained by applying the inverse Fourier transform of Eq. (9) for each value R. A plot showing the amplitude modulation values as a function of the reflectivity obtained using both methods, the convolution method and by direct numerical evaluation of Eq. (1), is presented in figure 5. The results obtained by both method are practically the same and it can be appreciated that for the case with the optimum value is around
where the maximum amplitude modulation is obtained. Additionally from figure 5 it can be seen that FPI mirrors with reflectivity values within the range from to will produce values very close to the optimum. This result relaxes the FPI requirements since it shows that a relatively low reflectivity is required to get the maximum amplitude modulation.
function of the reflectivity are shown in figure 6. Hence if we select a low reflectivity we will have a quasi-sinusoidal FPI fringe pattern of relatively low amplitude, causing a low depth modulation regardless of the high overall power reaching the detector (high DC component). In the other extreme by selecting a relatively high reflectivity the overall power reaching the detector is considerably reduced. Furthermore, for high the higher components of the FPI fringe pattern are more significant, which means that the overall power is distributed between all the components. Hence the amplitude of the fundamental component of the FPI fringe will be low producing a low depth of modulation that in combination with low overall power causes a low sensor response. Therefore the broad, flat maximum peaking of at relatively low reflectivity values is due to the compromise between the depth of modulation and the overall power arriving at the detector.
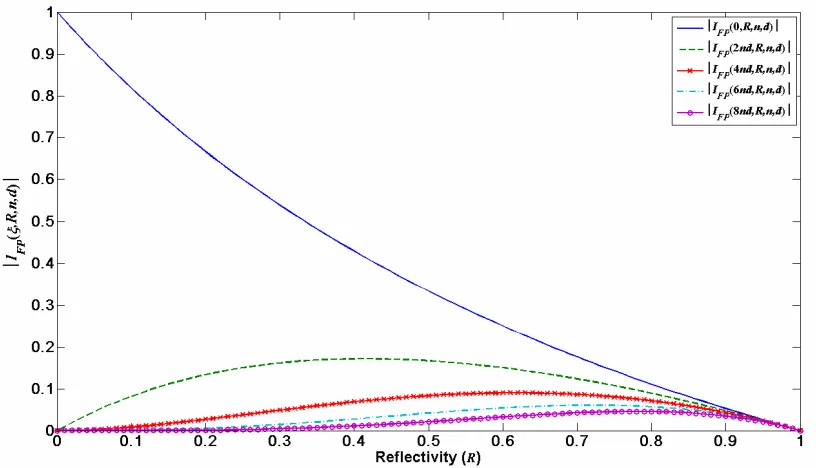
If the system response is recovered by a phase sensitive detector (PSD) just the first harmonic (fundamental) of the modulated signal produced by the detector is retrieved whilst the rest of the harmonics are rejected. The fundamental of depends directly of the first impulse of (Fig. 6). Consequently, to get the maximum for the fundamental we need to get the maximum magnitude possible for the first impulse of . The magnitude of the first impulse of can be expressed as
By differentiation of Eq. (13) we find that the maximum of this function occurs when (Fig. 6). Here with the fundamental component of the FPI fringe pattern has its maximum amplitude (Fig. 6) which maximizes the amplitude of the fundamental component of the sensor response. Therefore when using a PSD to get the maximum amplitude modulation the optimum reflectivity is , independent of the other system parameters.
4 Experimental
results
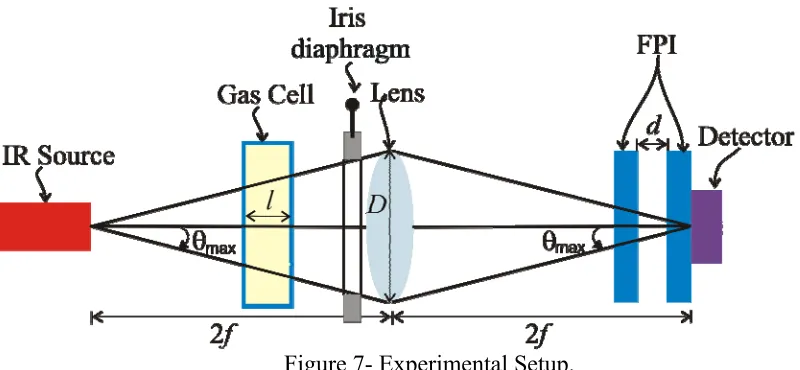
In order to prove our convolution method we constructed a FPI based gas sensor as shown in figure 7, and the results are presented in this section. The FPI fringe pattern considering a blackbody converging source can be evaluated using the following formula:
(14)
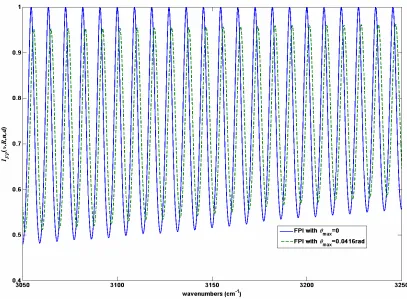
By selecting low values the FPI fringes are only slightly affected by the converging beam and therefore the FPI fringe pattern is similar to the pattern produced by a parallel beam. Hence using a low value will allow us to use directly the convolution method as the shape and the symmetry of the FPI fringes is not seriously affected.
4.1 CH4 Gas Sensor Design
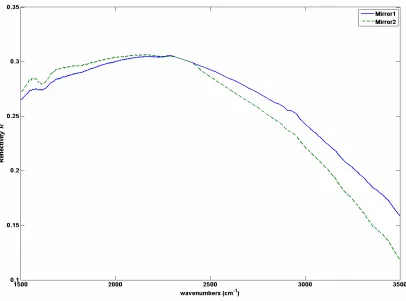
shown in figure 8, measured using a FTIR Perkin Elmer Spectrum GX. These mirrors have a broad reflectivity from 4.7 to 4.2 µm (for CO and CO2) and
at 3 µm where a fundamental band of CH4 occurs. Moreover in this experiment we use CaF2 windows for the gas cell and a 10 cm focal length CaF2 biconvex lens. The iris diaphragm is intended to control the maximum angle of incidence .
For this design the converging cone angle was fixed to rad in order to minimize the effect on the FPI fringe pattern (Fig. 9), here just a small loss in the fringe contrast is observed. We used a band pass filter centred at 3.2 µm where the strongest fundamental band of CH4 occurs. The filter performance is presented in Figure 10a when the CH4 concentration is 0% as . In this experiment we used a gas cell with path length of 1.4 cm, a thermal source IR-12 from Scitec Instruments operated at 1074K, and the LTI Q1 pyroelectric detector from DIAS Infrared Systems.
figure 11, they also show that the optimal optical thickness
obtained by the analysing function is correct. Finally the simulation results and the experimental measurement of as a function of the gas concentration are shown in are shown in Figure 12. The convolution method results were obtained by using the procedure presented in section 3.3 which produces practically the same results as the obtained with by direct evaluation of Eq. (1) but much more rapidly. The measurements are in very good agreement with our simulation results.
5 Conclusions
We have presented an analytical method which helps us to evaluate much faster the response of gas sensors which use a FPI as a modulator. This method also provides a simple solution to determine the optimum parameters and of the FPI. It is shown that relatively low reflectivity values are a good choice for these sensors relaxing the design of the system since FPI mirrors with high are generally very expensive. Furthermore it is shown that if the sensor signal will be recovered with a Phase Sensitivity Detector the optimum mirror reflectivity is , independent of other system parameters.
6 Acknowledgments
7 References
1. J. J. Barrett, and S. A. Myers, "New Interferometric Method for Studying Periodic Spectra Using a Fabry-Perot Interferometer," J. Opt. Soc. Am. B 61(9), 1246-1251 (1971).
2. W. Jin, G. Stewart, B. Culshaw, S. Murray, and D. Pinchbeck, "Absorption measurement of methane gas with a broadband light and interferometric signal processing," Optics Letters 18(16), 1364-1366 (1993).
3. J. P. Dakin, C. A. Wade, D. Pinechbeck, and J. S. Wykes, "A novel fibre methane sensor," Proc. SPIE 734, 254-260 (1987).
4. A. Mohebati, and T. A. King, "Remote detection of gases by diode laser spectroscopy," Journal of Modern Optics 35(3), 319-324 (1988).
5. J. P. Dakin, "Review of Fibre Optic Gas Sensors," in The Plessey Company PLC, (1988).
6. W. Jin, G. Stewart, B. Culshaw, and S. Murray, "Source-noise limitation of fiber-optic methane sensors," Applied Optics 34(13), 2345-2349 (1995).
7. E. Vargas-Rodriguez, and H. N. Rutt, "Method to minimize spurious background signals in gas detectors based on correlation spectroscopy using a Fabry-Perot bandpass filter shape optimization," Optical Engineering 44(10), 103002 (2005).
8. E. Hecht, Optics (Addison Wesley, United States of America, 1998).
Figure Captions
Figure 1 Fabry-Perot fringes and target molecule ro-vibrational absorption lines. a) FPI’s fringes matched with the ro-vibrational lines; b) FPI’s fringes shifted along the wavenumber axis. The ro-vibrational lines are shifted up for clarity.
Figure 2 FPI transmission fringes characteristics and its Fourier transform. a) Transmission fringe profile considering and cm; b) Fourier transform of the FPI fringes.
Figure 3 a) Function profile showing the filter performance and the ro-vibrational absorption lines of CO2 and considering a flat source b) Fourier transform of , here the magnitude of the side-lobes centred at
cm clearly increase with the CO2 concentration.
Figure 4 Amplitude Modulation for a CO2 sensor evaluated using both the direct numerical evaluation of equation (1) and using the convolution method.
Here and cm.
Figure 5 Amplitude modulation as a function of the reflectivity with a constant optical thickness cm. Different CO2 concentrations are shown. Figure 6 Magnitude of the FPI fringes impulses as a function of the reflectivity. Figure 7 Experimental Setup.
Figure 8 Measured FPI Mirror reflectivity.
Figure 9 FPI fringe patterns evaluated for a collimated beam and for a converging beam with rad.
Figure 11 Simulated and Measured Amplitude Modulation values for the CH4 sensor. Here we use and CH4 Concentration of 50%.
Figure 1- Fabry-Perot fringes and target molecule ro-vibrational absorption lines. a)FPI’s fringes matched with the ro-vibrational lines; b) FPI’s fringes shifted along
Figure 2- FPI transmission fringes characteristics and its Fourier transform. a) Transmission fringe profile considering and cm; b) Fourier
Figure 3- a) Function profile showing the filter performance and the ro-vibrational absorption lines of CO2 and considering a flat source b) Fourier transform of , here the magnitude of the side-lobes centred at cm clearly increase
[image:20.595.94.500.85.555.2]Figure 4- Amplitude Modulation for a CO2 sensor evaluated using both the Direct numerical evaluation of equation (1) and using the convolution method. Here