ContentslistsavailableatScienceDirect
International
Journal
of
Greenhouse
Gas
Control
jo u r n al hom e p a g e :w w w . e l s e v i e r . c o m / l o c a t e / i j g g c
The
Effect
of
CO
2
Purity
on
the
Development
of
Pipeline
Networks
for
Carbon
Capture
and
Storage
Schemes
B.
Wetenhall
a,
J.M.
Race
b,∗,
M.J.
Downie
aaSchoolofMarineScienceandTechnology,NewcastleUniversity,Newcastle,NE17RU,UK
bDepartmentofNavalArchitecture,OceanandMarineEngineering,UniversityofStrathclyde,Glasgow,G40LZ,UK
a
r
t
i
c
l
e
i
n
f
o
Articlehistory:
Received14December2013
Receivedinrevisedform8September2014 Accepted17September2014
Availableonline8October2014
Keywords:
CO2pipelines CO2specification Pipelinenetworks Hydraulicmodelling Costanalysis
a
b
s
t
r
a
c
t
Oneofthekeyaspectsrelatingtothetransportationofanthropogeniccarbondioxide(CO2)forclimate
changemitigationaspartofCarbonCaptureandStorage(CCS)schemesisthecompositionoftheCO2
streamtobetransported.Thespecificationofthisstreamhasbothtechnicalandeconomicimplications and,asCCSschemesstarttobecomerealised,therequirementtospecifytheCO2 streamqualityis
becomingmoreimportant.
TheaimofthisworkhasbeentoanalysetheeffectsofthecompositionoftheCO2streamfrom
post-combustion,pre-combustionandoxyfuelcaptureprocessesonthehydraulicnetworkdesignandthe relativecostsofthenetwork.Severalkeyconclusionshavebeendrawntoinformtheprocessofspecifying theCO2purityandtoguidepipelineoperatorsonthespecificationofaCO2stream,fordensephase
pipelineoperation,onthebasisofhydraulicdesign.
Theanalysishasshownthatimpurityadditionsupto2mol%didnotaffecttherelativecost/kmforthe networkswhencomparedtoapureCO2equivalentintermsofthepipelineinternaldiameterandlength.
However,theinletpressuretothenetworkisincreasedforallofthecompositionsstudiedandinthis respect,levelsofhydrogeninparticularshouldbelimitedtolessthan1mol%toreduceinletpressure andtherebycompressioncosts.
Ithasbeendemonstratedthatdirectconnectionpipelinesfromsourcetosinkarethemostexpensive networkoptionshowever,whendesigningapipelinenetwork,thesizeoftheemitters,thephasingof entryintothenetworkandthestabilityofthenetworkintheeventofinterruptionsinflowneedstobe considered.
©2014TheAuthors.PublishedbyElsevierLtd.ThisisanopenaccessarticleundertheCCBYlicense (http://creativecommons.org/licenses/by/3.0/).
1. Introduction
CarbonCaptureandStorage(CCS)isrecognisedasoneofasuite ofsolutions required toreducecarbon dioxide(CO2)emissions
intotheatmosphereandcontributetowardsglobalclimatechange mitigation.InCCSschemes,CO2 is capturedfrompowerplants
orotherlargestationarysourcesandtransportedtoappropriate geological sites either for Enhanced Oil Recovery (EOR) or for storage.Unlessthecaptureandstoragesitesareco-located,allCCS schemeswillinvolvethetransportationofCO2fromthecapture
planttothestoragesiteeitherviaapipelinenetworkorbyship basedtransportation.
OneofthebarrierstotherapidimplementationofCCSisthe highcapitalcostofdemonstrationschemes(BBC,2011).Thereis
∗Correspondingauthor.Tel.:+00441415485709.
E-mailaddress:[email protected](J.M.Race).
thereforeanurgentrequirementtoreducethecostsofCCSinorder
that theimplementationof largescaleCCSschemesbecomes a
moreviableandattractiveoptionpostdemonstration(Sweeney, 2012).StudiesofthecostsofthefullCCSchainindicatethatthe largestcosts(whetherthatbeintermsoftheincreasedcostof elec-tricityorthecostpertonneofcapturedCO2)areassociatedwith
thecaptureprocess(MiddletonandBielicki,2009;Yanetal.,2008; ZEP,2011).However,withinthatchain,thecostoftransportation hastobeconsideredandcostreductionssoughtwherepossible
(GCCSI,2011).
Thecostofthepipelinesystemhasbeenshowntobeprimarily influencedbycapitalexpenditure(CAPEX)andtobeapproximately proportional tothe lengthof the network (ZEP, 2011; Knoope, 2013).Consequently,many studieshave investigatedthe
devel-opment of modelsto provide an optimaldesign for a pipeline
networkthatminimisesthepresentvalueforthecapitaland oper-atingcostsofthesystem(Brunsvoldetal.,2012;Kazmierczaketal.,
2009;Kubyetal.,2010;MiddletonandBielicki,2009;Vandeginste
http://dx.doi.org/10.1016/j.ijggc.2014.09.016
Table1
CompositionrangesforCO2streams(Anhedenetal.,2005;IEAGHG,2011;IPCC,2005;KatherandKownatzki,2011;OosterkampandRamsen,2008).
Component Pre-combustion Post-combustion Oxyfuel
Min Max Min Max Min Max
CO2 vol% 95.6 99.7 99.8 99.97 85 99.94
SOx vol% 0.001 0.01 0.007 2.5
NOx vol% 0.002 0.01 0.01 0.25
H2S vol% 0.01 3.4
CO vol% 0.03 0.4 0.001 0.002
Ar vol% 0.03 1.3 0.003 0.045 0.01 5.7
O2 vol% 0.03 1.3 0.003 0.03 0.01 4.7
N2 vol% 0.03 1.3 0.021 0.17 0.01 7
H2 vol% 0.002 1.7
CH4 vol% 0.035 2 0.01
Hydrocarbons vol% 0.003 0.01
HCN vol% 0.0005
NH3 vol% 0.003 0.005
CH3OH vol% 0.02
andPiessens,2008).MiddletonandBielicki(2009)haveindicated
thattherearesevenparametersthatshouldbeoptimised simulta-neouslyinacomprehensivenetworkmodel;theamountofCO2to
becaptured;thelocationofthesources;therouteofthepipeline; thepipelinedimensions;thelocationofthesinks;theinjection volumeateachsinkandthedistributionoftheCO2inthepipeline
network.Howeveranotherkeyparameterthatneedstobe consid-eredisthepurityoftheCO2.
PreliminarystudieshaveindicatedthatthepurityoftheCO2
has a significant impact on pipeline transport costs
particu-larlyat lowerflowrates andlongerdistances(Yanet al.,2008) and, on this basis, it could be considered to be insufficientto
consider the stream as pure CO2 when conducting hydraulic
calculations. This paper investigates the effect of the purity of
theCO2 onpipelinecapacityandnetworkdevelopmentinmore
detail.
2. EffectOfImpuritiesOnPipelineHydraulics
2.1. CO2PuritySpecifications
AnthropogenicCO2capturedfromapowerplantoranyother
industrialsourcewillcontainnon-CO2componentsoftenreferred
toasimpurities.Theamountandtypeofimpuritiesthatcouldbe presentintheCO2streamfrompowerplantcapturewill
primar-ilybedependentonthecaptureprocess,thecapturetechnology usedandthefuelsource.Inaddition,legislativeandeconomic con-straintswillalsoplayapartindeterminingallowableorachievable levelsofcertainimpurities.Anumberofstudieshavebeen
con-ductedinto thecompositionof theCO2 streams capturedfrom
powerplant(Anheden et al.,2005; IEAGHG, 2011;IPCC, 2005;
Kather and Kownatzki, 2011; Oosterkamp and Ramsen, 2008).
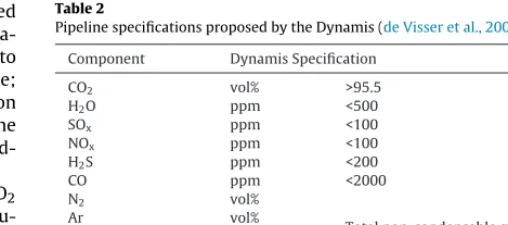
Theresultsof thesestudiesfor differentcaptureprocesses and technologiesaresummarisedinTable1,whichillustratesthata largevariationexistsinthepublishedliteratureregarding poten-tiallevelsofimpuritiesintheCO2streamscaptured.Analternative
approachtodefiningaCO2specificationwastakenbydeVisseretal.
(2008)intheDynamistransportspecification,whichrecommends
CO2puritylevelsbasedontherequirementsofthepipeline.Itis
recognisedthattheDynamisspecificationisnotaCO2composition
andtheuseoftheDynamisstudyfordefiningCO2compositions
mustbeconsideredwithcare(Raceetal.,2012).
IntheDynamisstudy,safetyandtoxicitylimits,infrastructure durabilityandtransportefficiencyareconsideredinthe develop-mentofthespecificationshowninTable2.Thestudypresented inthispaperisrestrictedtotheeffectsofimpuritiesonhydraulic behaviour,althoughitishighlightedthatindeterminingapipeline CO2 stream specification, theeffects on all aspects of pipeline
Table2
PipelinespecificationsproposedbytheDynamis(deVisseretal.,2008). Component DynamisSpecification
CO2 vol% >95.5
H2O ppm <500
SOx ppm <100
NOx ppm <100
H2S ppm <200
CO ppm <2000
N2 vol%
Totalnon-condensablegases<4vol%
Ar vol%
O2 vol%
H2 vol%
CH4 vol% Aquifer<4vol%EOR<2vol%
designand operationmustbeconsidered(Raceetal.,2012).In respectofthehydraulicbehaviouritisinterestingtonotethat,the Dynamisspecificationsetsalimitof4vol%onthenon-condensable componentsofN2,O2,H2,CH4 andArinordertominimisethe
impactonpipelinecapacity,capital costandcompressioncosts.
Yanetal.(2008)havealsostudiedthetechno-economicimpactof
non-condensablesatdifferentlevels(13%,4%and1%byvolume) onthetransportationofCO2fromoxyfuelcapture.Theyconclude
thatthelimitonnon-condensablecomponentsof<4vol%isa rea-sonablepurificationlimitintermsofthecostbalanceoftheCCS chain.However,theyindicatethat,forshortdistancesand,where thestorageconditionspermit,thelevelofnon-condensablescould beraisedto10vol%,althoughlevelsashighasthismayrequire specialattentiontomeetregulatoryrequirements(i.e.healthand safetyconsiderations),basedontheconcentrationoftheindividual impuritiespresent.
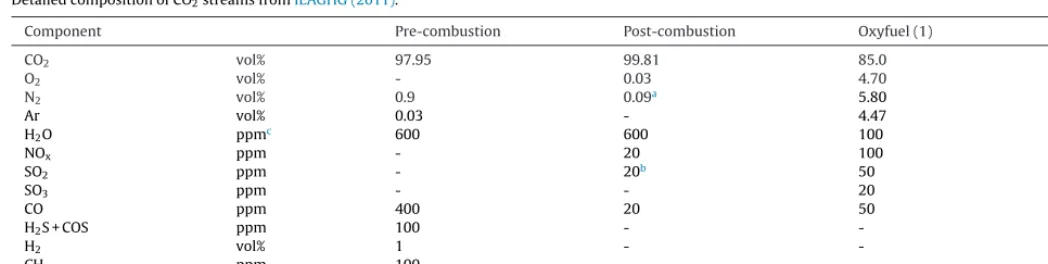
Theindividualcomponentsofthecapturestreamsconsideredin thispaperaretakenfromIEAGHG(2011)andarepresentedindetail
inTable3.Forthenetworkstudy,onepre-combustionstreamand
onepostcombustionstreamwerechosen.Thesestreamsbothhave ahighpercentageofCO2andareconsideredtoberepresentativeof
achievablelevelsofsecondarycomponents.Twooxyfuel composi-tionswerealsochosen,onebeingarelativelypurestream(oxyfuel 2)andtheothercontainingalargerpercentageofimpurities (oxy-fuel1).Thelasttenyearsofdevelopmentinoxyfuelcombustion powerplantswithCO2 capturehaveestablishedthat the
Cryo-genicProcessingUnit(CPU)ofthepowerplantcouldbedesigned todeliverCO2 withcomposition rangingfromaslowas80%to
[image:2.646.34.554.74.221.2] [image:2.646.300.554.256.368.2]Table3
DetailedcompositionofCO2streamsfromIEAGHG(2011).
Component Pre-combustion Post-combustion Oxyfuel(1) Oxyfuel(2)
CO2 vol% 97.95 99.81 85.0 98.0
O2 vol% - 0.03 4.70 0.67
N2 vol% 0.9 0.09a 5.80 0.71
Ar vol% 0.03 - 4.47 0.59
H2O ppmc 600 600 100 100
NOx ppm - 20 100 100
SO2 ppm - 20b 50 50
SO3 ppm - - 20 20
CO ppm 400 20 50 50
H2S+COS ppm 100 - -
-H2 vol% 1 - -
-CH4 ppm 100 - -
-Cricondenbar bara 77.54 73.93 93.26 75.95
aTotalconcentrationofN2+Ar; bTotalconcentrationofSO2+SO3;
c Althoughthelevelsofwaterarequotedhere,waterisnotconsideredinthehydraulicanalysiscalculations.
0 10 20 30 40 50 60 70 80 90
0 5 10 15 20 25 30 35 40
Pure Carbon Dioxide 2% Hydrogen
2% Nitrogen Dioxide 2% Hydrogen Sulphide
Pr
essur
e /bar
Temperature / oC
Fig.1.PhasediagramforbinarycombinationsofCO2and2mol%H2,H2SandNO2(calculatedusingthePengRobinsonequationofstate).
datafromoperationalpowerplantcaptureplants,theyare con-sideredtoberepresentativecompositionsforthepurposesofthis study.
2.2. EffectsofImpuritiesonCO2FluidProperties
TheadditionofimpuritiesintotheCO2streamaffectsseveral
importantparametersintheanalysisofpipelinehydraulics includ-ingthephasebehaviour,density,viscosityandcompressibilityof thefluid.Priortothepresentationofthehydraulicstudy,itis there-foreimportanttounderstandtheinfluenceofdifferentimpurities ontheseCO2propertiesandultimatelyonthedesignofthepipeline
network.
2.2.1. EffectofImpuritiesonPhaseBehaviour
Toillustratetheeffectofimpuritiesonphasebehaviour, con-siderthephasediagramsofFig.1forbinarycombinationsofCO2
with2mol%ofhydrogen(H2),nitrogendioxide(NO2)andhydrogen
sulphide (H2S).Thesecomponentshave beenselectedfor
illus-tration asthey representcomponents that couldbe present in
theCO2 stream(Table1)and theyalsodemonstrateimportant
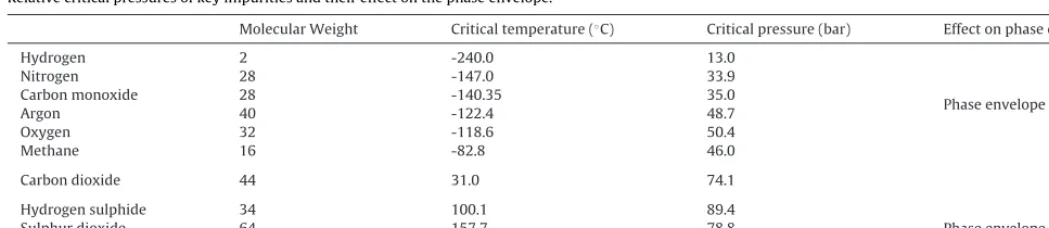
behaviourinthiscontext.Allcomponentswhosecritical tempera-tureandpressureisabovethatofpureCO2willopenupatwo-phase
regionbelow that of pureCO2 (e.g.H2S and NO2).Conversely,
componentswithcriticaltemperaturesandpressuresbelowthose ofpureCO2 willopenupatwo-phaseregionabovethatofpure
CO2.Theeffectofeachofthecomponentsconsideredonthephase
envelopeisillustratedinTable4.Althoughalloftheimpurities raisedthecriticalpressure,atthelevelsstudied,componentswith acriticaltemperaturebelowthatofpureCO2 loweredthe
criti-caltemperatureofthemixturerelativetopureCO2,whilstthose
withahighercriticaltemperaturethanpureCO2raisedthecritical
temperatureofthemixture.
Theseeffectsareimportantasthechangeinphasebehaviour limitstheallowableoperatingregionofthepipeline.CO2is
trans-portedmostefficientlybypipelineasadensephaseorsupercritical liquid1.However it is essential for operating efficiency,and to
preventdamagetocomponentssuchasvalves,pumpsand
com-pressorsthatthefluid remainsina singlephase.Consequently, itisdesirabletomaintainthepressureinthepipelineabovethe cricondenbarofthefluid.Additionsofimpuritieswithcritical tem-peraturesandpressuresbelowCO2willthereforerequirehigher
[image:3.646.41.565.73.205.2] [image:3.646.126.479.251.463.2]Table4
Relativecriticalpressuresofkeyimpuritiesandtheireffectonthephaseenvelope.
MolecularWeight Criticaltemperature(◦C) Criticalpressure(bar) Effectonphaseenvelope
Hydrogen 2 -240.0 13.0
PhaseenvelopeaboveCO2
Nitrogen 28 -147.0 33.9
Carbonmonoxide 28 -140.35 35.0
Argon 40 -122.4 48.7
Oxygen 32 -118.6 50.4
Methane 16 -82.8 46.0
Carbondioxide 44 31.0 74.1
Hydrogensulphide 34 100.1 89.4
PhaseenvelopebelowCO2
Sulphurdioxide 64 157.7 78.8
Nitrogendioxide 46 157.9 101.0
operatingpressurestobespecifiedresultinginincreasedcostsfor compressionandpumping.
2.2.2. EffectofImpuritiesonDensity
Fig.2illustratesthenon-linearrelationshipbetween temper-ature,pressureanddensityforpureCO2.Ingeneral,thedensity
of CO2 decreases with increasing temperature and decreasing
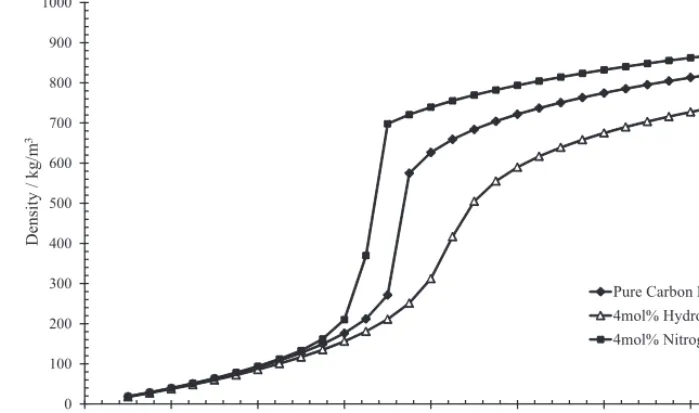
pressure,however,thebehaviourisnon-linear andasharp dis-continuityindensityoccursclosetotheVapour-LiquidEquilibrium (VLE)lineduetothephasechangefromtheliquidtogaseousphase. Inthisregion,smallchangesintemperatureandpressurecanhave largeinfluencesondensity.Theadditionofimpuritiesmovesthe locationofthediscontinuitytohigherpressuresforcomponents withlowercriticaltemperaturesandpressuresthanCO2,andto
lowerpressuresforcomponentswithhighercriticaltemperatures andpressuresthanCO2,asshowninFig.3.Thisbehaviour,and
theeffectonCO2 pipelinetransportation,hasbeendiscussedin
Seevametal.(2007).However,akeyconclusionthatisemphasised
hereisthatloweringtheinlettemperaturewillincreasepipeline capacityasitincreasesthedensityofthefluid.Inaddition,limiting
theamountofcomponentswithlowercriticaltemperaturesand
pressuresthanCO2willalsoimprovepipelinecapacity.
2.2.3. EffectofImpuritiesonViscosity
Ingeneral,theviscosityofthefluidincreaseswithincreasing pressureanddecreasingtemperature.Asharpdiscontinuityin vis-cosityisobservedattheVLEand,intheliquid phase,theeffect oftemperatureonviscosityismoredominantthaninthegaseous
phase(Fig.4).TheimpactofimpuritiesontheviscosityofCO2isalso
illustratedinFig.4.Inthegaseousphase,theviscosityofthefluid isnotsignificantlyaffectedbytheadditionofimpurities.However, inthesupercriticalphase,theviscosityisdramaticallyaffectedby theadditionofimpurities,withanincreaseinviscosityoverpure CO2 observed forcomponentswithhighercritical temperatures
andpressuresthanCO2(e.g.NO2)andadecreaseinviscosityover
pureCO2 observedforcomponentswithlowercritical
tempera-turesandpressuresthanCO2(e.g.H2).Decreasingtheviscositywill
reducetheresistancetoflowofthefluidinthepipeline.
3. ModellingMethodology
Inthisstudy,theeffectsofimpuritieshavebeenstudied,firstly onasinglesourcetosinkpipelinetomodeltheeffectofindividual impuritiesonpipelinediameterandthenonthreenetwork scenar-iostostudytheimpactoftheproductstreamcompositiononthe systemsizeandconfiguration.Thehydraulicmodelling methodol-ogyforbothofthesestudiesisdescribedinthefollowingsections.
3.1. DeterminationofPipelineDiameter
Oneofthefirststagesinthedesignofapipelineistocalculate therequiredinternaldiameterfortheanticipatedflowrate. Sev-eralsimplemodelsfordeterminingtherequiredpipelinediameter exist,manyofwhichformthebasisoftechno-economicmodelsfor CO2 pipelinetransportation(Heddleetal.,2003;Hendriksetal.,
2003;IEA,2002,2005a,b;McCoyandRubin,2007;Ogdenetal.,
0 100 200 300 400 500 600 700 800 900 1000
0 20 40 60 80 100 120 140 160
5degC
30degC
D
en
sity /
kg
/m
3
Pressure /bara
[image:4.646.31.556.74.188.2] [image:4.646.114.469.514.728.2]0 100 200 300 400 500 600 700 800 900 1000
0 20 40 60 80 100 120 140 160
Pure Carbon Dioxide
4mol% Hydrogen
4mol% Nitrogen Dioxide
D
en
sity /
kg
/m
3
Pressure /bara
Fig.3.EffectofimpuritiesonthedensityofCO2forbinarycombinationsofCO2-4mol%H2andCO2-4mol%NO2at30◦C(calculatedusingthePengRobinsonequationof
state).
2004).AreviewofthesesimplemodelsbyGhaziandRace(2012)
recommendedthatdiametercalculationsbasedonfluidmechanics principles(ratherthanmassbalanceequationsorrules-of-thumb) shouldbeusedintechno-economicmodelsastheyrequirefewer initialassumptionstobemade.Althoughthesesimplemodelsare adequatefortherequirementsofinitialpipelinesizingandcosting, detailednetworksizingstudiesrequiretheuseofmore sophisti-catedsteady-statehydraulicmodelswhichaccountfortheeffects ofpressureandtemperaturedropalongthepipelineandthe con-sequentchangeinfluidpropertiesthatresult.
Ingeneral,thecalculationofsteadystatefluidflowinpipelines requiresthesimultaneoussolutionoftheequationsfor
conserva-tionofmass,momentumandenergy.Fromthesolutionofthese
equations,foranyknownfluidcompositionandgiventwoofthe parametersofinitialpressure,finalpressureorflowrate,itis possi-bletocalculatethepressureandtemperaturedropalongapipeline length.Alternatively,aswasconductedinthisstudy,foragiven
outletpressure,required pressuredropandflow rate,itis pos-sibletocalculatetheoptimumpipelinediameter.Thehydraulic
modelling in this studyhasbeen conductedusing the PIPESIM
steady-statemultiphaseflowsimulatorsoftware(Schlumberger, 2010).ThenumericalprocedureemployedinPIPESIMisbasedon themethodoffinitedifferences.Thepipelineisdividedinto seg-mentsandthepressureandtemperaturegradientcalculationsare performedinthedirectionofflowoneachsegmentbasedonthe averagefluidconditionsinthesegment.Avalueoftheunknown parameteris setand iterativelyadjusteduntil theoutputvalue matchesthecalculatedvalue.Onceconvergencehasbeenachieved, thecalculationmovestothenextpipelinesegment.Fig.5presents aflowdiagramforthecalculationsconductedbythePIPESIM soft-ware,indicatingthemodelsthathavebeenselectedforthestudy. TheCO2 physicalandphasepropertieswerecalculatedusing
thesoftwarepackageMultiFlash(Infochem,2011)withthe
Peng-Robinson equation of state (Peng and Robinson, 1976). This
0 20 40 60 80 100 120
0 20 40 60 80 100 120 140 160
Pure Carbon Dioxide (5degC)
4mol% Hydrogen (5degC) 4mol% Nitrogen Dioxide (5degC)
Pure Carbon Dioxide (30degC)
4mol% Hydrogen (30degC)
4mol% Nitrogen Dioxide (30degC)
Vi
sc
os
ity
/
μ
Pa
s
Pressure /bara
[image:5.646.126.476.63.270.2] [image:5.646.123.484.503.718.2]• Equation of State –Density, compressibility enthalpy, heat capacity
• Viscosity model • Thermal conductivity
Mass and momentum balance - Flow equation
Pressure drop Energy balance and heat
transfer calculations
Temperature drop
Simultaneous solution
Fig.5. Flowdiagramindicatingthecalculationsconductedinthehydraulicanalysis.
equationofstatewasselectedasitishasbeenshowntobe suf-ficientlyaccurateforthemixturecompositionsandthepressure andtemperaturerangesexploredinthispaper(LiandYan,2009). Althoughthereislittlepublishedinformationavailableonthe calculationofCO2viscosity,numerouscorrelationsexistfor
calcu-latingtheviscosityinoilandreservoirfluids.Inordertodetermine whetheroneofthesemodelscouldbeextendedtocalculatethe viscosityofdensephaseCO2mixtures,thecalculationsfromtwo
viscositymodelsavailableinPIPESIM,Pedersen(Pedersenetal.,
1984)andLBC(Lohrenzetal.,1964)werecomparedwith
experi-mentaldataforpureCO2publishedbyVanDerGulik(1997).The
resultsarepresentedin Fig.6.On thebasis oftheseresultsthe Pedersenmodelwasselectedasitwasseentoalwaysover-predict theexperimentaldataandthereforewouldbeaworst-case predic-tionforthehydrauliccalculations.
TheflowequationselectedforthisanalysiswastheBeggsand Brillcorrelation(BeggsandBrill,1973)withtheMoodyfriction factor(Moody,1944)asdefinedinBrillandMukherjee(1999).The
BeggsandBrill-Moodymethodhasbeendemonstratedtobe
par-ticularlyapplicableforsingleandmultiphasefluidsandhasbeen usedforthemodellingofotherCO2pipelines(Hein,1985).This
methodalsohastheadvantagethatitcanaccuratelypredictsmall amountsofliquidformation.
ThemethodologyadoptedinPIPESIMtocalculatetheheat trans-fercoefficientbetweenahorizontalburiedpipelineandtheground surfacefollowstheapproachofKreithandBohn(2001)todefine
Table5
OutputfromemittersconsideredinthestudyAMEC(2008).
CO2outputperannum(Mt) IEAtier
Station1 0.60 1
Station2 1.50 0
Station3 1.65 0
Station4 2.03 0
Station5 2.88 0
Station6 2.89 0
Station7 3.12 0
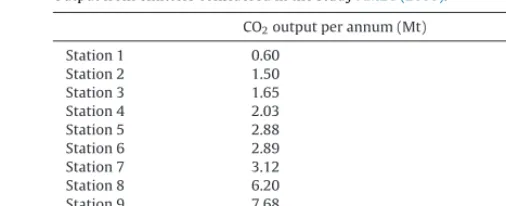
Station8 6.20 0
Station9 7.68 0
Station10 22.37 0
aconductionshapefactor,S,fromwhichthegroundheattransfer coefficient,hg,iscalculatedusingtheequation:
hg=
ks g
R (1)
Where kg=ground thermal conductivity and R=reference length(takentobethepiperadius).
Thesemodelsareusedtocalculatetheheattransferfromoiland gaspipelinesanditisconsideredthatthesamemethodologycan beappliedtoCO2pipelinesasthematerialsandcoatingsusedwill bethesame.
Oncetheoptimuminternaldiametershavebeencalculatedfor each pipeline using the proceduredefined above, the required externaldiameterandwallthicknessiscalculatedusingthethin wallformulaforallowablehoopstressinPD8010-1(2004):
h=p.Do
20.t ≤e.a.SMYS (2)
Where, h=hoop stress (MPa), p=internal pressure (barg),
Do=externaldiameter(mm),t=wallthickness(mm),e=weld
fac-tor(assumedtobe1),a=designfactorandSMYS=theSpecified
MinimumYieldStress(SMYS)inMPa.Forthenetworkscenarios
considered,itwasassumedthatthepipelinewouldbelocatedin aClass1locationasdefinedinPD8010-1(2004)andthereforea designfactorof0.72wasused.
Ingeneral,pipelinesaresuppliedinstandard,discreteranges ofexternaldiameterandwallthickness.Althoughitisrecognised thatacustomercanspecifyanyexternaldiameterandwall thick-ness,BSEN10208-2(2009)indicatesthat,whereappropriate,the
40 50 60 70 80 90 100 110 120
40 50 60 70 80 90 100 110 120
Pedersen (1984)
LBC (1964)
Predicted
Viscosity/
μ
Pa
s
Experimental Viscosity Measurement - Van der Gulik (1984)/ μPa s
[image:6.646.39.275.56.180.2] [image:6.646.301.554.75.178.2] [image:6.646.117.466.517.727.2]1 2
3
4
5
6 7
8
9
10
Terminal P10
P9
P8 P7
P6 P5 P4
P3
P2 P1
Fig.7. SchematicrepresentationoftheCase1pipelinenetwork.
external diameter and wall thickness should be within these
standardranges.Consequently,oncetherequiredexternal
diam-eter and wall thickness have been determined based on the
hydraulicandstressanalysisconstraints,thevalueswereincreased toselectstandarddiametersandwallthicknessesasspecifiedinBS
EN10208-2(2009).
Afinal checkwasthenmadewithrespecttothevelocityof thefluidinthepipelineforthecalculatedflowrateanddiameter. Thiscalculationensuresthatthecalculatedvelocityisnotsoslow thatitwouldaffecttheoperationandmaintenanceofthepipeline andneitherisitsofastthatitcouldcauseerosionofthepipeline.
TochecktheerosionalvelocitytheprocedureoutlinedinAPIRP 14E(1991)forthecalculationoferosionalvelocitywasadopted.In ordertoensurethaterosionisnotathreattothepipeline,theactual velocity mustbeless than theerosionalvelocity.The erosional velocityiscalculatedusingthefollowingequation:
v
e= √Cmix (3)
Wheree=erosionalvelocity(m/s);mix=densityofthefluid
mixture (kg/m3) and C=is anempirical constant as defined in
API14E(1991).ThevalueofCinEquation3hasbeendetermined
1
3
2+4
5
6 7
8
9
10
Terminal P10
P9 P8
P7
P6 P5
P3
P2+4 P1
[image:7.646.87.516.57.299.2] [image:7.646.84.516.480.725.2]Table6
LengthsandflowratesofpipelinesfornetworkCases1-3.
Pipeline Case1(km) Pipeline Case2(km) Case3(km)
Distance(km) Flowrate(MT/yr) Distance(km) Flowrate(MT/yr) Distance(km) Flowrate(MT/yr)
P1 53 0.54 P1 4 0.54 1 0.54
P2 43 1.35 P2&P4 18 3.18 17 3.18
P3 70 1.49 P3 7 1.49 2 1.49
P4 43 1.83 – – –
P5 46 2.59 P5 14 2.59 16 2.59
P6 36 2.60 P6 12 2.60 14 2.60
P7 52 2.81 P7 23 2.81 26 2.81
P8 108 5.58 P8 19 5.58 10 5.58
P9 98 6.91 P9 9 6.91 98 25.70
P10 90 20.13 P10 90 45.83 90 20.13
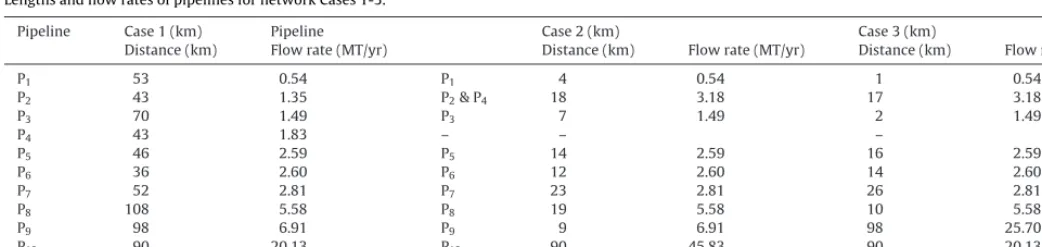
Total 639 45.83 Total 194 45.83 274 45.83
empiricallyfromexperimentsconductedintheoilandgas indus-tryandarangeofvaluesforCareprovidedinAPIRP14E(1991) dependingontheserviceanderosivenatureofthefluid.For solids-free,continuousserviceavalueof122kg/m2sisrecommendedfor C(APIRP14E,1991)andthisvaluehasbeenadoptedforthiswork. AlthoughthisvalueforCisconsideredtobeconservativeintheoil industry(Salama,2000),itisrecognisedthatthereisno compara-bleexperimentaldatabasefromwhichtodetermineanappropriate valueofCforCO2inthegaseousordensephase.
3.2. ModellingAssumptionsandInputData
3.2.1. FluidConditions
AsmentionedpreviouslyinSection2.2.1,itisessentialtoavoid
two-phaseflowin thepipelinenetworkby keepingthesystem
pressureabovethecricondenbarofthefluidfordensephase opera-tion.Consequently,forthisstudy,theminimumoperatingpressure
inthesystemhasbeentakentobe10%abovethecricondenbar
calculatedforthegivenfluid compositiontoprovidean operat-ingmarginonthepipelinepressureandavoidtherequirementfor intermediatecompression.Forthestudyontheeffectofdiameter, binarycombinationsofCO2with2mol%,4mol%and15mol%
impu-ritieshavebeenconsidered.Itisrecognisedthattheseimpurity levelsarenotrealisticorrepresentativeofpotentialCO2streams,
buttheyhavebeenchosenatanexaggeratedlevelinorderthat thequalitativeeffectofeachimpuritycanbeobserved.Forthe net-workstudy,thecompositionsforeachofthecapturetechnologies presentedinTable3havebeenusedandithasbeenassumedthat everyemitterinthenetworkisusingthesamecapturetechnology withthesamecompositionofCO2forthattechnology.
Apressuregradientof0.2bara/kmhasbeenassumedforthe net-work.Thispressuregradientisconsideredappropriatebasedon operatingexperiencequotedforCO2pipelinesintheUSA(Seevam
etal.,2010)andisalsoinlinewiththepressuregradientsassumed
intheworkofVandeginsteandPiessens(2008).Theinlet
tempera-tureoftheflowintothepipelinewasassumedtobe30◦C.Although itisnotedthattheoutputfromthecompressorcanbeashighas
40-50◦C(Farris,1983),alowertemperaturehasbeenadoptedforthis
studyasithasbeenassumedthatcoolingwouldbeconductedafter thefinalstageofpressurisationinordertomaximisethedensityof thefluidinthepipeline(asdescribedinSection2.2.2).
CO2emissiondatahasbeentakenfromtenpowerstationsin
atypicalregionalcluster(AMEC,2008).Theemittershavebeen classifiedaccordingtotheIEATierclassification2(AMEC,2008)and
theannualCO2outputconsideredfromeachemitterispresented
2 TheIEATierClassification classifiesCO2emittersbyemission size:Tier0 includesallCO2sourcesemittingover1Mt/year,Tier1ismadeupofallsources withanoutputofbetween50kt/yearand1Mt/yearandTier2includesallother sourcesemittingunder50kt/year.
Table7
Hydraulicmodelinputassumptions.
FluidConditions Unit
Inlettemperature 30 ◦C
Pressuregradient 0.2 bar/km
Arrivalpressureatterminal Cricondenbar+10%
Flowrate 90%ofCO2emissions MT/yr PipelineandEnvironmentalConditions
Pipelineroughness 0.0457 mm
Pipelineburialdepth 1.2 m
Pipelinematerialyieldstrength 450 MPa Pipelineinsulation None
Pipelinethermalconductivity 60.55 W/m.K Soilthermalconductivity 2.595 W/m.K
Groundtemperature 5 ◦C
inTable5.Inthecalculationsofflowrateintothepipeline,a90%
captureratehasbeenassumedfromeachemitter.
3.2.2. PipelineandEnvironmentalConditions
All of the pipelines in this study are plain carbon steel of gradeEN10208L450(BSEN10208-2,2009).Aroughnessvalueof
0.0457mmhasbeenusedastherecommendedvaluefor
commer-cialsteelpipelines(Mohitpouretal.,2003).Ithasbeenassumed thatthemanufactureandconstructionstandardsandpracticesfor CO2pipelineswillbesimilartothoseusedfornaturalgaspipelines
andthereforenoinsulationhasbeenappliedtothepipelinesinthe hydraulicmodelandthepipeshavebeenburiedtoadepthof1.2m. Thisfigurewasassumedinthecalculationstoberepresentativeof themaximumdepthofcoverrequiredbyfortheconstructionof onshorepipelinesin theUK(PD8010-1,2004).Thesoilthermal conductivityhasbeentakentobe2.595W/m.K,whichistypicalof awet,sandysoil(McAllister,2005).Thesoilthermalconductivityis consideredtobeconstantalongthewholepipelinelength,although itisrecognisedthatsoiltypeswillchangeoverthedistances mod-elled.Thegroundtemperaturehasbeentakentobe5◦C,whichis therecommendeddesignconditionfornaturalgaspipelinesinthe
UK(IGEM/TD/1,2008).
3.3. NetworkConfigurations
Threepipelineconfigurationshavebeendevelopedtostudythe effectofimpuritiesonnetworkdevelopment;
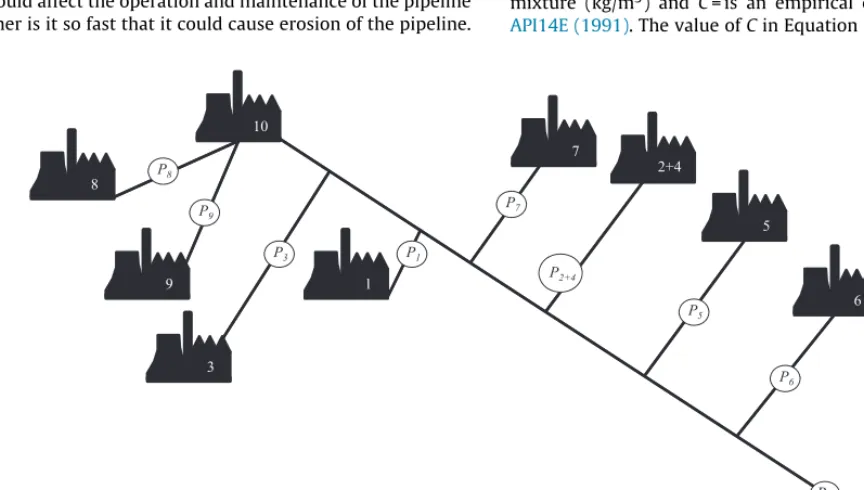
Case1. Directconnectionbetweenthesourceandtheonshore
terminal.Thiscasehasthelargestoveralllengthforthenetworkat
639km.
[image:8.646.33.554.73.196.2] [image:8.646.302.551.232.350.2]1
3
2+4
5
6 7
8
9
10
Terminal P10
P9 P8
P7
P6 P5
P3
P2+4 P1
Fig.9. SchematicrepresentationoftheCase3pipelinenetwork.
Case3. AtrunklineconnectingStation9totheterminalwith theother sources(expectfor station10) feedinginto this line.
The CO2 from Station 10 runs in its own directly connected
pipeline fromthe source tothe terminal. In this configuration
Stations 2 and 4 share a common pipeline. Case 3 has been
designed to overcome potential operational problems in Case
2 that could arise from having one large source (Station 10)
connected in a pipeline network that is linking much smaller
sources.
ThenetworksarerepresenteddiagrammaticallyinFigs.7–9.For Cases2and3,atreetypenetworkhasbeenmodelledwithalarge trunklineasthisisconsistentwiththefindingsofpreviousstudies
(AMEC,2008;Loneetal.,2010;Odenbergeretal.,2008;Pershad
etal.,2010).EachpipelineisdefinedbythelabelPi,whereiisthe
numberofthepowerstationfromwherethepipelineoriginates. Thelengthsofthepipelinesandthetotallengthofthenetworkfor eachcaseareshowninTable6.Allofthepipelineconnectionsare straightconnectionsandnoattempthasbeenmadetoaccountfor
[image:9.646.88.511.58.302.2] [image:9.646.113.498.469.726.2]Fig.11. Effectofimpuritytypeonpipelineexternaldiameterat15mol%impuritylevel.
topographyintherouteing.Eachnetworkcasewasmodelledfor apureCO2andforeachofthefourcapturestreamspresentedin
Table3.Thesinglesource-to-sinkpipelinethatwasselectedwas
P10.
3.4. CostModelling
ThecostmodelthathasbeenadoptedtoestimatetheCAPEXof eachofthepipelinesandnetworksisthatduetoGhaziandRace
(2012).ThismodelisbasedontheIEAmodelaspresentedinIEA
(2005a,b)withtheinclusionofalocationfactorFL.aspresentedin
IEA(2002).
CAPEX(MD)=FL.FT.[C1.L+C2+(C3.L−C4).]D+(C5).L−C6).D2 (4)
where,foronshorepipelines,C1=0.057;C2=1.8663;C3=0.00129;
C4=0;C5=0.000486;C6=0.000007; D=pipeline internal
diame-ter (inches); FL=locationfactor (taken tobe1.2 for theUnited
[image:10.646.99.495.56.315.2] [image:10.646.99.489.472.729.2]0.90 0.95 1.00 1.05 1.10 1.15 1.20
P1 P2 P3 P4 P5 P6 P7 P8 P9 P10 Total
Relative
cost/k
m
length
Post-combustion Pre-combustion Oxyfuel 1 Oxyfuel 2
Fig.13. Relativecost/kmforeachpipelineinCase1.
Kingdom);FT=terrainfactor(takentobe1.1forcultivatedland);
L=pipelinelength(km).
Asummaryoftheinputdataandassumptionsforthestudyare presentedinTable7.
4. Results
4.1. EffectofImpuritiesonPipelineDiameterandInletPressure
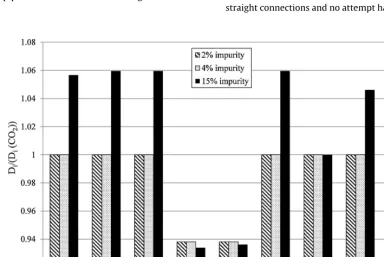
Theresultsfortheeffectofimpurityonpipelineinternal diam-eter,relative to pureCO2,are represented diagrammatically in
Fig.10.Thisfigureindicatesthat,withtheadditionofupto4mol% ofN2,O2,Ar,CO,H2,H2SandCH4,theimpurityhasnoeffectonthe
calculationoftheoptimumdiametersizei.e.theinternaldiameter specifiedforthebinarycombinationofCO2withimpurityisexactly
thesameasthatwouldbespecifiedforpureCO2.Thisresult
con-curswiththeworkofdeVisseretal.(2008)andYanetal.(2008)
whosetalimitof4vol%fornon-condensablesintermsofhydraulic efficiency.Forsomeimpurities(NO2andSO2)theadditionofthe
impurityhasreducedthediameterpipelinethatwouldbe speci-fiedoverpureCO2andthelargertheleveloftheseimpurities,the
smallerthepipelinethatisrequired.Howeverforthebinary com-binationsof15mol%impurityforN2,O2,Ar,CO,H2andCH4,the
diameterofthepipelinemustbeincreasedbybetween4-6%over thediameterforapureCO2 pipelinetoaccommodatethehigher
levelofimpurities.Thiswillobviouslyhaveacostimplication.
A comparison of internal diameter only takes into account
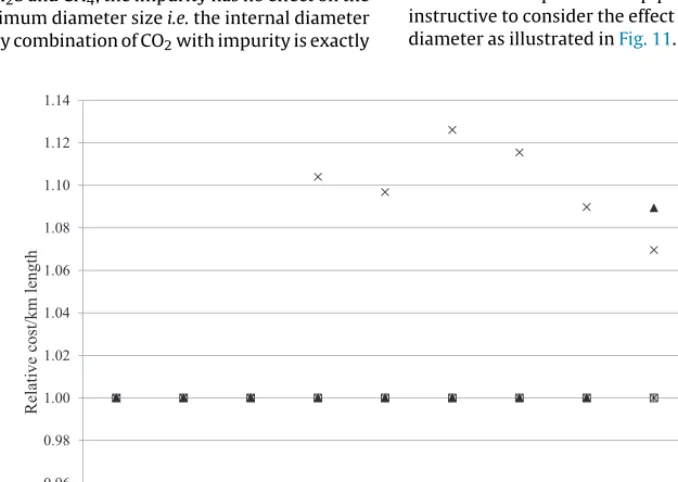
theeffectofimpuritiesonpipelinecapacity.However,itis also instructivetoconsidertheeffectofimpuritiesonexternalpipeline diameterasillustratedinFig.11.Forupto4mol%impurities,there
0.92 0.94 0.96 0.98 1.00 1.02 1.04 1.06 1.08 1.10 1.12 1.14
P1 P3 P2&4 P5 P6 P7 P8 P9 P10 Total
Relative
cost/k
m
length
Post-combustion Pre-combustion Oxyfuel 1 Oxyfuel 2
[image:11.646.136.474.56.302.2] [image:11.646.135.474.492.733.2]0.90 0.95 1.00 1.05 1.10 1.15
P1 P3 P2&4 P5 P6 P7 P8 P9 P10 Total
Relative
cost/k
m
length
Post-combustion Pre-combustion Oxyfuel 1 Oxyfuel 2
Fig.15.Relativecost/kmforeachpipelineinCase3.
isnorequirementtoincreasetheexternaldiameterofthepipeline overthatwhichwouldbespecifiedforpureCO2.However,forH2
inparticular,theadditionof15mol%increasestheinternal diam-eterby4.6%overpureCO2,buttheexternaldiameterisincreased
by6.2% over pure CO2. The reason for this is that the relative
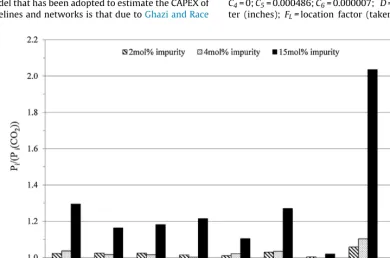
cricondenbarandthereforetheinletpressure(Pi)forthe15%H2
mixture is significantly higher than for the other binary
com-ponents (Fig. 12).Consequently, based onEquation 2, thewall
thickness (and therefore the external diameter) needs to be
increasedforthesamepipelinematerial.Thisresultindicatesthat externalratherthaninternaldiametershouldbeusedincost calcu-lationsformoreimpurestreamstotakethecostofthisadditional materialintoaccount.
Fig. 12 also illustrates the relative effect of the types and amountsofdifferentimpuritiesontheinletpressureandallows thedifferent impurities tobe rankedin terms of theirefficacy
in increasinginletpressure. Therefore it canbeconcluded that atthe2mol%level,allimpuritieshaveasimilareffectonraising
the inlet pressure by 3% on average over pure CO2.
How-ever, the addition of 15mol% H2 doubles the inlet pressure
required compared to the 2mol% mixture, whereas the
addi-tion of 15% H2S has very little effect compared to the 2mol%
mixture.
4.2. EffectofImpuritiesonNetworkSizeandConfiguration
4.2.1. EffectonCost/kmLength
Inordertocomparethecostsforeverypipelineineachcase study,thecost/kmlengthforeachpipelinecarryingthefour differ-entCO2streamshasbeencalculatedrelativetopureCO2usingthe
methodologyoutlinedinSection3.4.Theresultsarepresentedin
Figs.13–15.Fromthisanalysisitcanbeseenthat,forthemajority
0.90 0.95 1.00 1.05 1.10 1.15 1.20
P1 P3 P5 P6 P7 P8 P9 P10 Total
Relative
cost/k
m
length
Case 1 Case 2 Case 3
[image:12.646.125.466.54.303.2] [image:12.646.127.463.498.731.2]0.90 0.95 1.00 1.05 1.10 1.15 1.20 1.25
P1 P2 P3 P4 P5 P6 P7 P8 P9 P10
Relative
inlet
pressure
Post-combustion Pre-combustion Oxyfuel 1 Oxyfuel 2
Fig.17. RelativeinletpressureforeachpipelineinCase1.
ofpipelinesinCases1to3,thepost-combustion,pre-combustion andoxyfuel2compositionshavenoeffectontherelativecostper kmforthepipelinesinthenetwork.However,theoxyfuel1 com-position,themostimpurecomposition,canaffecttherelativecost
ofthepipelinebyupto16%andis themostexpensive
compo-sitiontobetransportedforthemajorityofpipelinesinthethree cases.
OneresultofnotefromthisanalysisisthatforP10,themain
trunk line in Case 2. In this case, shown in Fig. 14, the
pre-combustioncompositionhasa highercost/kmthan theoxyfuel
1composition.The reasonforthis isthat, althoughtheoutside diametersarethesame,theinternaldiameters differ, highlight-ingagainthatacostmodelbuiltonexternalratherthaninternal diameterwouldbemoreappropriate.
For theoxyfuel1composition,a comparisonhasbeenmade
ofthecost ofthethree differentnetworkcasesand theresults arepresentedinFig.16.Theseresultsconfirmtheworkofother researchersthatdirect connectionpipelines fromsourceto
ter-minal are more expensive than network options. Of the two
networkedcases,thenetworkwiththetwotrunklines(Case3) isamoreexpensiveoptionoverallintermsofcapitalcostofthe network,however,itisoperationallymorestable.Toillustratethis effect,theCase2networkwasmodelledundertheconditionthat Station10,thelargestemitterinthenetwork,hadbeenshutdown. Consequently,theflowrateinpipelineP10wasreducedby44%and
thenetworkbecameunstableastheflowvelocitywastoolowfor thediameterofthepipeline.Asaresult,duringtimeswhenthe flowfromStation10wasstoppedforeitherplannedorunplanned
0.90 0.95 1.00 1.05 1.10 1.15 1.20 1.25
P1 P3 P2&4 P5 P6 P7 P8 P9 P10
Relative
inlet
pressur
e
Post-combustion Pre-combustion Oxyfuel 1 Oxyfuel 2
[image:13.646.137.473.57.297.2] [image:13.646.133.477.492.735.2]0.90 0.95 1.00 1.05 1.10 1.15 1.20 1.25
P1 P3 P2&4 P5 P6 P7 P8 P9 P10
Relative
inlet
pressure
Post-combustion Pre-combustion Oxyfuel 1 Oxyfuel 2
Fig.19.RelativeinletpressureforeachpipelineinCase3.
outages,thewholepipelinenetworkwouldbeaffected.However, inthesamescenarioinCase3,theflowfromStation10isina sin-glesourcetoterminalpipelineandthereforedoesnotdominate theflowinthenetwork.
4.2.2. EffectonRelativeInletPressure
Asmentionedpreviously,thecostcalculationsindicatedabove donottakeintoaccounttheinletpressureofthepipeline,which willaffectthestressinthepipelineandconsequentlythewall thick-nessrequirement.Increasinginletpressurewillalsoaffectthecost ofcompression.
The relative inlet pressure (i.e. the inlet pressure for each pipelinerelativetopureCO2)hasbeencalculatedforeach
composi-tionandeachnetworkcase.TheresultsarepresentedinFigs.17–19. Theresultsindicatethat,forallcases,theoxyfuel1compositionhas thehighestrelativeinletpressure.Thisstreamisthemostimpure stream,containingupto15mol%impurities,andbasedonthe anal-ysispresented inFig.12,thehigherthelevel ofimpurities,the highertheinletpressurehastobetomaintainthefluidinthedense phase.Similarlythepost-combustionstream,whichcontainsless than0.2mol%impurities,hasthelowestinletpressureforallcases. Itisof particularinteresttoobservetheresultsforthe oxy-fuel1andthepre-combustioncompositions,whichbothcontain 2mol%impurities.ForCases1and3,thepre-combustionstream resultsinhigherinletpressuresthantheoxyfuel2composition.In ordertoaccountforthis,comparisonneedstobemadebetweenthe breakdownofimpuritiesinthestreaminTable3andtheresultsof
Fig.12.Althoughthetwocompositionscontain2mol%impurities, thepre-combustioncasecontains∼1%H2and∼1%N2whichhave
thegreatesteffectinincreasingtheinletpressure.Theoxyfuel2
compositioncontainsnoH2andtheothermajorcomponentsof
O2andArdonothaveasgreataneffectoninletpressure.
How-ever,forCase2,wheretheoverallpipelinelengthisshorter,the effectofthesedifferencesincompositiononinletpressureisnot aspronounced.
5. Conclusions
As CCS projects start to move from preliminary design to
detaileddesignandtoeventualcommercialprojects,the compo-sitionoftheCO2streamwillbecomeofincreasingimportancein
realisingcostreductionsinboththecaptureandtransportpartsof thechain.Theaimofthisworkhasbeentoanalysetheeffectsof thecompositiononpipelinecostandnetworkdesignforadense phasepipelinenetworkandseveralkeyconclusionscanbedrawn toinformtheprocessofspecifyingtheCO2purityonthebasisof
hydraulicdesign.
Inbinary combinationin singlepipelines,additions ofupto 4mol%ofimpuritiesdonotaffectthediameterandwallthicknessof pipelinethatwouldbespecifiedduetotheuseofdiscretepipeline sizesinthisanalysis.Inanetworksituationwithmultiple impuri-tiespresent,thecompositionofthe“non-CO2”partofthestream
doesbecomeimportant.Theanalysispresentedinthispaper indi-catesthatimpurityadditionsupto2mol%didnotaffecttherelative cost/kmforthenetworksintermsofthepipelineinternaldiameter andlength.However,theinletpressureisincreasedforallofthe compositionsstudiedandthiswillaffectthecompression require-mentsandthereforeoperationalcost.Inthisrespect,ithasbeen shownthatthelevelsofH2andN2inparticularshouldbelimited.
Onthebasisoftheworkconducted,evenlevelsofH2upto1mol%
wereincreasingtherequiredinletpressurebyover6%.
Aninterestingconclusioncanbedrawnfromtherelativeinlet pressureanalysisforCase2.Inthiscase,therelativeinletpressures
forthe98% purestreams(oxyfuel 2and pre-combustion)were
almostidentical.Therefore,ithasbeenpossibletonegatetheeffect oftheH2inthepre-combustionstreamcompositionbydecreasing
thelengthsofthepipelines.Itisrecognisedthatthisoptionmight notalwaysbepossibleduetootherconstraintsofrouteingcaused byterrainandriskcriteriabutitisachoicethatcouldbeconsidered. Anotherkeyobservationfromthisworkrelatestotheoperation ofnetworkswithmultipleemitters.Ifanumberofemittersareto beincorporatedintoanetworkitisimportanttoconsiderthe rela-tivecontributionsofeachoftheemitterstotheflowrate.Ifthereis onelargeemitterinthenetworkandthisemitterisnotinputting
into thesystem,for whatever reason, then thewhole network
couldbecomeunstabledependingontheoverallcontributionthat thisemittermakestotheflowrate.Thisscenariocouldarisedue
toplannedor unplannedmaintenance atthe source,but could
alsooccurintheinitialstagesofstartingupanetwork.Ithasbeen suggestedthatonescenarioforinfrastructuredevelopmentcould betooversizetrunklinesintheanticipationoffutureadditions
[image:14.646.125.463.54.303.2]in this paper indicatesthat, depending ontherelative sizesof theemitters,this scenario wouldonly befeasibleifthelargest emittersin thesystemwerethefirst toinputinto thepipeline system.
Althoughthisstudyhasconcentratedontheeffectofimpurities onthehydraulicanalysisofpipelinesandnetworks,itis reiter-atedthat,whendeterminingapipelineCO2streamspecification,
theeffectsonallaspectsofpipelinedesignandoperationmustbe considered.Inparticularitisimportanttorecognisethatfracture
control,corrosion and cracking mechanisms,hydrate formation
andhealthandsafetyissuescanallinfluencetheacceptable lev-elsofCO2impurities.Itisfurtherhighlightedthattheconclusions
fromthisworkarespecifictodensephaseCO2pipelines.Gaseous
phasepipelineswillhavedifferentdesignconstraints,particularly withrespecttopreventingtwo-phaseflow,wheretemperatureis amoreimportantconstraintthanpressure.Furtheranalysiswould berequiredtodeterminetheimpactofimpuritiesonthese con-straints.
Acknowledgements
This work has been conducted under the auspices of the
MATTRANproject(MaterialsforNextGenerationCO2 Transport
Systems) and the authors gratefully acknowledgethe financial
supportofEPSRCandE.ONforthis research(E.ON-EPSRC Grant
ReferenceEP/G061955/1).The authorswouldalsoliketothank
SchlumbergerforthedonationofthePIPESIMsoftwarethrough
theSchlumbergerUniversityDonationscheme.
References
AMEC,2008.AcarboncaptureandstoragenetworkforYorkshireandHumber -AnintroductiontounderstandingthetransportationofCO2fromYorkshireand Humberemittersintooffshorestoragesites.YorkshireForward.
Anheden,M.,Andersson,A.,Bernstone,C.,Eriksson,S.,Liljemark,S.,Wall,C.,2005. CO2qualityrequirementsforasystemwithCO2capture,transportandstorage. In:Proceedingsofthe7thGreenhouseGasTechnologiesConferenceGHGT-7, Vancouver.
API14E,1991.Recommendedpracticefordesignandinstallationofoffshore pro-ductionplatformpipingsystems(5thEdition).AmericanPetroleumInstitute, Washington,DC.
BBC,2011.Cost‘sank’Longannetcarboncapturedeal.
Beggs,H.,Brill,J.P.,1973.Astudyoftwo-phaseflowininclinedpipes.J.Petrol.Tech. 25,607–617.
Brill,J.P.,Mukherjee,H.,1999.Multiphaseflowinwells.SocietyofPetroleum Engi-neers,Richardson,Texas.
Brunsvold,A.,Jakobsen,J.P.,Husebye,J.,Kalinin,A.,2012.CasestudiesonCO2 trans-portinfrastructure:Optimizationofpipelinenetwork.In:effectofownership andpoliticalincentives.EnergyProcedia,Amsterdam,pp.3024–3031. BSEN10208-2,2009.BSEN10208-2,Steelpipesforpipelinesforcombustiblefluids.
Technicaldeliveryconditions.PipesofrequirementclassBBritishStandards Institute,London.
deVisser,E.,Henriks,C.,Barrio,M.,Molnvik,M.J.,deKoeijir,G.L.,LeGallo,S.Y.,2008. DynamisCO2QualityRecommendations.InternationalJournalofGreenhouse GasControl2,478–484.
Farris,C.,1983.UnusualdesignfactorsforsupercriticalCO2 pipelines.Energy Progress3,150–158.
GCCSI,2011.Economicassessmentofcarboncaptureandstoragetechnologies.2011 Update,1-58.
Ghazi,N.,Race,J.M.,2012.Techno-economicmodellingandanalysisofCO2pipelines, 9thInternationalPipelineConference.ASME,Calgary,Canada.
Heddle,G.,Herzog,H.,Klett,M.,2003.TheEconomicsofCO2Storage.Massachusetts InstituteofTechnology,LFEE2003-003.
Hein,M.A.,1985.RigorousandapproximatemethodsforCO2pipelineanalysis, Facil-ities,PipelinesandMeasurements:AWorkbookforEngineers;41stPetroleum MechanicalEngineeringWorkshopandConference,KansasCity,MO,USA123. Hendriks,C.,Wildenborg,T.,Feron,P.,Graus,T.,Brandsma,R.,2003.ECCaseCarbon
DioxideSequestration.Ecofys.
IEA,2002.TransmissionofCO2andenergy,in:Programme,I.G.G.R.D.(Ed.). IEA,2005a.BuildingtheCO2costcurvesforCO2storage:Europeansector,in:
Pro-gramme,I.G.G.R.D.(Ed.).
IEA,2005b.BuildingtheCO2costcurvesforCO2storage:NorthAmerica,in: Pro-gramme,I.G.G.R.D.(Ed.).
IEAGHG,2011.EffectsofimpuritiesongeologicalstorageofCO2.International EnergyAgencyGreenhouseGasprogramme.
IGEM/TD/1,2008.Steelpipelinesandassociatedinstallationsforhighpressuergas transmission.InstituteofGasEngineersandManagers.(IGEM).
Infochem,2011.Multiflash,Version3.7ed.InfochemComputerServicesLtd. IPCC,2005.IPCCSpecialReportonCarbonDioxideCaptureandStorage.Metz,B.,
Davidson,O.,deConinck,H.C.,Loos,M.,Meyer,L.A.(Eds.),WorkingGroupIIIof theIntergovernmentalPanelonClimateChange.CambridgeUniversityPress, Cambridge,UnitedKingdom.
Kather,A.,Kownatzki,S.,2011.Assessmentofthedifferentparametersaffecting thepurityofCO2purityfromcoalfiredoxyfuelprocess.InternationalJournalof GreenhouseGasControl55,S204–S209.
Kazmierczak,T.,Brandsma,R.,Neele,F.,Hendriks,C.,2009.Algorithmtocreatea CCSlow-costpipelinenetwork,EnergyProcedia,1(eds.).,WashingtonDC, 1617-1623.
Knoope,M.M.J.,Ramirez,A.,Faaji,A.P.C.,2013.Astate-of-the-artreviewof techno-economicmodelsforpredictingthecostsofCO2transport.InternationalJournal ofGreenhouseGasControl16,241–270.
Kreith,F.,Bohn,M.S.,2001.Principlesofheattransfer,6theditioned.BrooksCole. Kuby,M.J.,Middleton,R.S.,Bielicki,J.M.,2010.Analysisofcostsavingsfrom
net-workingpipelinesinCCSinfrastructuresystems,EnergyProcedia.Amsterdam, 2808–2815.
Li,H.,Yan,J.,2009.Evaluatingcubicequationsofstateforcalculationofvapor-liquid equilibriumofCO2andCO2-mixturesforCO2captureandstorageprocesses. AppliedEnergy86,826–836.
Lohrenz,J.,Bray,B.G.,Clark,C.R.,1964.Calculatingviscositiesofreservoirfluidsfrom theircompositions.JournalofPetroleumTechnology16,1171–1176. Lone,S.,Cockerill,T.,Macchietto,S.,2010.Thetechno-economicsofaphased
approachtodevelopingaUKcarbondioxidepipelinenetwork.TheJournalof PipelineEngineering9,225–234,223+.
McAllister,E.W.,2005.Pipelinerulesofthumbhandbook6thEditioned.Elsevier, Oxford.
McCoy,S.,Rubin,E.,2007.Anengineering-economicmodelofpipelinetransportof CO2withapplicationtocarboncaptureandstorage.CarnegieMellonUniversity, DepartmentofEngineeringandPublicPolicy.
Middleton,R.S.,Bielicki,J.M.,2009.Ascalableinfrastructuremodelforcarbon cap-tureandstorage:SimCCS.EnergyPolicy37,1052–1060.
Mohitpour,M.,Golshan,H.,Murray,A.,2003.PipelineDesignandConstruction:A PracticalApproachThirdeditioned.ASMEPress.
Moody,L.F.,1944.Frictionfactorsforpipeflow.TransASME66,671.
Odenberger,M.,Kjärstad,J.,Johnsson,F.,2008.Ramp-upofCO2captureandstorage withinEurope.InternationalJournalofGreenhouseGasControl2,417–438. Ogden,J.,Yang,C.,Johnson,N.,Ni,J.,Johnson,J.,2004.Conceptualdesignofoptimized
fossilenergysystemswithcaptureandsequestrationofcarbondioxide,Report totheUSDepartmentofEnergy.NationalEnergyTechnologyLaboratory. Oosterkamp,A.,Ramsen,J.,2008.StateoftheArtReviewofCO2Pipeline
Trans-portationwithRelevancetoOffshorePipelines,ReportNo.POL0-2007-138-A, Polytec.
PD8010-1,2004.Codeofpracticeforpipelines,Part1:Steelpipelinesonland.British StandardsInstitute.
Pedersen,K.S.,Fredenslund,A.,Christensen,P.L.,Thomassen,P.,1984.Viscosityof crudeoils.ChemicalEngineeringScience39,1011–1016.
Peng,D.Y.,Robinson,D.B.,1976.Anewtwo-constantequationofstate.Industrial andEngineeringChemistryFundamentals.,59–64.
Pershad,H.,Downie,M.J.,Race,J.M.,Seevam,P.N.,Hunt,P.,2010.BuildingCO2 Pipeline Infrastructure. InternationalEnergy Agency Greenhouse Gas Pro-gramme.
Race,J.M.,Wetenhall,B.,Seevam,P.N.,Downie,M.J.,2012.TowardsaCO2Pipeline Specification:DefiningToleranceLimitsforImpurities.JournalofPipeline Engi-neering11(3),173.
Salama,M.M.,2000.AnalternativetoAPI14Eerosionalvelocitylimitsfor sand-ladenfluids,JournalofEnergyResourcesTechnology.TransactionsoftheASME 122,71–77.
Schlumberger,2010.PIPESIMsoftwareversion,2010.1.
Seevam,P.N.,Race,J.M.,Downie,M.J.,2007.Carbondioxidepipelinesfor sequestra-tionintheUK-engineeringgapanalysis.GlobalPipelineMonthly3(6). Seevam,P.N.,Race,J.M.,Downie,M.J.,Barnett,J.,Cooper,R.,2010.Capturingcarbon
dioxide:Thefeasibilityofre-usingexistingpipelineinfrastructuretotransport anthropogenicCO2,8thInternationalPipelineConference,IPC2010.Calgary,AB, 129–142.
Sweeney,G.,2012.Post2020CCSwillbecost-competitivewithotherlow-carbon energytechnologies.GreenhouseGases.ScienceandTechnology2,6–8. VanDerGulik,P.S.,1997.Viscosityofcarbondioxideintheliquidphase.PhysicaA:
StatisticalMechanicsanditsApplications238,81–112.
Vandeginste,V.,Piessens,K.,2008.Pipelinedesignforaleast-costrouter applica-tionforCO2transportintheCO2sequestrationcycle.InternationalJournalof GreenhouseGasControl2,571–581.
Yan,J.,Anheden,M.,Bernstone,C.l.,S.,Pettersson,H.,Simonsoon,D.,Li,H.,2008. ImpactsonNon-CondensableComponentsonCCS,IEACO2Specification Work-ingGroupMeeting,Stockholm.