Procedia Engineering 81 ( 2014 ) 2298 – 2304
1877-7058 © 2014 Published by Elsevier Ltd. This is an open access article under the CC BY-NC-ND license (http://creativecommons.org/licenses/by-nc-nd/3.0/).
Selection and peer-review under responsibility of the Department of Materials Science and Engineering, Nagoya University doi: 10.1016/j.proeng.2014.10.324
ScienceDirect
11th International Conference on Technology of Plasticity, ICTP 2014, 19-24 October 2014,
Nagoya Congress Center, Nagoya, Japan
Complex incremental sheet forming using back die support on
aluminium 2024, 5083 and 7075 alloys
Nagarajan Devarajan
a, Giribaskar Sivaswamy
a, Rahul Bhattacharya
a,*,
David P Heck
b, Muhammad Amir Siddiq
caAdvanced Forming Research Centre,University of Strathclyde, Glasgow, PA4 9LJ, UK bBoeing Research & Technology, USA
cDepartment of Design, Manufacture and Engineering Management, University of Strathclyde, Glasgow, UK
Abstract
The complex prototype forming of an industrial component was investigated on AA2024, 5083 and 7075 sheets using the incremental sheet forming approach. Fracture occurred at the top of crevice and steeper wall angle region for AA2024 and 7075, respectively, whereas no fracture in the AA5083 alloy. Thinning was higher at the steeper wall angle for all the alloys, from both the experimental and finite element analysis. It is speculated that the typical tensile nature of loading and the associated thinning of the material at these regions caused plastic instability in the material thereby creating micro-cracks that resulted in the failure of the component.
© 2014 The Authors. Published by Elsevier Ltd.
Selection and peer-review under responsibility of Nagoya University and Toyohashi University of Technology.
Keywords: Incremental sheet forming; Aluminium alloys; Nakajima test; Forming limit curves; Digital image correlation
1. Introduction
High costs and lead times are involved in conventional sheet metal forming processes due to the design and manufacturing of component specific tooling. To eliminate or reduce these factors, especially for small batch size
* Corresponding author. Tel.: +44-141 534 5246.
E-mail address: [email protected](Rahul Bhattacharya)
© 2014 Published by Elsevier Ltd. This is an open access article under the CC BY-NC-ND license (http://creativecommons.org/licenses/by-nc-nd/3.0/).
sheet metal part production, incremental sheet metal forming technology has been under investigation during the last few decades. Incremental sheet metal forming process is generally classified as a die-less method, which can form 3D shapes using a simple tool and a CNC machine. The process comprises of tool path generation using the CAD geometry, generation of CNC code and then using a CNC milling machine to form a 3D component. In this process, a sheet material is clamped rigidly around its edges with or without support underneath and formed using a single hemispherical indenter following a numerically controlled tool path. The material is subjected to localised deformation to get the part of desired shape (Park et al., 2003; Jackson et al., 2009). The main advantages of this process over conventional sheet forming processes are that a relatively small and light-weight machine can be used to form the sheet metal, and wide range of shapes can be achieved without using specialised dies. Most of the research investigations have focused towards the influence of parameters like thickness of the sheet, radius of the forming tool, speed of rotation and feed rate of stylus, nature of tool path and size of the vertical step down (pitch) per revolution on the formability limits of the process (Martins et al., 2006; Minutolo et al., 2007; Yamashita et al., 2008). The mechanics of the deformation under the action of the forming tool also influences the forming limits that can be achieved and should be considered while designing the finite element models of the process. Experimental verifications have to be used to confirm the possible deformation mechanisms like plane-stress or pure shear, as reported by previous investigations, depending on the geometry of the part involved.
In the present study, aluminium alloy sheets are used to fabricate a part with a complex geometry using a back die block support. The reason for using the back die support is to have better control over the material flow as well as to overcome the effect of springback during the process. The main focus of the study is to understand the strain evolution and distribution at different locations of the part having such complex geometry. Besides, factors leading to the fracture of the finished parts have been analysed and discussed. The thickness of the aluminium alloy sheets used in the present study are AA2024-O (thickness, t=1.35 mm), AA5083-H111 (t=1.47 mm) and AA7075-O (t=1.00 mm).
2. Experimental Work
2.1. Process
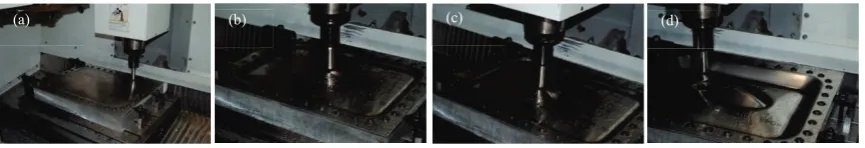
The facility used for performing the incremental sheet forming experiments is given in Fig. 1. A 3-axis CNC machine with a 25 mm diameter forming tool (stylus) rotating at a speed of 25 RPM and made of tool steel having a hemispherical tip at the forming end was used for the process. The path of the rotating stylus as well as the movement of CNC machine bed was controlled by the CNC machine to achieve a high degree of precision. Based on the initial trials, the tool path was optimized for deforming the sheet blanks of all the alloys. Fig. 1(a)-(d) shows the series of photographs recorded at different stages of the incremental forming of an AA7075 alloy. Cutting oil was used as a lubricant for all the cases. Fig. 1(a) shows the initial stage of the incremental forming process where the edges of sheet blank to be deformed was clamped to the back support die mounted on to the CNC machine.
2.2. Strain Analysis
Analysis of strain distribution on the specimen was carried out by means of circular grid analysis (CGA) technique using GOM Argus® software. For this purpose, circular dots of 1 mm in diameter were applied at regular spacing (2 mm) over the entire sheet material using the electrochemical etching technique. High resolution digital
(b) (c) (d)
[image:2.544.57.490.476.550.2](a)
camera was used to capture the photographs of the dots before and after the forming process, and photogrammetric algorithms of the software used these images to determine the 3D coordinates of the dots. The change in diameter of the dot due to deformation was used to calculate the major and minor strain values, and strain distribution maps were evaluated for the formed sheet blanks of all the alloys.
2.3. Analysis of Thickness Reduction
The percentage reduction in thickness of sheets after the forming process was analysed using GOM-ATOS 3D® high resolution scanner. A full three-dimensional measurement can be performed either by rotating the test specimen or by moving the camera sensors. The 3D coordinates of the scanned surface can be used for calculating the percentage reduction in thickness of the deformed parts and an accuracy of ±30 μm was achieved on the measurements.
2.4. Development of Forming Limit Curves
The forming limit curve test is one of the tests used to determine the formability of sheet materials for the specific thickness. In the present study, Nakajima test was used to determine the forming limit curves of the alloys studied. Shape of the test specimens and the necessary test parameters as described by the ISO 12004 standard were used. The forming experiments were performed on a Zwick 1000 kN BUP machine with a blank holding pressure of 600 kN for all the tests. Digital image correlation (DIC) technique using GOM Aramis® was used for the strain evaluation on the test specimens having speckle pattern on the surface.
2.5. Finite Element Modelling and Analysis
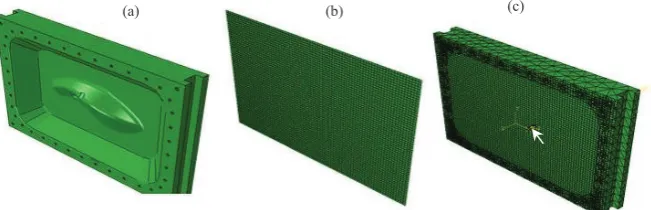
[image:3.544.108.434.452.557.2]Finite element analysis was performed using ABAQUS® Explicit software (Version 6.13) to understand the stress and strain distribution in the final formed parts. For the stylus and back die support block, a rigid material behaviour was defined. Sheet blank was considered to be deformable and different mesh sizes ranging between 2.54 mm and 7.6 mm were used to analyse the deformation behaviour of different zones of interest. Final optimised mesh used after mesh sensitivity analyses included 147362 linear tetrahedral elements of type C3D4 for the back die support and 4800-43020 linear quadrilateral elements of type S4R for the sheet blank. The CAD model of the back die support and the meshed sheet blank are given in Fig. 2(a) and (b), respectively. Fig. 2(c) illustrates the assembled view of the sheet with the back die and the starting position of the stylus was indicated by an arrow. The back die was always modelled as rigid material and fixed in all directions. To constraint the sheet with bolts, all the edges of the sheet were fixed as shown in Fig. 2(c).
Fig. 2. Schematic illustrating (a) CAD model of the actual back die used for the experiments, (b) geometry of the sheet blank after finite element meshing, (c) assembled view showing the die, sheet material as well as the position of the stylus (shown by white arrow).
For sheet blank material properties of AA5083 and AA7075 alloys, the values derived from the uniaxial tensile testing stress-strain curves in 0°, 45° and 90° orientations with respect to rolling direction (Table 1) were considered. Properties for AA2024 alloys were taken from the literature (M. Bauccio, Ed., 1993). In addition,
major and minor strain values derived from the forming limit curves of each alloy were also input to refine the accuracy of the results and predict damage initiation and evolution. As the forming experiments were conducted using cutting oil as lubricant, the friction behaviour at point of contact between blank surface and stylus was modelled using the coulomb friction law with a friction coefficient of 0.1.
Table.1 Mechanical properties of AA 5083 and AA7075 alloys used in the present study.
Alloy YS, MPa UTS, MPa Elongation, %
0°RD 45°RD 90°RD 0°RD 45°RD 90°RD 0°RD 45°RD 90°RD
AA5083 155 147 149 304 301 297 18 20 19
AA7075 156 161 162 205 202 205 10 12 11
3. Results and Discussion
[image:4.544.100.460.263.381.2]3.1. Incremental Sheet Forming Trials
Fig. 3 shows the images of the incremental sheet formed components and the insights show the fractured area. Fracture of the sample was generally observed at the top of the crevice and higher wall angle for the AA2024 and AA7075 alloys, respectively, whereas no fracture was observed in the case of AA5083 alloy.
Fig. 3. Photographs of the incremental sheet formed components for (a) AA2024; (b) AA5083; and c) AA7075 alloy. The insights shows the fractured region of the component.
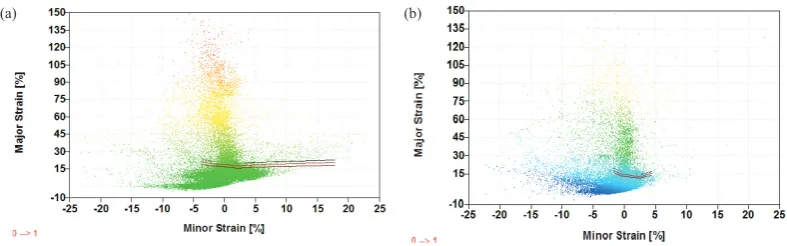
The thickness reduction for the AA5083 and 7075 alloy is shown in Fig. 4(b) and (c). The white regions in the figures are unindexed areas that arise due to the fading of the grids during forming. The fading was quite large for the AA2024 alloy, and hence the thickness profile obtained using GOM-ATOS scanning is shown in Fig. 4(a). Thinning was always higher at the steeper wall angle region (indicated by arrows) for all the alloys and it was generally greater for the AA5083 alloy compared with the other alloys. The amount of thinning varied from 10-45% between various regions of the component on all the alloys and it is worth noting that even though the AA5083 alloy was harder (H111 temper) than the remaining two alloys (O temper) and thinning was greater, fracture was not observed on this alloy. The strains evaluated using GOM®Argus was compared with the forming limit curves for the AA5083 and 7075 alloys (no Argus data was available for the AA2024 alloy) to understand the formability behaviour and shown in Fig. 5. The top curve in the figure is the actual forming limit curve and, the centre and bottom curve represents 5 and 10% offset strains, respectively. The results showed that the incremental forming strains were much higher than the forming limit curve strains for all the alloys and no fracture was observed for the AA5083 alloy even though the strains were much higher in near-plane strain region, possibly due to the higher thickness. These results are in line with other researcher results (Jeswiet et al., 2005; Silva et al., 2011). This implies that the conventional forming limit curve data and uniaxial stress-strain curves were not enough to predict the failure during the incremental forming of such complex parts and suggests that the strain imposed during the process should be a combined function of deformation modes, strain paths, thickness evolution and stress relaxation behaviour.
Fig. 4. Thickness profile after incremental forming for (a) AA2024; (b) AA5083; and (c) AA7075 alloy.
Fig. 5. Comparison of incremental forming process strains with the forming limit curve strains for the (a) AA5083; and (b) AA7075 alloy. The top curve shows the actual forming limit curve and, the centre and bottom curve represents 5 and 10% offset strains, respectively.
3.2. Finite Element Simulation Observations
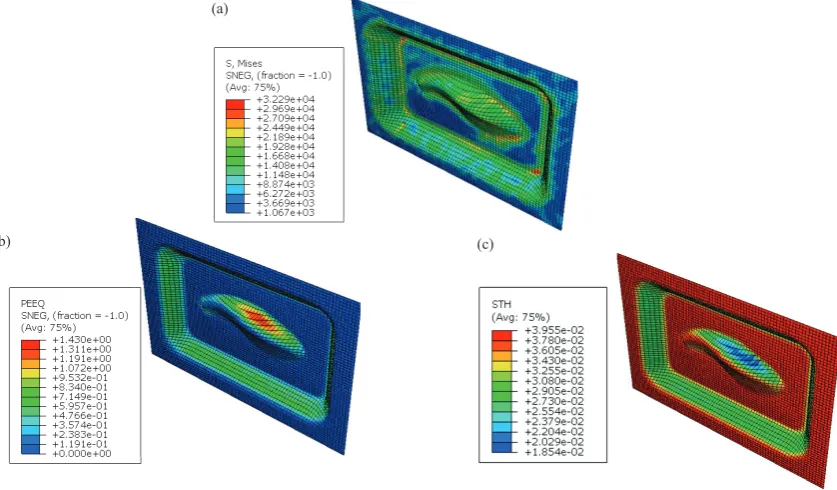
The finite element simulation results are shown in Figs. 6 and 7 for the AA5083 and AA7075 alloys, respectively. The incremental sheet forming process always involved deforming the material in the downward direction and the effective stress induced at various regions of the part implied that the maximum tensile stress was always concentrated on the steeper wall angle regions during the deformation (Fig. 6(a) and 7(a)). This influences the amount of plastic strain accumulated on these regions, causing maximum stretching at the steeper wall angle (Fig. 6(b) and 7(b)) and hence the maximum thinning of the material (Fig. 6(c) and 7(c)). The limited material property data for the AA2024 alloy, due to fading of the grids, prevented the finite element analysis of the alloy.
It is speculated that the typical tensile nature of loading and, the associated stretching and thinning of the material at the steeper wall angle region caused plastic instability in the material thereby creating micro-cracks at these regions, which in turn resulted in the failure of the component. Comparing the experimental thinning results of Fig. 4(b) and (c) with the finite element simulation results of Figs. 6(c) and 7(c), corroborates the hypothesis and the higher thickness of the AA5083 alloy might be advantageous over the other two alloys in bypassing the failure. However, further microstructural characterisation is underway to understand the deformation mode and the mechanism of failure during incremental forming of such complex parts. It was also found during the simulations that by using the conventional forming limit curve data, damage initiated much earlier than as found during the experiments. Therefore, such microstructural characterisation and fractography will help better understand the underlying mechanisms of failure during the incremental forming process. This will then aid in developing a fracture forming limit diagram that not only depends on major and minor strains but also include the effect of the thickness reduction and microstructure evolution as limiting factors.
(a) (b) (c)
[image:5.544.68.462.196.319.2]Fig. 6. FE simulation results showing the (a) effective stress, (b) effective strain and (c) thickness reduction for the AA5083 alloy.
Fig. 7. FE simulation results showing (a) effective stress, (b) effective strain and (c) thickness reduction for tAA7075 alloy. (a)
(b)
(c)
(a)
[image:6.544.66.485.339.584.2]4. Conclusions
Prototype forming of three different aluminium alloys AA2024, 5083 and 7075 with the thickness ranging from 1-1.5 mm was investigated using incremental sheet forming approach. Forming limit curves cannot be used to predict the failure during such complex deformation process. Thinning was higher at the steeper wall angle region for all the alloys and generally greater for the AA5083 alloy compared with the other two alloys. The plastic instability caused by the thinning of the material may be the reason for the fracture in the AA2024 and AA7075 alloy, whereas the higher thickness of the AA5083 alloy might be advantageous in bypassing the failure.
Acknowledgements
The authors wish to thank Clint Luttgeharm, Techcetra for sharing the die design and conducting initial forming trials on AA2024-O alloy and also for his valuable inputs on the discussion related to the results.
References
J. -J. Park and Y.-H. Kim., 2003. Fundamental studies on the incremental sheet metal forming technique. Journal of Materials Processing Technology 140, 447-453.
K. Jackson and J. Allwood., 2009. The mechanics of incremental sheet forming. Journal of Materials Processing Technology 209, 1158-1174. P. A. F. Martins, N. Bay, M. Skjoedt and M. B. Silva., 2006. Theory of single point incremental forming. CIRI Annals- Manufacturing
Technology 57, 247-252.
F. C. Minutolo, M. Durante, A. Formisano and A. Langella., 2007. Evaluation of the maximum slope angle of simple geometries carried out by incremental forming process. Journal of Materials Processing Technology 194, 145-150.
M. Yamashita, M. Gotoh and S. –Y. Atsumi., 2008. Numerical simulation of incremental forming of sheet metal. Journal of Materials Processing Technology 199, 163-172.
M. Bauccio, Ed., 1993. ASM Metals Reference Book, 3rd edition, ASM International, Materials Park, OH.
J. Jeswiet, D. Young and M. Ham., 2005. Non-traditional forming limit diagrams for incremental forming. Advanced Materials Research 6-8, 409-416.