R E S E A R C H
Open Access
Improving documentation and coding for
acute organ dysfunction biases estimates
of changing sepsis severity and burden: a
retrospective study
Chanu Rhee
1,2*, Michael V. Murphy
1, Lingling Li
1, Richard Platt
1, Michael Klompas
1,2and for the Centers for Disease
Control and Prevention Epicenters Program
Abstract
Introduction:Claims-based analyses report that the incidence of sepsis-associated organ dysfunction is increasing. We examined whether coding practices for acute organ dysfunction are changing over time and if so, whether this is biasing estimates of rising severe sepsis incidence and severity.
Methods:We assessed trends from 2005 to 2013 in the annual sensitivity and incidence of discharge ICD-9-CM
codes for organ dysfunction (shock, respiratory failure, acute kidney failure, acidosis, hepatitis, coagulopathy, and thrombocytopenia) relative to standardized clinical criteria (use of vasopressors/inotropes, mechanical ventilation for≥2 consecutive days, rise in baseline creatinine, low pH, elevated transaminases or bilirubin, abnormal international normalized ratio or low fibrinogen, and decline in platelets). We studied all adult patients with suspected infection (defined by≥1 blood culture order) at two US academic hospitals.
Results:Acute organ dysfunction codes were present in 57,273 of 191,695 (29.9 %) hospitalizations with suspected infection, most commonly acute kidney failure (60.2 % of cases) and respiratory failure (28.9 %). The sensitivity of all organ dysfunction codes except thrombocytopenia increased significantly over time. This was most pronounced for acute kidney failure codes, which increased in sensitivity from 59.3 % in 2005 to 87.5 % in 2013 relative to a fixed definition for changes in creatinine (p= 0.019 for linear trend). Acute kidney failure codes were increasingly assigned to patients with smaller creatinine changes: the average peak creatinine change associated with a code was 1.99 mg/dL in 2005 versus 1.49 mg/dL in 2013 (p<0.001 for linear decline). The mean number of dysfunctional organs in patients with suspected infection increased from 0.32 to 0.59 using discharge codes versus 0.69 to 0.79 using clinical criteria (p<0.001 for both trends and comparison of the two trends). The annual incidence of hospitalizations with suspected infection and any dysfunctional organ rose an average of 5.9 % per year (95 % CI 4.3, 7.4 %) using discharge codes versus only 1.1 % (95 % CI 0.1, 2.0 %) using clinical criteria.
Conclusions:Coding for acute organ dysfunction is becoming increasingly sensitive and the clinical threshold to code patients for certain kinds of organ dysfunction is decreasing. This accounts for much of the apparent rise in severe sepsis incidence and severity imputed from claims.
* Correspondence:[email protected]
1Department of Population Medicine, Harvard Medical School and Harvard
Pilgrim Health Care Institute, 133 Brookline Avenue, Boston, MA 02215, USA 2Division of Infectious Diseases, Brigham and Women’s Hospital, 75 Francis
Street, Boston, MA 02115, USA
Introduction
Administrative claims data are used extensively to de-scribe the epidemiology of severe sepsis [1]. Analyses of large claims databases have suggested a dramatic rise in the incidence of severe sepsis and sepsis-associated organ dysfunction over time, helping spur global recog-nition of its importance [2–6]. Claims data have also suggested declines in sepsis-associated mortality rates [3, 4, 7, 8]. In addition, the United States (US) Centers for Medicare and Medicaid Services (CMS) has recently proposed monitoring hospitals’adherence to severe sepsis bundles using claims data to screen for eligible patients followed by chart review [9].
Despite the convenience of administrative data, how-ever, their accuracy for tracking changes in sepsis burden over time is controversial [10, 11]. There is evidence that increasing awareness of sepsis among clinicians and hos-pital coders, coupled with financial incentives to code for higher acuity of illness, is leading clinicians to diag-nose and code for sepsis more diligently [12, 13]. In practice, though, most epidemiologic studies of sepsis incidence do not use the explicit International Classifi-cation of Diseases, Ninth Revision,Clinical Modification (ICD-9-CM) diagnosis codes for severe sepsis (995.92) and septic shock (785.52) alone, partly because these codes were only introduced in 2002 and partly because chart audits suggest that these codes are still underused [14, 15]. A more common and more sensitive method for estimating the incidence of severe sepsis is to seek patients with concurrent codes for infection and acute organ dysfunction, with or without explicit sepsis codes [16]. It is plausible, however, that the same pressures leading to better coding for sepsis are also leading to more sensitive coding for acute organ dysfunction, which in turn could be biasing estimates of the inci-dence, severity, and mortality of severe sepsis [4].
Our aim was to examine temporal trends in the inci-dence and sensitivity of claims codes for acute organ dysfunction relative to objective clinical markers of acute organ dysfunction utilizing an electronic clinical data-base that spans a 9-year period at two large academic hospitals. We hypothesized that 1) the sensitivity of cod-ing for acute organ dysfunction has increased over time, 2) the clinical thresholds for coding patients for acute organ dysfunction has decreased, and 3) that these two effects are biasing estimates of temporal trends in the incidence, severity, and mortality of severe sepsis.
Methods
We identified all patients aged ≥18 years admitted to Massachusetts General Hospital (MGH) and Brigham and Women’s Hospital (BWH) in Boston, Massachusetts between January 1, 2005 and December 31, 2013 and who had evidence of suspected infection, defined as any
blood culture order during hospitalization. We retrieved patients’ ICD-9-CM codes, demographics, medications, laboratory results, and hospitalization dates from the hospitals' Research Patient Data Registry; all of these data elements have been captured in this clinical data-base since 2002 [17, 18]. Dates of mechanical ventilation were obtained from clinical data collected by respiratory therapists at each hospital. We derived patients’ comorbid-ities from their ICD-9-CM and diagnosis-related group (DRG) codes using the method of Elixhauser [19]. The study was approved by the Partners Healthcare Institu-tional Review Board (protocol number 2012P002136) and a waiver of patient consent was obtained.
Trends in acute organ dysfunction in patients with suspected infection
We estimated rates of acute organ dysfunction using codes from widely cited claims-based studies of sepsis epidemiology [3, 6, 16]. We focused on codes for organ dysfunction that can be clearly defined using electronic clinical data. Our clinical definitions for organ dysfunction were informed by thresholds suggested by the Surviving Sepsis Campaign Guidelines and the Sepsis-related Organ Failure Assessment score [20, 21], but were modified to incorporate changes in baseline organ function (Table 1). Furthermore, because we wanted these electronic criteria to have high specificity, we chose conservative clinical and laboratory thresholds that would undeniably qualify a patient as having acute organ dysfunction by virtually any definition. We calculated the sensitivity of each set of organ dysfunction codes for clinical markers of organ dysfunction for each calendar year. We also examined whether the threshold for coding for acute organ dysfunc-tion has changed over time by looking for temporal changes in the positive predictive value (PPV) for each set of organ dysfunction codes. In order to estimate the effect of changing organ dysfunction coding practices on appar-ent severe sepsis trends, we compared the annual inci-dence and hospital mortality of patients with suspected infection and at least one organ dysfunction code versus those with suspected infection and at least one clinical marker for organ dysfunction.
infection codes for this sensitivity analysis included the codes for sepsis (995.91), severe sepsis (995.92), septic shock (785.52) and all infection codes used by Dombrovskiy, Martin and Angus et al., for a total of 1280 different codes [3, 6, 16]. We also compared trends in the number of dysfunctional organs measured by codes versus clinical data in patients with blood culture orders and in patients with codes for severe sepsis (995.92).
Statistical analyses
Nine-year trends were assessed by fitting linear time series models to the observed annual rates. Each model yielded an estimate for the constant annual change in incidence, mortality, sensitivity and/or PPV rates. For estimates of change in incidence, the annual percent change was calculated as the ratio between the fitted annual change and the observed baseline rate in 2005. All analyses were performed using SAS version 9.4 (SAS Institute, Cary, NC, USA). We consideredp<0.05 to be statistically significant and used two-tailed tests.
Results
Patient characteristics and trends in organ dysfunction codes
There were 818,070 adult hospitalizations from 2005 through 2013, of which 191,695 (23.4 %) had suspected infection (i.e., blood culture orders). Of these, 57,273 pa-tients (29.9 %) had a discharge code for acute organ
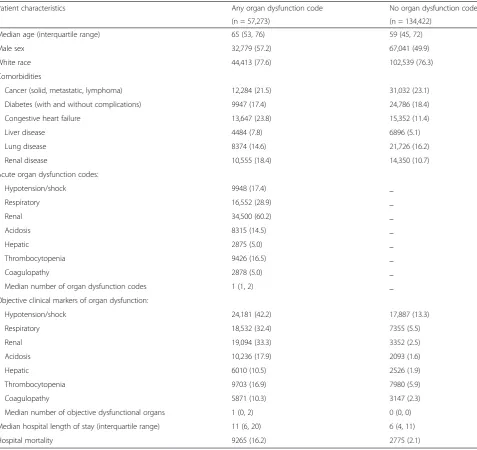
dysfunction. Clinical characteristics of patients with and without organ dysfunction codes are presented in Table 2. Patients with acute organ dysfunction codes tended to be older and had more comorbid illnesses, longer hospital lengths of stay, and higher in-hospital mortality. Among patients with acute organ dysfunction codes, the most common were acute kidney failure (60.2 % of patients) and respiratory failure (28.9 %).
There was a significant linear increase from 2005 to 2013 in the annual rate of acute organ dysfunction codes in hospitalizations with suspected infection for all types of organ dysfunction except coagulopathy (Table 3). There was also an increase in the incidence of each type of organ dysfunction imputed from objective clinical data; however, the increase in organ dysfunction using clinical criteria was less pronounced for all types of organ dysfunction except thrombocytopenia. In the case of renal failure and respiratory failure, the trends were discrepant, as rising rates of acute kidney failure and re-spiratory failure codes were contrasted by declining rates of corresponding clinical markers.
[image:3.595.55.538.98.297.2]The mean number of dysfunctional organs in patients with suspected infection increased from 0.32 to 0.59 using discharge codes (fitted 9-year increase of 87 % relative to 2005, 95 % CI 82, 93 %, p <0.001 for linear trend). In contrast, the mean number of organ dys-functions only rose from 0.69 to 0.79 when using clinical criteria (fitted 9-year increase of 14 % relative to 2005, Table 1Organ dysfunction categories with corresponding ICD-9-CM codes and objective clinical markers
Organ dysfunction ICD-9-CM codesa Objective clinical marker
Shock 785.5 (Shock) Any vasopressor or inotropebduring hospitalization
Respiratory 518.81 (Acute respiratory failure) Mechanical ventilation for≥2 consecutive daysc 518.82 (Other pulmonary insufficiency)
799.1 (Respiratory arrest)
Renal 584 (Acute kidney failure) Peak creatinine≥2.0 mg/dL and≥1.5× increase from baselined
Acidosis 276.2 (Acidosis) Nadir pH <7.15e
Hepatic 570 (Acute and subacute necrosis of liver) Peak aspartate aminotransferase (AST) or alanine aminotransferase (ALT) during hospitalization >1000 units/L, or total bilirubin≥6.0 mg/dL 573.3 (Hepatitis unspecified)
573.4 (Hepatic infarction)
Thrombocytopenia 287.3 (Thrombocytopenia) Nadir platelet count during hospitalization <50,000/μL and >50 % decrease from baselinef
287.5 (Thrombocytopenia unspecified)
Coagulopathy 286.6 (Defibrination syndrome) Nadir fibrinogen during hospitalization <200 mg/dL or peak international normalized ratio (INR) >3.0 and increase by >0.5 from baselineg 286.9 (Other and unspecified coagulation defects)
ICD-9-CM International Classification of Diseases, Ninth Revision, Clinical Modification a
Where three- or four-digit codes are listed, all associated subcodes were included
b
Vasopressor = parenteral order for norepinephrine, dopamine, epinephrine, phenylephrine, or vasopressin. Inotrope = parenteral order for dobutamine or milrinone
c
Mechanical ventilation required for 2 or more consecutive calendar days, unless death occurs while on mechanical ventilation prior to the 2nd
day
d
Baseline value for creatinine defined as lowest value from 30 days prior to hospital admission through hospital discharge. Excludes patients with end-stage renal disease code (585.6)
e
Nadir pH could be from arterial or venous blood gas
f
Baseline value for platelets defined as highest value from 30 days prior to hospital admission through hospital discharge
g
95 % CI 11, 16 %,p<0.001;p<0.001 for comparison of the code-based trend versus the clinical data-based trend). When examining patients coded for severe sepsis (995.92), the annual mean number of coded dysfunc-tional organs increased from 1.78 in 2005 to 2.21 in 2013 (p = 0.060 for linear increase). In contrast, there was a significant decline in the mean number of dysfunc-tional organs measured by clinical criteria, from 2.87 in 2005 to 2.53 in 2013 (p= 0.045 for linear decline;p<0.001 for comparison of two trends).
Sensitivity and PPV of organ dysfunction codes
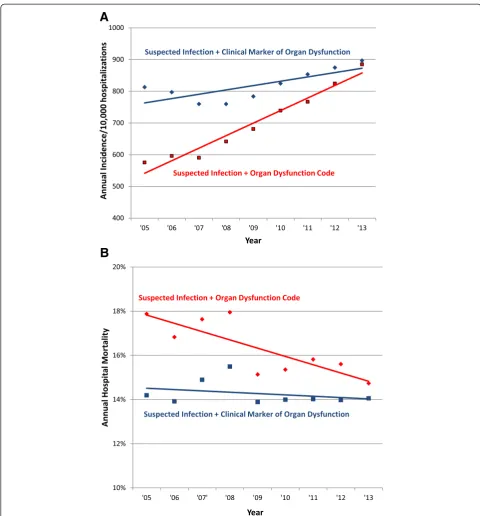
The sensitivity of organ dysfunction coding relative to objective clinical signs of organ dysfunction increased
steadily over time for each category, with the sole excep-tion of thrombocytopenia codes (Fig. 1a). This was most pronounced for acute kidney failure codes, which in-creased in sensitivity from 59.3 % in 2005 to 87.5 % in 2013 (p= 0.019 for linear trend), and for respiratory fail-ure codes, which increased from 40.0 % to 54.6 % during the same time period (p<0.001).
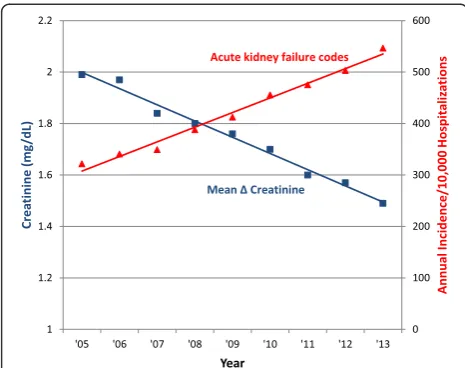
[image:4.595.60.538.99.549.2]Simultaneously, there was a decrease in the PPV of several types of organ types of organ dysfunction codes relative to objective clinical criteria (Fig. 1b). This was again most pronounced for acute kidney failure codes, which decreased in PPV from 65.2 % in 2005 to 41.5 % in 2013 (p<0.001 for linear trend). The mean rise in cre-atinine associated with assigning a discharge code for Table 2Baseline characteristics of patients with suspected infection with and without acute organ dysfunction codes (2005–2013)
Patient characteristics Any organ dysfunction code No organ dysfunction code
(n = 57,273) (n = 134,422)
Median age (interquartile range) 65 (53, 76) 59 (45, 72)
Male sex 32,779 (57.2) 67,041 (49.9)
White race 44,413 (77.6) 102,539 (76.3)
Comorbidities
Cancer (solid, metastatic, lymphoma) 12,284 (21.5) 31,032 (23.1)
Diabetes (with and without complications) 9947 (17.4) 24,786 (18.4)
Congestive heart failure 13,647 (23.8) 15,352 (11.4)
Liver disease 4484 (7.8) 6896 (5.1)
Lung disease 8374 (14.6) 21,726 (16.2)
Renal disease 10,555 (18.4) 14,350 (10.7)
Acute organ dysfunction codes:
Hypotension/shock 9948 (17.4) _
Respiratory 16,552 (28.9) _
Renal 34,500 (60.2) _
Acidosis 8315 (14.5) _
Hepatic 2875 (5.0) _
Thrombocytopenia 9426 (16.5) _
Coagulopathy 2878 (5.0) _
Median number of organ dysfunction codes 1 (1, 2) _
Objective clinical markers of organ dysfunction:
Hypotension/shock 24,181 (42.2) 17,887 (13.3)
Respiratory 18,532 (32.4) 7355 (5.5)
Renal 19,094 (33.3) 3352 (2.5)
Acidosis 10,236 (17.9) 2093 (1.6)
Hepatic 6010 (10.5) 2526 (1.9)
Thrombocytopenia 9703 (16.9) 7980 (5.9)
Coagulopathy 5871 (10.3) 3147 (2.3)
Median number of objective dysfunctional organs 1 (0, 2) 0 (0, 0)
Median hospital length of stay (interquartile range) 11 (6, 20) 6 (4, 11)
acute kidney failure decreased from 1.99 mg/dL in 2005 (n = 2088) to 1.49 mg/dL (n = 4804) in 2013 (p <0.001 for linear decline) (Fig. 2). The PPV also de-creased for respiratory failure codes from 80.8 % to 70.5 % (p= 0.005), and a significant decrease from 25.2 % to 16.2 % was also seen for acidosis codes (p<0.001). In contrast, there was no significant change in PPV for shock, hepatic, and thrombocytopenia codes, while the PPV for coagulopathy codes increased.
Incidence and mortality trends
There was a significant difference in trends in the inci-dence and mortality of hospitalizations with acute organ dysfunction when using codes for organ dysfunction ver-sus objective clinical criteria (Fig. 3a, b). The incidence rate of hospitalizations with suspected infection and any organ dysfunction code rose from 575 per 10,000 hospi-talizations in 2005 to 885 in 2013 (fitted annual increase of 6.9 %, 95 % CI 5.5, 8.4 %, p<0.001 for linear trend). In contrast, hospitalizations with suspected infection and clinical markers of organ dysfunction rose from 896 per 10,000 hospitalizations in 2005 to 952 in 2013 (1.1 % increase/year, 95 % CI 0.1 %, 2.0 %,p= 0.075).
The mortality rate of patients with suspected infection and any organ dysfunction code decreased from 17.9 % in 2005 to 14.7 % in 2013 (fitted annual decrease of 0.4 %, 95 % CI 0.3, 0.5 %,p= 0.001). In contrast, mortality rates were stable among patients with clinical markers of organ dysfunction, changing from 14.1 % in 2005 to 13.8 % in 2013 (0.1 % decrease/year, 95 % CI 0.0, 0.2 %,p= 0.080).
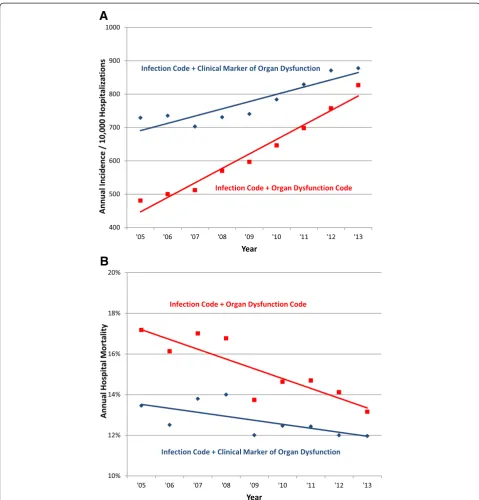
When this analysis was repeated using patients with an infection discharge code as the denominator, similar trends were found. The incidence of hospitalizations with any infection and organ dysfunction code rose from 481 per 10,000 hospitalizations in 2005 to 827 in 2013 (9.1 %/year, 95 % CI 6.1, 11.7 %,p= 0.001) versus a less pronounced rise from 729 to 878 (2.9 %/year, 95 % CI 1.5, 4.3 %,p= 0.009) for infection codes plus any clinical
marker of organ dysfunction (Fig. 4a). The hospital mortality of any infection and organ dysfunction code decreased from 17.2 % to 13.2 % (0.5 % decline/year, 95 % CI 0.4, 0.6 %,p<0.001) versus 13.5 % to 12.0 % (0.2 % decline/year, 95 % CI 0.2, 0.3 %,p= 0.002) for infection codes plus any clinical marker of organ dysfunction (Fig. 4b).
Discussion
In this study, we compared organ dysfunction coding practices to patients’objective clinical data using 9 years of data from a large electronic clinical database. We found that the sensitivity of hospital discharge codes for identifying hospitalizations with objective signs of acute organ dysfunction increased steadily over time for all organ dysfunction types, with the sole exception of thrombocytopenia. This trend was most striking for pa-tients with acute kidney failure and respiratory failure codes. There was a simultaneous decrease in the positive predictive value for several types of organ dysfunction codes. Most notably, we observed a steady decrease in the average change in creatinine associated with acute kidney failure codes. We also observed a decrease in the proportion of patients assigned respiratory failure codes who required 2 or more days of mechanical ventilation.
[image:5.595.58.541.113.259.2]Documentation and coding of acute organ failure is known to be imperfect; for example, in one retrospective study, appropriate documentation of acute kidney injury occurred in only 43 % of patients who had a doubling of baseline creatinine [22]. To our knowledge, however, this is the first study to show changes in coding practices relative to objective clinical criteria over an extended period of time. It is likely that coding for organ dysfunc-tion is increasing over time both because of the inherent desire to better document patients’ clinical states, and also because hospitals are eligible for higher reimburse-ments for caring for more complex patients. Changes in the reimbursement and policy landscape support this Table 3Annual incidence of hospitalizations with suspected infection and organ dysfunction (codes or clinical markers) in 2005 versus 2013
Organ dysfunction codes Objective clinical markers of organ dysfunction
2005 2013 Fitted 9-year
relative change (95 % CI)
pvalue for linear trend
2005 2013 Fitted 9-year
relative change (95 % CI)
pvalue for linear trend Per/10,000 (Total cases) Per/10,000 (Total cases) Per/10,000 (Total cases) Per/10,000 (Total cases)
Shock 65 (580) 271 (1787) +229 % (+176, 282 %) <0.001 465 (4127) 586 (5279) +29 % (+16, 42 %) 0.007
Respiratory 171 (1516) 248 (2234) +55 % (44, 66 %) <0.001 330 (2933) 314 (2831) −6.9 % (−8.6,−5.1 %) <0.001 Renal 322 (2857) 547 (4924) +81 % (+74, 87 %) <0.001 354 (3144) 260 (2338) −27 % (−53,−0.5 %) 0.103 Acidosis 54 (479) 151 (1356) +187 % (+169, 205 %) <0.001 76 (673) 80 (722) +0.6 % (−5.2, +6.5 %) 0.837 Hepatic 26 (232) 42 (381) +65 % (+47, 83 %) <0.001 90 (797) 107 (962) +17 % (−1.6, +36 %) 0.133 Coagulopathy 32 (287) 37 (334) +39 % (+0.1, 77 %) 0.106 116 (1033) 106 (954) +4.7 % (−8.2, +18 %) 0.507 Thrombocytopenia 106 (940) 150 (1351) +51 % (+15, 87 %) 0.039 187 (1657) 264 (2382) +50 % (+37, 64 %) <0.001
trend. For example, in the United States, the Centers for Medicare and Medicaid Services (CMS) transitioned from diagnosis-related group reimbursements into the current Medical Severity DRG (MS-DRG) system in 2007. The MS-DRG system explicitly ties reimbursement to severity of illness and spurred hospitals to make significant efforts to improve documentation and coding [23].
We found that the apparent rate of rise over time in patients with suspected infection and at least one kind of organ dysfunction was markedly higher using claims data compared to objective clinical markers. This suggests that imputing severe sepsis incidence using infection codes and organ dysfunction codes (without necessarily requiring explicit sepsis codes) can be misleading because
A
B
[image:6.595.60.537.88.609.2]physicians and hospitals are changing the ways they code for organ dysfunction. The largest contributor to this dis-crepant increase was a decrease in the threshold for cod-ing for acute kidney failure over time, combined with rising sensitivity for capturing significant changes in base-line creatinine. In addition to financial pressures, the increase in coding for acute kidney injury over time may also be a result of changes in classifications by multidiscip-linary collaborative groups that now include smaller changes in baseline serum creatinine [24]. For example, the Acute Kidney Injury Network definition published in 2007 defined a rise in serum creatinine of≥0.3 mg/dL as the first stage of acute kidney injury; previously, the Risk, Injury, Failure, Loss of kidney function, and End-stage kid-ney disease (RIFLE) consensus criteria defined a 1.5-fold increase in serum creatinine as the earliest stage of acute kidney injury [25, 26]. Interestingly, thrombocytopenia codes were the only type of organ dysfunction that did not increase in sensitivity in our study. This may be because, in contrast to most of the other types of organ dys-function, thrombocytopenia is not on CMS’s list of major complications and comorbid conditions that factor most heavily into severity of illness assessment and reim-bursements [27].
The mortality decline in patients with suspected infec-tion and objective markers of organ dysfuncinfec-tion was less pronounced than the mortality decrease associated with organ dysfunction codes. This suggests that part of the apparent decline in severe sepsis mortality imputed from claims is likely due to the increasing inclusion of patients
with milder organ dysfunction over time. We also found that the increase in mean number of dysfunctional organs was greater when using codes versus clinical data, and in fact the mean number of dysfunctional organs was de-creasing in patients coded with severe sepsis (995.92). This indicates that estimating changes in the severity of sepsis based on codes alone is subject to bias, and also supports the notion that the threshold for assigning the explicit se-vere sepsis code is decreasing. These conclusions are in line with a prior trend analysis of data from the Nation-wide Inpatient Sample from 2003 to 2007 that showed a paradoxical increase in the number of coded dysfunctional organ systems in patients with severe sepsis but decreas-ing in-hospital mortality rates and mean costs per case [4]. A similar phenomenon may account for findings from the National Hospital Discharge Survey that demonstrated an increase in the proportion of patients with sepsis who had any organ failure from 19.1 % in 1979–1984 to 30.2 % in 1995–2000 [6].
Importantly, even in 2013, the sensitivity for most organ dysfunction codes was relatively low (60 % or less in most cases), indicating that claims still substantially underestimate the true occurrence of infection-related organ dysfunction. This suggests that there is still plenty of room for coding accuracy to improve and thus con-tinue to bias future surveillance efforts using claims data. Conversely, if incentives are reversed, it is conceivable that the sensitivity of coding could decrease. A potential example where incentives might change is with the new sepsis bundle mandated by CMS in the US, which pro-poses to monitor adherence through retrospective review of patients with ICD-10 discharge codes for sepsis, severe sepsis, and septic shock. Measuring changes in any type of disease burden and associated outcomes is centrally dependent on having uniform definitions that are applied consistently over time. Because claims do not live up to this standard in many cases, there is a pressing need to de-velop objective and efficient surveillance strategies that are more resistant to changes in external forces. The in-creasing implementation and use of electronic medical record systems worldwide allows for the possibility of shifting surveillance from claims to clinical data, including patients’laboratory values. These are less prone (although not entirely immune) to changes in use and interpretation over time [10].
Our findings also have implications beyond severe sep-sis epidemiology. Several studies unrelated to sepsep-sis have used administrative databases to examine trends in organ dysfunction and also found increasing incidences over time. For example, claims for acute kidney failure in Medicare data rose steadily from 1992 to 2001 while the associated mortality decreased [28]. Likewise, Stefan et al. examined trends in acute respiratory failure using ICD-9-CM codes from the Nationwide Inpatient Sample
[image:7.595.56.289.88.272.2]and found a significant increase in incidence and total costs, but a decline in mortality and length of stay [29].
Our study has several limitations. First, we only used data from two academic hospitals in one city; further studies should explore the generalizability of our findings. Notably, however, our estimated incidence of organ dys-function and trends in severe sepsis rates as ascertained
via ICD-9-CM codes mirror national and international trends [5, 30]. Second, we used blood culture orders as our marker for suspected infection, but it is unclear if this captures the entire cohort of patients with sepsis. How-ever, our findings were identical when using hospitali-zations with infection or sepsis diagnoses at discharge, suggesting that these patterns of changing organ
A
B
[image:8.595.56.537.86.603.2]dysfunction coding are not unique to patients with blood culture orders. Third, it is possible that some patients be-ing coded as acute respiratory failure are increasbe-ingly using noninvasive positive pressure ventilation over time and that therefore we underestimated the sensitivity and overestimated the decline in positive predictive value of claims codes for respiratory failure. However, if this is the case, this also underscores the changing and variable use of the term“respiratory failure” and the need for a more
uniform definition. Fourth, we did not evaluate changes in coding for altered mental status since we did not have an objective measure for comparison. Lastly, our estimates of baseline values for laboratory values were derived from the“best”values during or 30 days prior to hospitalization, and this may not be accurate in some cases. However, we applied the same definitions for baseline values over the entire study period, minimizing the risk of any systematic bias.
A
B
[image:9.595.57.537.87.588.2]Conclusions
In conclusion, the sensitivity of ICD-9-CM coding for clinically defined acute organ dysfunction increased steadily from 2005 through 2013, while the threshold for coding for several types of organ dysfunction decreased. Coding for acute kidney failure, in particular, has in-creased dramatically. These changes explain a substantial fraction of the reported increase in the incidence of se-vere sepsis and sepsis-associated organ dysfunction, as well as improvements in survival. Since the coding for these conditions remains incomplete, estimates of the in-cidence of severe sepsis are likely to continue to increase. There is a pressing need to develop new surveillance strat-egies for organ dysfunction and sepsis based on clinical data rather than claims codes.
Key messages
The sensitivity of coding for acute organ dysfunction is increasing over time.
Simultaneously, the threshold for coding for several types of organ dysfunction is decreasing, particularly the threshold to code for acute kidney failure.
These changes explain some of the apparent increase in the incidence of severe sepsis and sepsis-related organ dysfunction, as well as the decline in sepsis-related mortality rates.
Standardized criteria and surveillance strategies for acute organ dysfunction are needed to enable reliable conclusions to be drawn about trends in the burden of severe sepsis.
Abbreviations
ALT:alanine aminotransferase; AST: aspartate aminotransferase;
BWH: Brigham and Women’s Hospital; CI: confidence interval; CMS: Centers for Medicare and Medicaid Services; ICD-9-CM:International Classification of Diseases,Ninth Revision,Clinical Modification; INR: international normalized ratio; IQR: interquartile range; MGH: Massachusetts General Hospital; MS-DRG: Medical Severity diagnosis-related group; PPV: positive predictive value; US: United States.
Competing interests
The authors declare that they have no competing interests.
Authors’contributions
CR had full access to all of the data in the study and takes responsibility for the integrity of the data and the accuracy of the data analysis. CR contributed to the study design; data acquisition, analysis, and interpretation; drafting and critical revision of the manuscript for intellectual content; and final approval of the manuscript. MK contributed to the study design; data interpretation; drafting and critical revision of the manuscript for intellectual content; and final approval of the manuscript. RP contributed to the data interpretation; critical revision of the manuscript for intellectual content; and final approval of the manuscript. MVM contributed to the data acquisition and data analysis; critical revision of the manuscript for intellectual content; and final approval of the manuscript. LL contributed to the data analysis; critical revision of the manuscript for intellectual content; and final approval of the manuscript.
Acknowledgements
We would like to thank Ed Burns and Paul Nuccio from the Respiratory Therapy Departments at Massachusetts General Hospital and Brigham and Women’s Hospital for providing us with the data on mechanically ventilated patients.
Financial support
This work was supported by a research grant from the Prevention Epicenters Program of the Centers for Disease Control and Prevention (Grant number 3U54 CK000172-04S1). Dr. Rhee received support from the National Institutes of Health (T32 AI007061).
Received: 8 June 2015 Accepted: 26 August 2015
References
1. Jolley RJ, Sawka KJ, Yergens DW, Quan H, Jette N, Doig CJ. Validity of administrative data in recording sepsis: a systematic review. Crit Care. 2015;19:139.
2. Hall MJ, Williams SN, DeFrances CJ, Golosinskiy A. Inpatient care for septicemia or sepsis: a challenge for patients and hospitals. NCHS Data Brief. 2011;62:1–8.
3. Dombrovskiy VY, Martin AA, Sunderram J, Paz HL. Rapid increase in hospitalization and mortality rates for severe sepsis in the United States: a trend analysis from 1993 to 2003. Crit Care Med. 2007;35:1244–50. 4. Lagu T, Rothberg MB, Shieh MS, Pekow PS, Steingrub JS, Lindenauer PK.
Hospitalizations, costs, and outcomes of severe sepsis in the United States 2003 to 2007. Crit Care Med. 2012;40:754–61.
5. Gaieski DF, Edwards JM, Kallan MJ, Carr BG. Benchmarking the incidence and mortality of severe sepsis in the United States. Crit Care Med. 2013;41:1167–74.
6. Martin GS, Mannino DM, Eaton S, Moss M. The epidemiology of sepsis in the United States from 1979 through 2000. N Engl J Med. 2003;348:1546–54. 7. Kumar G, Kumar N, Taneja A, Kaleekal T, Tarima S, McGinley E, et al.
Nationwide trends of severe sepsis in the 21st century (2000–2007). Chest. 2011;140:1223–31.
8. Stevenson EK, Rubenstein AR, Radin GT, Wiener RS, Walkey AJ. Two decades of mortality trends among patients with severe sepsis: a comparative meta-analysis*. Crit Care Med. 2014;42:625–31.
9. Centers for Medicare and Medicaid Services, HHS. Medicare program; hospital inpatient prospective payment systems for acute care hospitals and the long-term care hospital prospective payment system and fiscal year 2015 rates; quality reporting requirements for specific providers; reasonable compensation equivalents for physician services in excluded hospitals and certain teaching hospitals; provider administrative appeals and judicial review; enforcement provisions for organ transplant centers; and electronic health record (EHR) incentive program. Final rule. Fed Regist.
2014;79:49853–50536.
10. Rhee C, Gohil S, Klompas M. Regulatory mandates for sepsis care–reasons for caution. N Engl J Med. 2014;370:1673–6.
11. Walkey AJ, Lagu T, Lindenauer PK. Trends in sepsis and infection sources in the United States. A population-based study. Ann Am Thorac Soc. 2015;12:216–20.
12. Rhee C, Murphy MV, Li L, Platt R, Klompas M, for the Centers for Disease Control and Prevention Epicenters Program. Comparison of trends in sepsis incidence and coding using administrative claims versus objective clinical data. Clin Infect Dis. 2015;60:88–95.
13. Lindenauer PK, Lagu T, Shieh MS, Pekow PS, Rothberg MB. Association of diagnostic coding with trends in hospitalizations and mortality of patients with pneumonia, 2003–2009. JAMA. 2012;307:1405–13.
14. Iwashyna TJ, Odden A, Rohde J, Bonham C, Kuhn L, Malani P, et al. Identifying patients with severe sepsis using administrative claims: patient-level validation of the angus implementation of the international consensus conference definition of severe sepsis. Med Care. 2014;52:e39–43. 15. Whittaker SA, Mikkelsen ME, Gaieski DF, Koshy S, Kean C, Fuchs BD.
Severe sepsis cohorts derived from claims-based strategies appear to be biased toward a more severely ill patient population. Crit Care Med. 2013;41:945–53.
17. Murphy SN, Chueh HC. A security architecture for query tools used to access large biomedical databases. Proc AMIA Symp. 2002;552–556. 18. Nalichowski R, Keogh D, Chueh HC, Murphy SN. Calculating the benefits of
a research patient data repository. AMIA Annu Symp Proc. 2006;2006:1044. 19. Elixhauser A, Steiner C, Harris DR, Coffey RM. Comorbidity measures for use
with administrative data. Med Care. 1998;36:8–27.
20. Dellinger RP, Levy MM, Rhodes A, Annane D, Gerlach H, Opal SM, et al. Surviving sepsis campaign: international guidelines for management of severe sepsis and septic shock: 2012. Crit Care Med. 2013;41:580–637. 21. Vincent JL, Moreno R, Takala J, Willatts S, De Mendonca A, Bruining H, et al.
The SOFA (Sepsis-related Organ Failure Assessment) score to describe organ dysfunction/failure. On behalf of the Working Group on Sepsis-Related Problems of the European Society of Intensive Care Medicine. Intensive Care Med. 1996;22:707–10.
22. Wilson FP, Bansal AD, Jasti SK, Lin JJ, Shashaty MG, Berns JS, et al. The impact of documentation of severe acute kidney injury on mortality. Clin Nephrol. 2013;80:417–25.
23. Rosenstein AH, O'Daniel M, White S, Taylor K. Medicare's value-based payment initiatives: impact on and implications for improving physician documentation and coding. Am J Med Qual. 2009;24:250–8.
24. Valette X, du Cheyron D. A critical appraisal of the accuracy of the RIFLE and AKIN classifications in defining“acute kidney insufficiency”in critically ill patients. J Crit Care. 2013;28:116–25.
25. Mehta RL, Kellum JA, Shah SV, Molitoris BA, Ronco C, Warnock DG, et al. Acute Kidney Injury Network: report of an initiative to improve outcomes in acute kidney injury. Crit Care. 2007;11:R31.
26. Bellomo R, Ronco C, Kellum JA, Mehta RL, Palevsky P. Acute Dialysis Quality Initiative workgroup. Acute renal failure - definition, outcome measures, animal models, fluid therapy and information technology needs: the Second International Consensus Conference of the Acute Dialysis Quality Initiative (ADQI) Group. Crit Care. 2004;8:R204–212.
27. Medicare Program; Changes to the Hospital Inpatient Prospective Payment Systems. http://www.cms.gov/Medicare/Medicare-Fee-for-Service-Payment/ AcuteInpatientPPS/IPPS-Regulations-and-Notices-Items/CMS1228401.html. 28. Xue JL, Daniels F, Star RA, Kimmel PL, Eggers PW, Molitoris BA, et al.
Incidence and mortality of acute renal failure in Medicare beneficiaries, 1992 to 2001. J Am Soc Nephrol. 2006;17:1135–42.
29. Stefan MS, Shieh MS, Pekow PS, Rothberg MB, Steingrub JS, Lagu T, et al. Epidemiology and outcomes of acute respiratory failure in the United States, 2001 to 2009: a national survey. J Hosp Med. 2013;8:76–82. 30. Wilhelms SB, Huss FR, Granath G, Sjoberg F. Assessment of incidence of
severe sepsis in Sweden using different ways of abstracting International Classification of Diseases codes: difficulties with methods and interpretation of results. Crit Care Med. 2010;38:1442–9.
Submit your next manuscript to BioMed Central and take full advantage of:
• Convenient online submission
• Thorough peer review
• No space constraints or color figure charges
• Immediate publication on acceptance
• Inclusion in PubMed, CAS, Scopus and Google Scholar
• Research which is freely available for redistribution