R E S E A R C H A R T I C L E
Open Access
A spatial simulation model for dengue virus
infection in urban areas
Stephan Karl
1, Nilimesh Halder
1, Joel K Kelso
1, Scott A Ritchie
2and George J Milne
1*Abstract
Background:The World Health Organization estimates that the global number of dengue infections range between 80–100 million per year, with some studies estimating approximately three times higher numbers. Furthermore, the geographic range of dengue virus transmission is extending with the disease now occurring more frequently in areas such as southern Europe.Ae. aegypti, one of the most prominent dengue vectors, is endemic to the far north-east of Australia and the city of Cairns frequently experiences dengue outbreaks which sometimes lead to large epidemics. Method:A spatially-explicit, individual-based mathematical model that accounts for the spread of dengue infection as a result of human movement and mosquito dispersion is presented. The model closely couples the four key
sub-models necessary for representing the overall dynamics of the physical system, namely those describing mosquito population dynamics, human movement, virus transmission and vector control. Important features are the use of high quality outbreak data and mosquito trapping data for calibration and validation and a strategy to derive local mosquito abundance based on vegetation coverage and census data.
Results:The model has been calibrated using detailed 2003 dengue outbreak data from Cairns, together with census and mosquito trapping data, and is shown to realistically reproduce a further dengue outbreak. The simulation results replicating the 2008/2009 Cairns epidemic support several hypotheses (formulated previously) aimed at explaining the large-scale epidemic which occurred in 2008/2009; specifically, while warmer weather and increased human movement had only a small effect on the spread of the virus, a shorter virus strain-specific extrinsic incubation time can explain the observed explosive outbreak of 2008/2009.
Conclusion:The proof-of-concept simulation model described in this study has potential as a tool for understanding factors contributing to dengue spread as well as planning and optimizing dengue control, including reducing theAe. aegyptivector population and for estimating the effectiveness and cost-effectiveness of future vaccination programmes. This model could also be applied to other vector borne viral diseases such as chikungunya, also spread byAe. aegyptiand, by re-parameterisation of the vector sub-model, to dengue and chikungunya viruses spread byAedes albopictus.
Keywords:Dengue virus, Individual-based simulation model,Ae. aegyptipopulation dynamics, Spatially-explicit modelling, Dengue outbreaks, Dengue control measures
Background
Dengue is a leading cause of morbidity in tropical environ-ments around the world [1] with a small proportion of infections resulting in possibly fatal dengue hemorrhagic fever (DHF) [2]. While previous estimates of the global dengue burden were in the range of 80–100 million human infections per year, recent studies suggest a considerably
higher number of infections (390 million per year) [3]. There are also clear indications that the global range of dengue transmission is extending (e.g. in Southern Europe),
with higher case numbers occurring andAedesmosquitoes
colonizing new habitats [4,5].
Dengue epidemics can be especially severe in urban areas, where human population density is high [6]. The
vector mosquito Ae. aegypti have adapted to life in
densely populated areas, using standing water as breed-ing sites with females feedbreed-ing predominantly on humans,
* Correspondence:[email protected] 1
School of Computer Science and Software Engineering, The University of Western Australia, 35 Stirling Highway, Crawley, Perth, WA 6009, Australia Full list of author information is available at the end of the article
and are responsible for dengue transmission in urban environments [7].
Controlling dengue outbreaks is resource intensive and large outbreaks may overwhelm even well estab-lished and efficient control mechanisms [7]. It is there-fore important for the planning of adequate control interventions that the dynamics, frequency and scale of expected outbreaks can be predicted and simulated using suitable computational models [8]. Furthermore, such simulation models can be used to estimate the ef-fectiveness of alternative mitigating intervention strat-egies that are difficult to determine in the field [9].
Ae. aegypti is endemic to urban areas of northeast Queensland, Australia. Dengue viruses are often intro-duced to this region through viremic travellers from dengue endemic regions. This frequently causes dengue outbreaks of variable severity and the city of Cairns is often the focus of these outbreaks [7,10].
Long-term dengue research and surveillance, including mosquito trapping studies in Cairns, has resulted in the collation of significant datasets describing dengue outbreaks in this area [7,10-13]. These datasets were made available to the authors from the Tropical Population Health Unit (TPHU) of Queensland Health. These data have allowed for the informed development of a detailed dengue simula-tion model which may be used to estimate and evaluate the characteristics and determinants of dengue outbreaks and to test a range of interventions such as interior (within-house) residual spraying (IRS), the larvicidal treatment or destruction ofAedes breeding sites, potential dengue vac-cination programmes and mosquito population manipula-tion usingWolbachiainfected mosquitoes [14].
The aim of the present study was to develop a proof-of-concept, spatially-explicit simulation model of dengue transmission that incorporates individual humans living in the city of Cairns as well as individual mosquitoes, and uses realistic, heterogeneous human and mosquito population structures and movement patterns. A spatial modelling approach is required since many of the factors that are crucial for dengue spread are not homoge-neously distributed (e.g., human population density and mosquito abundance).
The model developed in the present study builds upon previous studies which have modelled mosquito popula-tion dynamics and/or dengue transmission. The model presented here adopts many of the features of the previ-ously developed CIMSIM/DENSIM and Skeeterbuster models, which are highly developed, complex simulation models that are focused on capturing mosquito popula-tion dynamics with great detail using a complex system of customizable mosquito breeding containers and wea-ther data as input [15-25].
The motivation of the present study was i)to build a
spatial mosquito population dynamics sub-model which
is weather mediated and results in physically realistic tem-poral and spatial mosquito abundance patterns;ii)to build human population, dengue transmission and outbreak management sub-models with internal feedback (that is, dengue control has an effect on the mosquito population) and couple this to the mosquito population sub-model andiii)to calibrate and validate the model using detailed data available for several dengue outbreaks in the city of Cairns, Queensland.
The resulting model structure utilises new modelling techniques to capture physical system properties such as mosquito flight, rainfall dependence of the mosquito population, human movement patterns and dengue con-trol. Here, the model is demonstrated by reproducing different outbreak scenarios recorded in Cairns. This is one of very few spatial dengue transmission model that
in-clude all of the following features i) human movement
and mosquito flight,ii)geospatial estimation of mosquito
breeding site abundance in an urban area, iii) internal
feedback of individual-based mosquito control during a dengue outbreak on the mosquito population dynamics and iv) the use of detailed, spatial outbreak datasets to calibrate and, separately, validate the model.
The developed model is aproof-of-concept demonstration that the inherently complex phenomena observed in actual dengue outbreaks can be captured by a spatial simulation model that incorporates interlinked and interacting sub-models for each of the phenomena that determine the out-come of dengue epidemics. These are: mosquito population dynamics and movement; human population movement; transmission of dengue virus between mosquitos and humans; and vector control measures.
While the following methods section illustrates the overall approach to building, calibrating and validating the model, a detailed description of the various model components may be found in Additional file 1.
Methods
Modelling strategy
The approach adopted utilised as much field data as pos-sible to inform model development, calibration and, sub-sequently, validation. The model consists of the following
4 linked sub-model components representing:i)mosquito
population dynamics and movement, ii) human
popula-tion movement, iii) dengue virus transmission and iv)
dengue control. Each of these component parts are de-scribed in the detailed Additional file 1. In this section we focus on key approaches adopted for the design, calibra-tion and implementacalibra-tion of each part of the model.
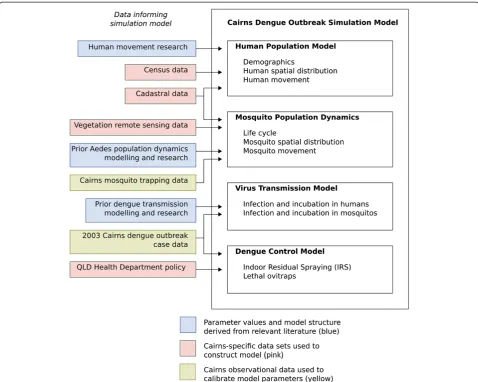
Figure 1 shows a schematic of the different sets of data that inform each of the component submodels of the complete dengue transmission model.
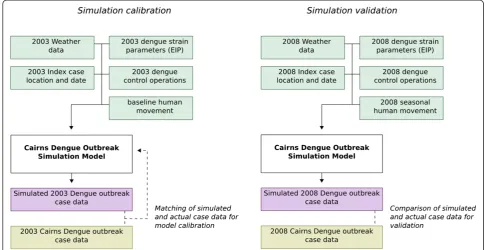
datasets (2003) was used to calibrate the model and the other dataset (2008/2009) to validate the overall model, in-cluding parameter choices arising from the calibration pro-cedure. The following schematic (Figure 2) shows the overall model and the strategy used for model calibration and validation.
Figure 2 indicates how four types of input data were used, and these data differed between the 2003 and the
2008/2009 outbreaks: i) weather data, ii) dengue strain
specific extrinsic incubation period data, iii) index case location data andiv)data describing the dengue control operations undertaken in the two outbreaks.
Model description
The overall methods applied in this study are presented in the following. A detailed desciption of all model com-ponents is given in Additional file 1.
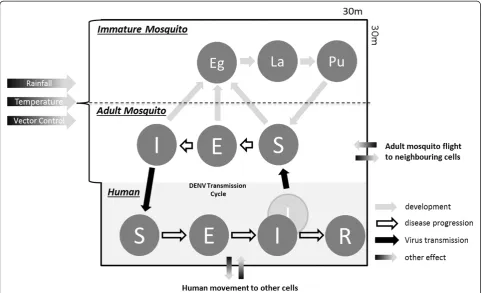
A discrete event simulation approach was adopted with both space and time being represented discretely [26]. All processes occuring in the basic spatial unit of the model (called a cell) are shown in Figure 3. Each model cell is a 30 × 30 m square and is thus smaller than the maximum known adult mosquito flight distance (usually limited to 200 m around the location of adult mosquito emergence, so permitting localised vector infection to be represented following introduction of an infectious case into that cell location [13]. This cell size corresponds to an area contain-ing (on average) 1 to 3 households in a Cairns settcontain-ing.
Human population model
[image:3.595.58.537.88.470.2]The human population part of the model is based on pre-vious models designed by Milne and colleagues but with important differences e.g., in human movement behaviour
as detailed below and in the Additional file 1 (pages S2-S7) [27-30].
The model of Cairns consists of approximately 52,000 cells (Additional file 1: Figures S2 and S4) and 56,000 human individuals. To assign a human population to the cells, two sets of data were used: i)the most recent population census from the Australian Bureau of Statistics (accessible at www.abs.gov.au, illustrated in Additional file 1: Figures S2 and S3) andii)a geo-referenced digital cadastral dataset from Cairns provided by the Department of Natural Resources and Mines of the Queensland Government (accessible at www.qld.gov.au, illustrated in Additional file 1: Figures S2 - S4).
While the census data provided information on human population age distribution (illustrated in Additional file 1: Figure S1 for all of Cairns), household sizes and the number of people per area at a high spatial resolution (Additional file 1: Figure S2 Panels A and B), the cadastral dataset spe-cified residential, commercial, industrial, educational and parklandassociated properties (Additional file 1: Figure S2 Panels C and D). This made it possible to allocate house-holds of appropriate sizes and with appropriate age distri-butions to each residential property. Thus, each human is assigned a home cell. Apart from their home cells, and depending on their age, humans may also frequent other cells. Properties classified as commercial and industrial in the cadastral dataset served as workplaces and shop-ping centres that are frequented by the human population.
Data on schools (student numbers, class sizes) were sourced from the Queensland school register (accessible at www.education.qld.gov.au) for schools in the modelled area. Appropriate virtual classes of school children, in-cluding their teachers were built and associated with the educational establishments listed in the cadastral dataset. In addition, parkland areas are also frequented by humans for recreational purposes. A single cell in the model can contain more than one property and also properties of different types (e.g. Additional file 1: Figure S4 Panel B). We assume no further boundaries between all humans allocated to a single cell (e.g., mosquito access to humans allocated to two separate households which are located in the same cell will be the same).
In the model, time progresses in a step-wise (discrete) manner and in intervals of 6 hours, i.e. infection states
and locations of humans and mosquitoes may change
every 6 hours. Each 6 hour period corresponds with a specific part of the day: i) morning (3 am to 9 am), ii)
daytime (9 am to 3 pm),iii)evening (3 pm to 9 pm) and
iv)night (9 pm to 3 am). Humans are assumed to move
between cells during the daytime and evening periods, and are assumed to be in their home cells during morn-ing and night periods.
[image:4.595.54.540.90.340.2]It has been shown that human movement is an import-ant factor facilitating the spread of dengue [31]. Detailed information on human movement is very sparse; we used the findings of a large survey of interpersonal human
contact to derive an approximate model of daily movement of individuals, which apportions each person’s time be-tween different locations [32]. This model incorporates two types of human movement.
The first type is directional and always occurs between two specific cells for a given individual. These cells arei) the individual’s home cell and ii) the individual’s work or school cell. On any given weekday of the modelled period, individuals will go from their home cells (morning) to their work or school cells (daytime) and back to their home cells (evening or night), following the approach adopted in Milne et al. [27].
The second type of human movement used in the present study is semi-random and is incorporated in the model to account for the less predictable movement which humans may undertake within the modelled area e.g., to visit friends, go shopping, or visit recreation areas. This semi-random movement can occur on week-day evenings and during the week-day and evening during weekends. Based on data from a population survey by Mossong et al. it was estimated that the frequency of random human visits of this type to other cells is
approximately 4–5 times per week per individual [32].
A schematic representation of the human movement components of the present model is shown in Additional file 1: Figure S5.
Human movement in urban areas has been shown to be semi-random and to be ranked by distance i.e., the frequency of short trips is higher than the frequency of trips to destinations that are further away [9]. In the model, this distance-dependent behaviour is modelled
with a gamma distribution of the semi-random
move-ment distances (Additional file 1: Figure S6) [27].
Mosquito population dynamics model
[image:5.595.57.540.89.382.2]The mosquito population dynamics model used in the present study is based on previously developed models by others [17,23,25,33]. The core mosquito population dy-namics model (only female adult mosquitoes) is shown in Additional file 1: Figure S7. It includes egg (E), larvae (L), pupae (P) and two adult mosquito populations (A1 and A2) as determined by the length of the first (A1) versus the lengths of the remaining (A2) gonotrophic cycles, with the first gonotrophic cycle being significantly longer than the remaining ones [16].
The mosquito population sub-model is similar to that described in previous studies but it also differs from these in a number of ways, such as details in the implementation of larvae density dependent parameters and mosquito flight [17,23,24,33]. Specific details of the mosquito popula-tion dynamics model are given in the Addipopula-tional file 1 (pages S8-S23 with Figures S7 to S23).
Weather sub-model and mosquito habitat heterogeneity
The present model used a novel approach to model weather driven mosquito population dynamics that dif-fers significantly from those used in previous studies [17,23,24,33]. The weather sub-model uses temperature, rainfall and evaporation data from Cairns (available from the Australian Bureau of Meteorology www.bom.gov.au) as input and these weather data drive the mosquito population dynamics model component.
Temperature dependent parameters of the mosquito population dynamics model (Additional file 1: Figure S7) are determined similarly to the previous studies refer-enced above (described in detail in the Additional file 1 e.g., Table S1 and Figure S21). The effect of temperature on the mosquito population is assumed to be a global ef-fect, which occurs to the same extent in all model cells. As in the previous studies, we assume that mosquito lar-vae develop in a density dependent manner, that is, their growth rate declines to a minimum as their density in-creases towards a maximum value (for further informa-tion see Addiinforma-tional file 1 pages S13 to S14 and Figures S12, S13, Table S2 and Equations S6 and S7).
To permit spatial heterogeneity within the mosquito population we assume that certain cells are better suited to support mosquito development than others. We
de-fine the minimum and maximum capacity of a model
cell to sustain mosquito larvae (Lmin and Lmax). The
minimum capacity of a cell to sustain mosquito larvae is maintained throughout the year, irrespective of rainfall and accounts for artificially watered containers present in the cell and for those containers that are shielded from evaporation. Following rainfall (in the model this is the time when the amount of rain exceeds the amount of evaporation), a cell’s capacity to sustain mosquito lar-vae increases until it eventually reaches a maximum
value (Lmax). We assume that Lmax marks the point at
which containers overflow and a cell is saturated with water, so that its capacity to sustain mosquito larvae does not increase further. We allow for a fraction of the immature mosquito stages to be washed out from over-flowing containers (Additional file 1: Figure S11 and Equation S5). The capacity of a cell to sustain mosquito larvae thus fluctuates between the Lminand Lmax values
with rainfall and evaporation and cells can hold more or less mosquito larvae depending on rainfall, which in tropical Cairns varies between wet summers and dry
winters. For detailed explanations of the weather sub-model refer to the Additional file 1 pages S9 to S15).
In contrast to previous dengue simulation models that use complicated container characteristics which need to be determined by field studies [15,16,18,33], the approach adopted here is aimed at the use of geographic informa-tion system (GIS) data to estimate spatial distribuinforma-tion of mosquito habitats. While this may be less accurate than manual classification of each container in the modelled area, it has the benefit of allowing for transfer model to other geographic locations more readily.
It is assumed that two cell-specific geographical features are positively correlated with a cell’s capacity to sustain mosquito larvae,namelyi) the degree of vegetation cover in a cell andii)the number of dwellings per cell. This as-sumption is based on previous work [34,35] and the posi-tive association found between mosquito trapping data from Cairns and these two characteristics in the present study. We assume that the number of dwellings per cell is
more important than vegetation, since it provides i)
humans, who are the source forAe. aegyptiblood feeding
and ii) human-made breeding habitats such as rainwater
tanks, underground sumps, flower pots etc. [36]. Previous studies have shown significant correlations between vegeta-tion cover and the abundance ofAe. aegyptibreeding sites in urban settings [35], in the model the presence of vegeta-tion cover adds an addivegeta-tional benefit to a cell’s capacity to sustain mosquito larvae, as it may prevent increased solar exposure and enable lower local rates of evaporation. Vege-tation features may also provide additional breeding sites such as fallen palm tree fronds which may collect water.
We introduce a breeding site abundance index (B),
which is directly proportional to the cell’s maximum
capacity to sustain mosquito larvae (Lmax~ B) and use a
relationship betweenB, the number of dwellings (D) and
vegetation cover (V) in the form of Equation 1.
B¼DþDV þBmin ð1Þ
A minimum breeding site index Bmin is present
inde-pendently from the coverage with dwellings and vegeta-tion. Additional file 1: Figure S15 shows the distribution
of the breeding site abundance indices (B) based on
Equation 1 (Equation S8). Bis normalized to between 0
As the process of assigning a mosquito breeding site abundance index to each cell does not rely on fitting-to-data, validation of this methodology was conducted using available trapping data from Cairns for the years 2006– 2013, kindly provided by Scott Ritchie (James Cook University) and Peter Cook (Monash University). We relied only on the data collected using commercially available BG traps since these are considered to be reliable [37]. Note that the available trapping data were limited to a small pro-portion of the modelled area (see Additional file 1: Figure S18 for trap locations). For further information on the val-idation process using mosquito trapping data refer to the Additional file 1 (Pages S15-S18, Figures S15-S18).
Calibration of the mosquito population dynamics model
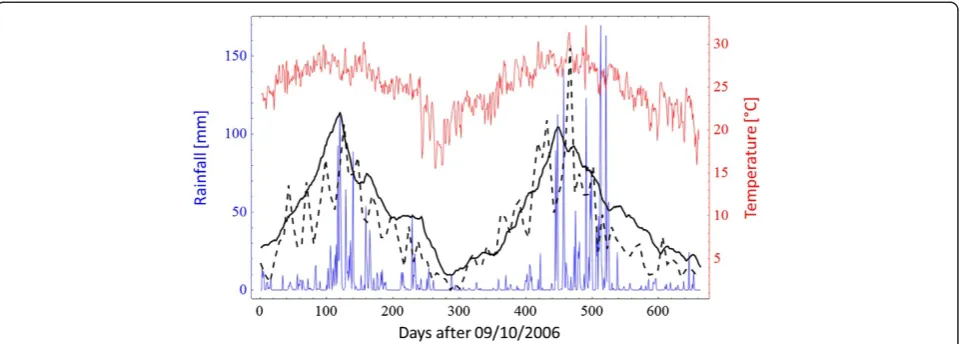
The mosquito population dynamics model was calibrated using an observed mosquito density pattern as shown in Figure 4 (Additional file 1: Figure S20) using the weather data present in the same figure as an input.
The mosquito trapping data consisted of mean number of female Ae. aegypticaptured by Biogents Sentinel traps (Figure 4; Additional file 1: Figure S20) from 09/10/2006 and 16/08/2008 [38]. During this time, no major dengue outbreaks were recorded in the modelled area, hence no significant mosquito control activities impacted on the mosquito population. A detailed description of the calibra-tion process is given in the Addicalibra-tional file 1.
Only the unknown or uncertain model parameters listed on page S22 of the Additional file 1 were used to calibrate the mosquito population dynamics model to the relative mosquito abundance across the entire modelling area as depicted in Figure 5 (Additional file 1: Figure S22). A random-walk Monte Carlo approach was used to identify the set of unknown or uncertain pa-rameters that resulted in the best fit to the mosquito trapping data.
The mosquito trapping data provides a measure of relative mosquito abundance, therefore, in Figure 5 (Additional file 1: Figure S22) mosquito trapping data and the calibrated mosquito abundance curve are pre-sented without a scale, since the absolute number of mosquitoes is unknown.
Variation ofLmax,which is the maximum cell capacity
to sustain mosquito larvae, will not change the relative shape of the calibrated curve presented in Figure 5
(Additional file 1: Figure S22). However Lmax can be
used to scale the absolute mosquito population based on the assumption that all modelled cells should follow a similar mosquito density pattern, though some are more suitable to sustain mosquito reproduction than others. Furthermore, it is assumed that absolute mosquito density should reflect an average female mosquito number of 8–24 Ae.aegyptiper property, as estimated from mosquito trap-ping and computer simulation studies in Cairns [39,40].
Since the modelled area contains approximately 28,000 properties,Lmaxwas chosen to obtain an average mosquito
number of around 2.24 × 10⁵to 6.72 × 10⁵mosquitoes in the modelled area (about 8–24 mosquitoes per dwelling). A resulting graph showing absolute mosquito abundance is shown in Additional file 1: Figure S23.
The calibrated version of the mosquito population sub-model allows for the calculation of temperature and rainfall dependent mosquito profiles for any year for which weather data are available. In years where there are large dengue outbreaks, the associated vector control programme will impact on the mosquito population beyond what may be calibrated with the pure mosquito population dynamics model presented here. Hence, only the coupled mosquito population dynamics, dengue
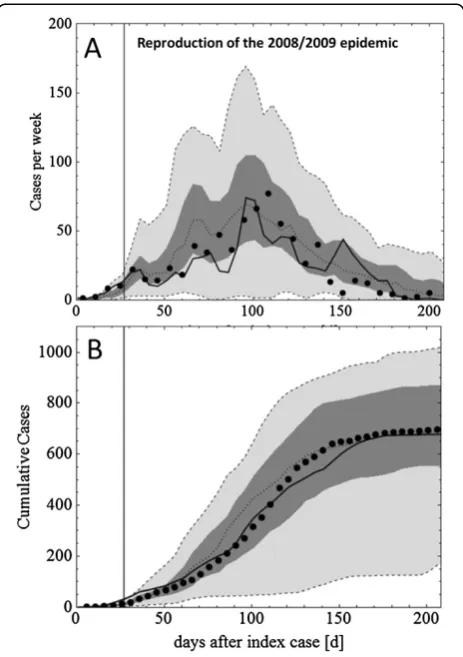
Figure 4Reproduction of the 2008/2009 epidemic.PanelA
[image:7.595.306.538.88.417.2]transmission and dengue control model can be used to es-timate mosquito population curves in years with signifi-cant dengue outbreaks.
Dengue transmission
We use a standard SEIR transmission model as done in other studies, including those modelling dengue
transmis-sion [16,25-29]. There are two components to the
trans-mission modeli)the human one andii)the mosquito one. The dengue transmission sub-model is described in detail in the Additional file 1 (pages S24-S26).
At any given time individual humans will be in one of four states, namely S susceptible, E exposed/infected, I
infectious and R recovered/immune. The model allows
for the possibility that individuals become infectious but the disease is not diagnosed or progresses asymptomati-cally (we do not further discriminate between the causes of non-detection; it may be due to misdiagnosis or the absence of symptoms). This results in individuals being
in one of two infectious states, IS symptomatic or IA
asymptomatic. A schematic representation of the hu-man population model is presented in Additional file 1: Figure S24 (and simplified in Figure 3).
Both A1 and A2 stage mosquitoes (Additional file 1: Figure S7) bite and transmit dengue virus. The infection process in the mosquitoes does not include a recovered/ immune state as it is assumed that mosquitoes remain infected until they die. A schematic representation of virus progression in the mosquito is shown in Additional file 1: Figure S25 (and simplified in Figure 3).
Note that none of the transitions between human or mosquito states described above are simple first order kinetics. Probabilities of infection from humans to
mos-quitoes PH→M and from mosquitoes to humans PM→H
will depend on the number of humans and mosquitoes co-located in a cell, resulting in these transitions being stochastic processes based on sampling from binomial distributions. Intrinsic incubation times and human
re-covery rates are gamma distributed which makes early
progression less likely [41]. The extrinsic incubation pe-riods in mosquitoes (Additional file 1: Figure S26) are
sampled from temperature dependent log-normal
distri-butions based on studies by Chan et al. [42].
Control measures
The model implements conventional means of vector control that are used in Cairns to eliminate dengue
spread during outbreaks. These include i) within-house
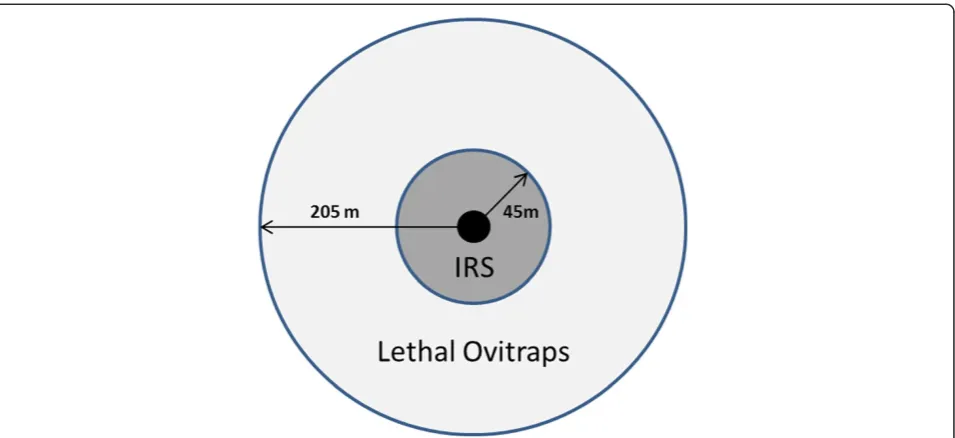
residual spraying (IRS) and larvicide treatment around case properties and the properties immediately adjacent and ii)the use of lethal ovitraps to kill egg-laying adults in extended areas around case properties. The control model is represented schematically in Figure 6 (Additional file 1: Figure S27).
It is assumed, that, following report of a case (i.e. that an infected, symptomatic case has occurred in a cell) IRS and ovitrap distribution would commence with an average lag time of 7 days [10].
IRS and larvicide treatment in the immediate vicinity of a case is known to be highly effective, killing an estimated 90% of all adult and immature mosquito stages present in the case cell and the 8 surrounding cells per day [43]. In the model it is assumed that the effect remains active for 6 weeks and affects all mosquitoes entering the cell during that time.
[image:8.595.59.540.89.261.2]Lethal ovitraps have also been shown to be effective in controlling Ae. aegypti. [44]. Their deployment is faster than the more labour intensive IRS and larvicide treatment
[45]. It is assumed that ovitraps are deployed at a certain rate per day in the cells within a 200 m radius of a case (depending on the amount of resources committed to fight a dengue outbreak, this rate may be high or low). Ovitraps kill approximately 20-30% of adult mosquitoes per cell per day [44]. The overall effect of lethal ovitraps is reduced due to the emergence of new mosquitoes, as we assume that le-thal ovitraps only target the adult stage.
It is assumed that there are limitations on coverage and number of IRS premises treated and ovitraps deployed each day, depending on the size and number of available dengue response teams (i.e. human resources). If the re-quired number of cells to be treated exceeds the max-imum number treatable per day, the remaining cells that are left untreated are carried over to the next day.
The parameters were chosen to be consistent with the current dengue response plan of Queensland Health [45]. However, one of the capabilities of the model is to allow an analysis of alternative control strategies. Table 1 outlines all parameters used in the control part of the model.
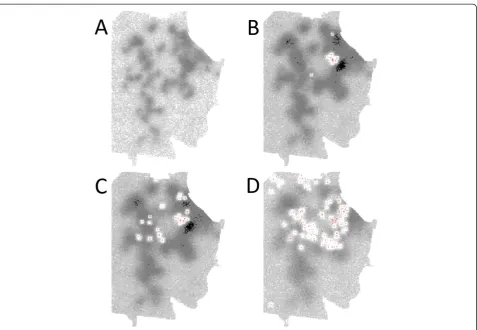
An example of the effect of vector control on the mos-quito population in the model is illustrated in Figure 7 (Additional file 1: Figure S28).
Further information on the dengue control sub-model may be found in the Additional file 1.
Model calibration using dengue outbreak data
The dengue transmission and control components of the model were calibrated by fitting to a well-documented DENV 2 dengue virus outbreak in Cairns in 2003 [10]. This calibration was performed by running repeated simulations and gradually adjusting parameters until a
[image:9.595.61.539.88.307.2]close match between simulated and actual outbreak data was achieved. This process occurred as follows: firstly, uncertain dengue specific parameters (e.g. human to mosquito and mosquito to human transmission prob-abilities) were used to calibrate the model to the unmiti-gatedinitial phase of the outbreak, where dengue spread was not affected by subsequent control. Secondly, the model was calibrated using the entire 2003 outbreak data by adjusting other uncertain parameters related to the control measures, such as the lag between infection of a case and control measures targeting the location of that case. Figure 8 shows the resulting calibrated out-break curves.
Figure 6For any reported/symptomatic dengue case, two control mechanisms are invoked.In-house residual spraying and larvicide treatment are used within the case cell (black dot) and adjacent cells (dark grey). Lethal ovitraps are placed in the wider radius around the case cell.
Table 1 Parameters used in the vector control part of the model
IRS + Larviciding
Effect radius 45 m QH Dengue Management Plan
Efficacy 90% per
day
QH Dengue Management Plan, [43]
Duration 6 weeks [12]
Maximum cells treatable per day
15 [37]
Lethal Ovitraps
Effect radius 205 m QH Dengue Management Plan
Efficacy 20% per
day
[44]
Duration 4 weeks [44]
Maximum cells treatable per day
[image:9.595.305.539.557.734.2]Sensitivity analyses
Sensitivity analyses for the main model parameters are presented in Table 2. It is shown that, as can be ex-pected, the model is highly sensitive to the mosquito bit-ing rate. It can also be seen from the sensitivity analyses that both human and mosquito movement are important factors that drive the spread of infection.
Results
Model validation
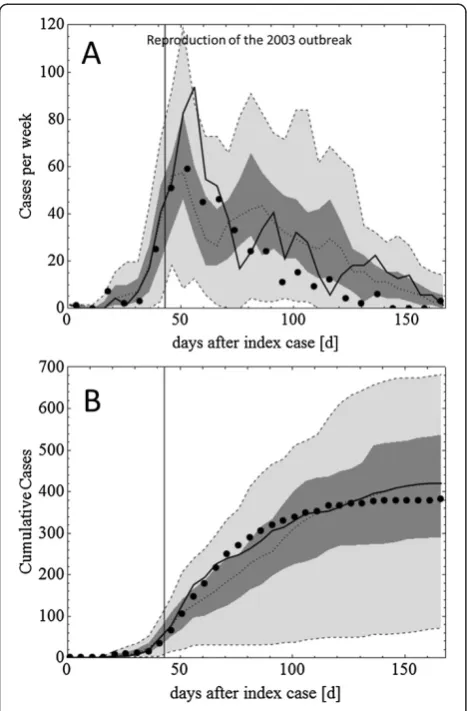
Following calibration of the model using the 2003 dengue outbreak data, the model was applied to a subsequent, lar-ger epidemic which occurred in Cairns in 2008/2009 (see Figure 4). The 2008/2009 epidemic caused nearly 700 cases in the modelled area, twice as many as the 2003 out-break. Ritchie et al. [7] discuss several factors that are thought to have contributed to the explosive expansion of the epidemic in late 2008 and its rapid collapse in April 2009. These contributing factors are: i) climatic factors
(an unusually warm period in November 2008),ii)dengue
virus related factors, specifically the shorter extrinsic incu-bation period of the DENV3 strain that caused the 2008/ 09 epidemic, compared to the 2003 DENV2 outbreak [7], iii)human factors, specifically the increased human move-ment over the Christmas period andiv)the declaration of the outbreak to be an epidemic, invoking a significant ex-pansion of control measures in January 2009 [7].
[image:10.595.61.539.86.416.2]Using the simulation model it was demonstrated that all of these factors may have acted together to cause the larger scale of outbreak which occurred in 2008/2009 compared to previous dengue outbreaks in Cairns, though some of these factors may have played a more significant role than others. Applying the 2008/2009 temperature profile re-sulted in an average predicted extrinsic incubation period that was approximately 1 day (0.75 days) shorter than that in 2003. Furthermore, the rainfall pattern in 2008/2009 did not result in a greater predicted mosquito population than in 2003, which is in agreement with mosquito trapping data [7]. As a result, climatic factors alone did not increase the simulated case numbers significantly.
In contrast, simulation experiments demonstrated that the shorter extrinsic incubation period of the specific DENV3 strain that caused the 2008/2009 epidemic (as discussed in [7]) allowed a transmission cycle to be com-pleted in approximately 10 days compared to 17 days in 2003, causing a considerable rise in case numbers and an epidemic that could not be controlled using the initial (2003-based) control measures. The modelled outbreak with significantly increased control measures activated indicated that it was the expansion of control interven-tions starting in January 2009, following declaration of the outbreak as an epidemic, which caused the decline
[image:11.595.57.291.88.444.2]in weekly case numbers and eventually a rapid collapse of the outbreak. Experiments using the model with the control measures set at the lower 2003-like level resulted in a much longer outbreak which relied on seasonal weather changes before the outbreak was contained, confirming the need for the increased response mea-sures. Increased human movement over the Christmas period (in the model, the month of December) only slightly altered the overall case numbers (by an average of about 50 cases in total).
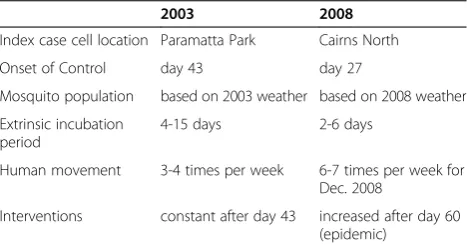
Table 3 shows the conditions in 2008/2009 that re-sulted in the best reproduction of the epidemic using the simulation model. The shorter EIP had by far the most significant effect Simulated weekly cases and cu-mulative cases for the 2008/2009 epidemic are shown in Figure 4.
Successful application of the model in reproducing the 2008/2009 epidemic can be seen as a validation of the overall model as well as the settings used for the key model parameters, which were uncertain prior to calibration with the earlier 2003 outbreak data. Time lapse representations of the 2003 and 2008/2009-like outbreaks are presented in the Additional file 2 and Additional file 3, respectively.
Following its development and testing, the model was used to investigate how changes to control measures affect 2003-like and 2008/2009-like outbreaks, providing guidance for the management of future outbreaks.
Effect of variation of activation of control measures
A study by Vasquez-Prokopec et al. [46] investigated the consequences of delayed onset of vector control mea-sures for the same 2003 and 2008/2009 outbreaks, using a simpler non-spatial model and found a dramatic in-crease in total case numbers as a result of delays in the initiation of control measures [46]. Similar scenarios were investigated using the simulation model presented here, where two alternative control scenarios were com-pared with the original 2003 and the 2008/2009 out-breaks. These scenarios were characterised by either a
2 week earlier onset of (otherwise unchanged) control
measures or a 2 weekdelayed onsetof the control
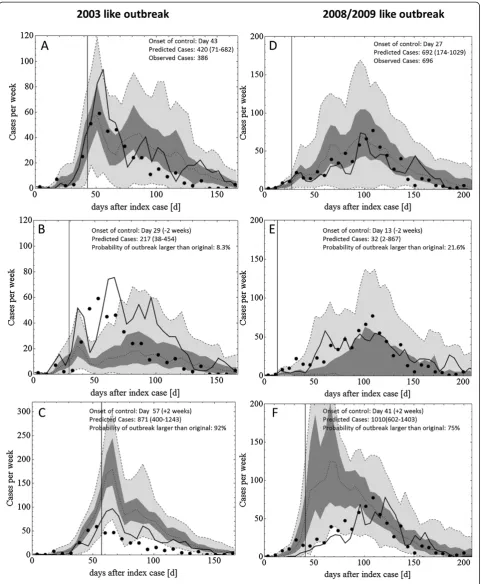
mea-sures. Figure 9 shows the predicted scale of the outbreak when initiation of control measures is varied +/−2 weeks from the actual starting time.
The results are in agreement with the previous study by Vasquez-Prokopec et al. [46], showing that variation of the start date of vector control had a major impact of the overall scale of the simulated outbreaks. In simula-tions of 2003-like outbreaks, initiating vector control 2 weeks earlier than that which occurred in the actual outbreak reduced the median number of cases by ~50%. Starting control 2 weeks later than the original start date approximately doubled the predicted median number of
cases. In all scenarios the control measures were able to reduce weekly case numbers by a similar amount and within a similar time-frame as that observed in the ori-ginal outbreaks (approximately 150 and 200 days re-spectively for 2003 and 2008/2009).
In the simulations of a 2008/2009-like epidemic, a 2 week earlier onset of vector control reduced the me-dian case number to 32 (from 692), a reduction of nearly 20 fold. This large difference is due to the very early on-set of control (day 13 after index case was diagnosed), resulting in onward transmission having failed to spread beyond a 200 m radius of the index case. The location of the index case was an area where control measures were actively applied, eradicating almost all mosquitoes within a couple of days (compare e.g., Figure 7 or Additional file 2 and Additional file 3). As with the 2003 simulations, lengthening the unmitigated phase of the 2008/2009-like epidemic approximately doubled case numbers but did not prolong the overall duration of the outbreak, which corresponds with previously published estimates by Vasquez-Prokopec et al. [46].
Effect of increased interventions
The model was further applied to investigate the effect which expanded IRS spraying and ovitrap placement would have on 2003-like and a 2008-like outbreaks, where the date of intervention initiation remains un-changed. These experiments were performed as an illus-tration of the capability of the model to replicate the effect of altered control strategies. The radius of IRS ap-plication around the case property was extended to 100 m and the radius of lethal ovitrap placement was ex-tended to 300 m. Furthermore, the capacity for IRS and lethal ovitrap placement was increased from 15 per day to 30 per day and from 150 per day to 300 per day,
respectively. The results of the experiments are pre-sented in Figure 10.
Figure 10 illustrates that expanded control measures substantially reduce the scale of the simulated outbreaks, but that they do not reduce overall case numbers as ef-fectively as shortening the delay in the onset of control, as described above. Such increased control measures caused a ~30% reduction in predicted case numbers in the 2003-like scenario and a ~60% reduction in the 2008/2009-like scenario.
Sensitivity analysis
[image:12.595.57.544.102.281.2]Sensitivity analyses of the model parameters such as biting rate, fraction of asymptomatic infections, mosquito to hu-man transmission probability and huhu-man to mosquito transmission probability were conducted. The values of the relevant model parameters have been adjusted, and the simulation model rerun, to determine the sensitivity of the model to particular parameter settings. While particu-lar parameters were adjusted, no model recalibration took
Table 2 Sensitivity of the model to A: Main model parameters and B: Alternate settings
A
2003 2008/2009
Parameter variation +50% −50% +50% −50%
Biting rate 1261(717–1719) 48(10–117) 2471(1984–2930) 14(2–61)
Asymptomatic fraction 362(172–527) 516(165–818) 743(370–938) 698(100–1086)
Mosquito to human transmission probability 461(138–746) 217(18–349) 794(4–1183) 194(3–390)
Human to mosquito transmission probability 564(291–828) 355(160–538) 880(501–1355) 439(25–779)
B
Alternate Setting
No mosquito mobility 34(6–152) 99(3–421)
No human mobility 104(28–184) 19(6–58)
No state of emergency N/A 1479(440–2202)
Index cell with low mosquito density 12(1–26) 4(1–30)
[image:12.595.305.539.608.732.2]The values in the table appearing in bold are medians of 60 simulations, with 95% confidence intervals given in parentheses. For comparison the predicted case number without any parameter variation for 2003 and 2008/2009 were 420 (71–682) and 692 (174–1029) respectively (see e.g. Figure9A and D in the main manuscript).
Table 3 Differences between the 2003 and 2008/09 outbreak scenarios accounted for in the present study
2003 2008
Index case cell location Paramatta Park Cairns North
Onset of Control day 43 day 27
Mosquito population based on 2003 weather based on 2008 weather
Extrinsic incubation period
4-15 days 2-6 days
Human movement 3-4 times per week 6-7 times per week for Dec. 2008
place. The outcomes, for the 2003 and 2008/2009 out-breaks, are presented in Table 2.
Discussion
The model has been customised for the Cairns setting, however we believe that the underlying modelling methods will be applicable to other settings. In the fu-ture, an aim will be to explore how the modelling ap-proach presented here can be applied to other urban dengue transmission settings such as areas with endemic dengue, areas with different population structures, and to larger cities. With appropriate re-parameterisation,
the model may also be applicable to other Ae. aegypti
(and Ae. albopictus) vectored viruses such as chikun-gunya [47]. The transfer of the model structure to other geographic locations will depend upon on the availability of data, which was extensive in the case of Cairns (a table of required data sources is given in Additional file 1: Table S4). Furthermore, a transfer of the model to a location endemic for dengue may also require changes to the model structure by introducing measures for herd immunity or properties of multiple circulating dengue strains [34].
This study highlights a direction of vector-borne infec-tious disease modelling away from compartmentalised population-based, spatially-homogenous approaches to-wards individual-based, spatially-explicit techniques, a move also evident in modelling studies focused on other vector-borne diseases such as malaria [48,49].
A key goal in developing the model has been to capture the most important features of mosquito population dy-namics, relevant human behaviour, dengue transmission and control without making the model overly and un-necessarily complex. It has been recognized that a chal-lenge with developing complex models such as that presented here is to avoid the temptation to make them unnecessarily overcomplicated, as discussed by Basu et al. [50]. The model presented here simplifies certain aspects of the physical world being modelled, usually due to limi-tations of data availability. These limilimi-tations include: i) lack of detailed mosquito trapping data prevented the de-velopment of a more detailed mosquito density layer, ii) simplified human movement (e.g., the use of semi-random movement is only a rough approximation of reality), iii)
[image:14.595.71.528.90.103.2]simplified mosquito movement (it may be that mosquitoes do not fly randomly but are directed by various factors such as availability of humans, wind direction etc.), iv) simplified effect and dynamics of vector control (lag time between a case and local control may vary on a case-by-case basis, properties may only be partially treated etc.),v)abstraction of mosquito breeding sites (we do not model every individual container that may serve as a
Figure 10Effect of expanded vector control on the scale of a 2003-like outbreak (Panel A) and a 2008/2009-like outbreak (Panel B).Black dots are the observed data, solid black lines are the best stochastic realisations, black dotted lines the median case numbers, dark grey areas are interquartile ranges, light grey areas are 95% confidence intervals.
[image:14.595.305.539.319.664.2](See figure on previous page.)
breeding site as with the CIMSIM/DENSIM models) [38]. The model is less detailed in the way it accounts for the presence of mosquito breeding sites compared to the CIMSIM/DENSIM approach, yet in the light of recent findings that some of the detail incorporated into the CIMSIM mosquito population dynamics model may be superfluous this approach seems justified [18]. The valid-ation of the model using high-quality data from a different outbreak to that used to calibrate uncertain model param-eters suggests that the level of abstraction adopted is ap-propriate, and results in a modelling framework which will be capable of use to examine the effectiveness of new intervention strategies as well as helping to explain phe-nomena contributing to the conditions necessary for den-gue to become endemic in Cairns-like settings.
This study describes the development of a complex, spatially-explicit and individual-based dengue transmis-sion model, and makes use of spatio-temporal dengue outbreak data in a novel way to demonstrate that such a model is capable of simulating dengue outbreaks of the type that occur in Cairns, along with the intervention measures used to control them. The study clearly shows the need for high quality outbreak field data to inform and parameterize the model. If such data are available, as was the case in the present study, such a simulation model can be adequately calibrated.
This study presents a dengue modelling framework and highlights how key features of the physical system may be represented in a simulation model. While this modelling methodology has been validated by showing that the system as a whole reproduces the outbreak dy-namics of a single dengue epidemic, the availability of new field data will permit further model validation and future model refinement, aiming at making the system more physically realistic. New field data collection will permit further validation of the system as a whole, and for the separate validation of each sub-model that makes up the overall modelling environment.
Limitations of this study include the fact that the
model assumes a population centre that experiences
epi-sodicdengue outbreaks, and not populations where den-gue is endemic. As such, it is assumed that the human population has no immunity to dengue, and that only one dengue strain is present during the outbreak. How-ever the methods used to incorporate the necessary sub-models within the Cairns dengue model will also be applicable to the construction of models where dengue is endemic. Another limitation of the study was that Ae. aegypti trapping data was only available for a lim-ited part of the Cairns urban area; availability of com-prehensive mosquito trapping data would allow for further refinement of the spatially-heterogeneous vector
habitat sub-models. Based on the Ae. aegypti trapping
data, it was assumed rainfall was the main driver of the
availability of larval habitats, and thus adult population densities. In other geographical locations (for example, where rainfall is uniform throughout the year) other factors may determine the availability of larval habitats and Ae. aegypti population dynamics. While detailed data on human movement is sparse and our use of a daily cycle of moving to work or school captures regu-lar patterns of human movement within a community, our simple semi-random model of other types of (longer range) human movement could be refined if new reliable experimental data becomes available. Finally, we note that each sub-model which contributes to the overall model is based on the best available data and on expert-informed assumptions where experimental data is not available. Fur-ther analyses could be conducted to explore the sensitivity of the model to alternative plausible assumptions about, for example, human movement patterns, or factors deter-mining the spatial heterogeneity of larval habitats.
Conclusion
This study was aimed at developing an individual-based, spatially-explicit model for dengue transmission in an urban environment. This research was facilitated by prior development of mosquito population dynamics models by others [15-25,38,51,52] and research studies describing
and quantifying Ae. aegyptientomology and dengue
out-breaks, virus properties and the impact of vector control in Cairns [7,10,12,13,36,39,40,44,52-55]. Specific goals of the study were to produce a simulation modelling frame-work that could (a) make use of rich dengue outbreak data sets for calibration and validation; (b) would be capable of investigating hypotheses explaining the size of the 2008/ 2009 Cairns outbreak; and (c) would incorporate phenom-ena essential to the prediction of future dengue outbreaks and analysis of dengue control measures, viz. weather-dependent vector population dynamics, spatially heteroge-neous vector habitat, spatially targeted vector control, and human host movement.
In order to achieve these goals, the resulting model
con-tains a number of key features. These include: i)human
and mosquito movement and realistic population
struc-tures, ii) weather-dependent (temperature and rainfall)
spatially heterogeneous mosquito population dynamics,
iii)geographically and demographically- dependent
mos-quito abundance, iv) spatially- explicit vector control, v) model calibration using outbreak data andvi)model valid-ation against further outbreak data. The resulting simula-tion model is complex, consisting of several interacting sub-models. However, this complexity isnecessary, and is required in order to represent the inherently complex physical phenomena which contribute to dengue trans-mission and the scale and timing of dengue epidemics.
(formulated previously) aimed at explaining the large-scale epidemic which occurred in 2008/2009 [7]. Specifically, while warmer weather and increased human movement had only a small effect on the spread of the virus, a shorter virus strain-specific extrinsic incubation time can explain the observed explosive outbreak of 2008/2009 [7]. In agree-ment with previous studies, the simulation results pre-sented here highlight the importance of rapid diagnosis of potential index cases and prompt initiation of vector con-trol, as presented above in Figure 9 [46].
This study, in combination with several previous dengue modelling studies, highlights the importance of spatial and individual-based modelling approaches in order to ac-count for local differences in mosquito and human density and differences in human movement behaviour depending on age and other factors [18,31,56]. This study confirms some previously known spatial phenomena, such as hu-man movement and mosquito movement, which facilitate dengue spread (see sensitivity analyses in Table 2, where such movement has been excluded, dramatically reducing simulated case numbers) [31,56].
The availability of this model will allow further investi-gation of the effect of different intervention strategies which target various stages of the transmission cycle, such as the effect of potential dengue vaccines, and may also assist with predicting the effect of the release of Wolbachia infected mosquitoes on the native mosquito population, as is currently occurring in Cairns [57].
Additional files
Additional file 1:Detailed description of all model components. Additional file 2:Animation of simulated 2003 Dengue outbreak, showing mosquito density in grey and human Dengue cases in red. Additional file 3:Animation of simulated 2008/9 Dengue outbreak, showing mosquito density in grey and human Dengue cases in red.
Competing interests
The authors declare that they have no competing interests.
Authors’contributions
SK, NH, JK and GM were responsible for the conception and design of the model and simulation experiments. NH and SK were responsible for simulation model implementation. NH conducted simulation experiments. SK conducted data analyses. SR provided input data. All authors were involved in the analysis of simulation results and writing the manuscripts. All authors read and approved the final manuscript.
Acknowledgements
Mosquito trapping data was kindly provided by Peter Cook and David Parkington (Monash University, Melbourne, Australia). Gonzalo Vasquez-Prokopec (Emory University, Atlanta, Georgia, USA) kindly provided geo-referenced and de-identified dengue case data. This study has been funded by the University of Western Australia.
Author details
1
School of Computer Science and Software Engineering, The University of Western Australia, 35 Stirling Highway, Crawley, Perth, WA 6009, Australia. 2
School of Public Health, Tropical Medicine & Rehabilitation Sciences, James Cook University, Cairns, Queensland, Australia.
Received: 5 June 2014 Accepted: 13 August 2014 Published: 20 August 2014
References
1. Gubler DJ, Clark GG:Dengue/dengue hemorrhagic fever: the emergence of a global health problem.Emerg Infect Dis1995,1(2):55–57.
2. Rigau-Perez JG, Clark GG, Gubler DJ, Reiter P, Sanders EJ, Vorndam AV: Dengue and dengue haemorrhagic fever.Lancet1998,352(9132):971–977. 3. Bhatt S, Gething PW, Brady OJ, Messina JP, Farlow AW, Moyes CL, Drake JM, Brownstein JS, Hoen AG, Sankoh O, Myers MF, George DB, Jaenisch T, Wint GRW, Simmons CP, Scott TW, Farrar JJ, Hay SI:The global distribution and burden of dengue.Nature2013,496(7446):504–507.
4. Giatropoulos A, Emmanouel N, Koliopoulos G, Michaelakis A:A study on distribution and seasonal abundance of Aedes albopictus (Diptera: Culicidae) population in Athens, Greece.J Med Entomol2012,49(2):262–269. 5. Sousa CA, Clairouin M, Seixas G, Viveiros B, Novo MT, Silva AC, Escoval MT,
Economopoulou A:Ongoing outbreak of dengue type 1 in the Autonomous Region of Madeira, Portugal: preliminary report.Euro Surveill2012,17(49). 6. Pongsumpun P, Garcia Lopez D, Favier C, Torres L, Llosa J, Dubois MA:
Dynamics of dengue epidemics in urban contexts.Trop Med Int Health 2008,13(9):1180–1187.
7. Ritchie SA, Pyke AT, Hall-Mendelin S, Day A, Mores CN, Cristofferson RC, Gubler DJ, Bennett SN, van den Hurk AF:An explosive epidemic of DENV-3 in Cairns, Australia.PLoS One2013,8(7):e68137.
8. Anderson R, May R:Infectious diseases of humans: dynamics and control. Oxford: Oxford University Press; 1991:768.
9. Grassly NC, Fraser C:Mathematical models of infectious disease transmission.Nat Rev Microbiol2008,6:477–487.
10. Vazquez-Prokopec GM, Kitron U, Montgomery B, Horne P, Ritchie SA: Quantifying the spatial dimension of dengue virus epidemic spread within a tropical urban environment.PLoS Negl Trop Dis2008,4(12):e920. 11. Duncombe J, Clements A, Davis J, Hu W, Weinstein P, Ritchie S:Spatiotemporal patterns of Aedes aegypti populations in Cairns, Australia: assessing drivers of dengue transmission.Trop Med Int Health2013,18(7):839–849.
12. Ritchie SA, Long S, Smith G, Pyke A, Knox TB:Entomological investigations in a focus of dengue transmission in Cairns, Queensland, Australia, by using the sticky ovitraps.J Med Entomol2004,41(1):1–4.
13. Russell RC, Webb CE, Williams CR, Ritchie SA:Mark-release-recapture study to measure dispersal of the mosquito Aedes aegypti in Cairns, Queensland, Australia.Med Vet Entomol2005,19(4):451–457.
14. McMeniman CJ, O'Neill SL:A virulent Wolbachia infection decreases the viability of the dengue vector Aedes aegypti during periods of embryonic quiescence.PLoS Negl Trop Dis2010,4(7):e748.
15. Ellis AM, Garcia AJ, Focks DA, Morrison AC, Scott TW:Parameterization and sensitivity analysis of a complex simulation model for mosquito population dynamics, dengue transmission, and their control. Am J Trop Med Hyg2011,85(2):257–264.
16. Focks DA, Daniels E, Haile DG, Keesling JE:A simulation model of the epidemiology of urban dengue fever: literature analysis, model development, preliminary validation, and samples of simulation results. Am J Trop Med Hyg1995,53(5):489–506.
17. Focks DA, Haile DG, Daniels E, Mount GA:Dynamic life table model for Aedes aegypti (diptera: Culicidae): simulation results and validation. J Med Entomol1993,30(6):1018–1028.
18. Legros M, Magori K, Morrison AC, Xu C, Scott TW, Lloyd AL, Gould F: Evaluation of location-specific predictions by a detailed simulation model of Aedes aegypti populations.PLoS One2011,6(7):e22701. 19. Xu C, Legros M, Gould F, Lloyd AL:Understanding uncertainties in
model-based predictions of Aedes aegypti population dynamics. PLoS Negl Trop Dis2010,4(9):e830.
20. Barmak DH, Dorso CO, Otero M, Solari HG:Dengue epidemics and human mobility.Phys Rev E Stat Nonlin Soft Matter Phys2011,84:011901. 21. Barmak DH, Dorso CO, Otero M, Solari HG:Modelling interventions during
a dengue outbreak.Epidemiol Infect2014,142(3):545–561.
22. Otero M, Barmak DH, Dorso CO, Solari HG, Natiello MA:Modeling dengue outbreaks.Math Biosci2011,232:87–95.
23. Otero M, Schweigmann N, Solari HG:A stochastic spatial dynamical model for Aedes aegypti.Bull Math Biol2008,70(5):1297–1325.
25. Otero M, Solari HG, Schweigmann N:A stochastic population dynamics model for Aedes aegypti: formulation and application to a city with temperate climate.Bull Math Biol2006,68(8):1945–1974.
26. Zeigler BP:Theory of Modeling and Simulation.2nd edition. London: Academic Press; 2000.
27. Milne GJ, Kelso JK, Kelly HA, Huband ST, McVernon J:A small community model for the transmission of infectious diseases: comparison of school closure as an intervention in individual-based models of an influenza pandemic.PLoS One2008,3(12):e4005.
28. Halder N, Kelso JK, Milne GJ:Cost-effective strategies for mitigating a future influenza pandemic with H1N1 2009 characteristics. PLoS One2011,6(7):e22087.
29. Kelso JK, Halder N, Milne GJ:The impact of case diagnosis coverage and diagnosis delays on the effectiveness of antiviral strategies in mitigating pandemic influenza A/H1N1 2009.PLoS One2010,5(11):e13797. 30. Milne GJ, Baskaran P, Halder N, Karl S, Kelso J:Pandemic influenza in Papua
New Guinea: a modelling study comparison with pandemic spread in a developed country.BMJ Open2013,3(3):e002518.
31. Stoddard ST, Forshey BM, Morrison AC, Paz-Soldan VA, Vazquez-Prokopec GM, Astete H, Reiner RC, Vilcarromero S, Elder JP, Halsey ES, Kochel DJ, Kitron U, Scott TW:House-to-house human movement drives dengue virus transmission.Proc Natl Acad Sci U S A2013,110(3):994–999. 32. Mossong J, Hens N, Jit M, Beutels P, Auranen K, Mikolajczyk R, Massari M,
Salmaso S, Tomba GS, Wallinga J, Heijne J, Sadkowska-Todys M, Rosinska M, Edmunds WJ:Social contacts and mixing patterns relevant to the spread of infectious diseases.PLoS Med2008,5:e74.
33. Focks DA, Haile DG, Daniels E, Mount GA:Dynamic life table model for Aedes aegypti (Diptera: Culicidae): analysis of the literature and model development.J Med Entomol1993,30(6):1003–1017.
34. Chao DL, Halstead SB, Halloran ME, Longini IM Jr:Controlling dengue with vaccines in Thailand.PLoS Negl Trop Dis2012,6(10):e1876.
35. Vezzani D, Velazquez SM, Soto S, Schweigmann NJ:Environmental characteristics of the cemeteries of Buenos Aires City (Argentina) and infestation levels of Aedes aegypti (Diptera: Culicidae).Mem Inst Oswaldo Cruz2001,96(4):467–471.
36. Hanna JN, Ritchie SA, Merritt AD, van den Hurk AF, Phillips DA, Serafin IL, Norton RE, McBride WJ, Gleeson FE, Poidinger M:Two contiguous outbreaks of dengue type 2 in north Queensland.Med J Aust1998, 168(5):221–225.
37. Williams CR, Long SA, Russell RC, Ritchie SA:Field efficacy of the BG-Sentinel compared with CDC Backpack Aspirators and CO2-baited EVS traps for collection of adultAedes aegyptiin Cairns, Queensland, Australia. J Am Mosq Control Assoc2006,22(2):296–300.
38. Azil AH, Long SA, Ritchie SA, Williams CR:The development of predictive tools for pre-emptive dengue vector control: a study of Aedes aegypti abundance and meteorological variables in North Queensland, Australia. Trop Med Int Health2010,15(10):1190–1197.
39. Williams CR, Johnson PH, Ball TS, Ritchie SA:Productivity and population density estimates of the dengue vector mosquito Aedes aegypti (Stegomyia aegypti) in Australia.Med Vet Entomol2013,27(3):313–322. 40. Ritchie SA, Montgomery BL, Hoffmann AA:Novel estimates of Aedes
aegypti (Diptera: Culicidae) population size and adult survival based on Wolbachia releases.J Med Entomol2013,50(3):624–631.
41. Wearing HJ, Rohani P, Keeling MJ:Appropriate models for the management of infectious diseases.PLoS Med2005,2:e174.
42. Chan M, Johansson MA:The incubation periods of Dengue viruses.PLoS One2012,7(11):e50972.
43. Esu E, Lenhart A, Smith L, Horstick O:Effectiveness of peridomestic space spraying with insecticide on dengue transmission; systematic review. Trop Med Int Health2010,15(5):619–631.
44. Rapley LP, Johnson PH, Williams CR, Silcock RM, Larkman M, Long SA, Russell RC, Ritchie SA:A lethal ovitrap-based mass trapping scheme for dengue control in Australia: II. Impact on populations of the mosquito Aedes aegypti.Med Vet Entomol2009,23(4):303–316.
45. ᅟ:Queensland Dengue Mangement Plan 2010–2015. Fortitude Valley: Queensland Health; 2011.
46. Vazquez-Prokopec GM, Chaves LF, Ritchie SA, Davis J, Kitron U:Unforeseen costs of cutting mosquito surveillance budgets.PLoS Negl Trop Dis2010, 4(10):e858.
47. Ruiz-Moreno D, Vargas IS, Olson KE, Harrington LC:Modeling Dynamic Introduction of Chikungunya Virus in the United States.PLoS Negl Trop Dis2012,6(11):e1918.
48. Gurarie D, Karl S, Zimmerman PA, King CH, St Pierre TG, Davis TME: Mathematical modeling of malaria infection with innate and adaptive immunity in individuals and agent-based communities.PLoS One2012, 7(3):e34040.
49. Filipe JAN, Riley EM, Drakeley CJ, Sutherland CJ, Ghani AC:Determination of the Processes Driving, the Acquisition of Immunity to Malaria Using, a Mathematical Transmission Model.PLoS Comput Biol2007,3(12):e255. 50. Basu S, Andrews J:Complexity in Mathematical Models of Public Health
Policies: A Guide for Consumers of Models.PLoS Med2013,10(10): e1001540.
51. Bannister-Tyrrell M, Williams C, Ritchie SA, Rau G, Lindesay J, Mercer G, Harley D:Weather-driven variation in dengue activity in Australia examined using a process-based modeling approach.Am J Trop Med Hyg 2013,88(1):65–72.
52. Williams CR, Johnson PH, Long SA, Rapley LP, Ritchie SA:Rapid estimation of Aedes aegypti population size using simulation modeling, with a novel approach to calibration and field validation.J Med Entomol2008, 45(6):1173–1179.
53. Ritchie SA, Hanna JN, Selvey CE, Russell RC:To the Editor: Spatial incidence of dengue infections in Queensland, Australia.Epidemiol Infect2013, 141(3):618.
54. Ritchie SA, Rapley LP, Williams C, Johnson PH, Larkman M, Silcock RM, Long SA, Russell RC:A lethal ovitrap-based mass trapping scheme for dengue control in Australia: I. Public acceptability and performance of lethal ovitraps.Med Vet Entomol2009,23(4):295–302.
55. Williams CR, Long SA, Webb CE, Bitzhenner M, Geier M, Russell RC, Ritchie SA:Aedes aegypti population sampling using BG-Sentinel traps in north Queensland Australia: statistical considerations for trap deployment and sampling strategy.J Med Entomol2007,44(2):345–350.
56. Liebman KA, Stoddard ST, Morrison AC, Rocha C, Minnick S, Sihuincha M, Russell KL, Olson JG, Blair PJ, Watts DM, Kochel T, Scott TW:Spatial dimensions of dengue virus transmission across interepidemic and epidemic periods in Iquitos, Peru (1999–2003).PLoS Negl Trop Dis2012, 6(2):e1472.
57. Hoffmann AA, Montgomery BL, Popovici J, Iturbe-Ormaetxe I, Johnson PH, Muzzi F, Greenfield M, Durkan M, Leong YS, Dong Y, Cook H, Axford J, Callahan AG, Kenny N, Omodei C, McGraw EA, Ryan PA, Ritchie SA, Turelli M, O’Neill SL:Successful establishment of Wolbachia in Aedes populations to suppress dengue transmission.Nature2011, 476(7361):454–U107.
doi:10.1186/1471-2334-14-447
Cite this article as:Karlet al.:A spatial simulation model for dengue virus infection in urban areas.BMC Infectious Diseases201414:447.
Submit your next manuscript to BioMed Central and take full advantage of:
• Convenient online submission • Thorough peer review
• No space constraints or color figure charges • Immediate publication on acceptance
• Inclusion in PubMed, CAS, Scopus and Google Scholar
• Research which is freely available for redistribution