1
DEVELOPMENT OF A PROTOTYPE PRECISION SPOT SPRAY SYSTEM USING IMAGE ANALYSIS AND PLANT IDENTIFICATION TECHNOLOGY
S.J. Rees1, C.L. McCarthy1, X.P.B. Artizzu1, 2, C.P. Baillie1 and M.T. Dunn3
1
National Centre for Engineering in Agriculture (NCEA), USQ, Toowoomba, QLD, Australia 2
Spanish Council for Scientific Research (CSIC) (visiting academic researcher), Madrid, Spain 3
CSIRO Exploration & Mining Group (formerly NCEA), Brisbane, QLD, Australia
ABSTRACT
A project funded by the Australian Sugar Research and Development Corporation aimed to increase sugarcane production through cost effective automated precision weed spraying. The project developed a precision imaging system that could be integrated with current spraying systems to specifically target difficult to control weeds such as guinea grass/green panic.
The technology is capable of differentiating weeds from sugarcane in the row area and actuating a spray solenoid so that only the weeds are sprayed with herbicide in a single pass and with minimal over-spraying of the crop. The precision imaging and spot spraying technology demonstrated proof-of-concept and a cost benefit analysis of the new weed control system indicated potential grower savings.
This paper will report on a review of appropriate technologies, description of the prototype sugarcane image analysis system and algorithms, assessment of accuracy of weed identification and an evaluation of system costs and performance.
Keywords: sugarcane, precision agriculture, image analysis, plant identification, precision spraying, technology
INTRODUCTION
Competition from weeds (mainly grasses) in sugarcane can cause significant loss in yield and potentially reduce the length of the crop cycle (i.e. the number of ratoons). Control methods typically comprise costly damaging herbicides which control grasses at seedling pre-emergence stages and require precise weather conditions to work effectively. Other control methods include ineffective tillage operations and labour intensive manual spot spraying. The Australian sugar industry is becoming increasingly dependent on herbicides as the industry reduces farming costs by moving towards minimum tillage farming systems.
Precision spray technology that targets specific weeds has the potential to revolutionise weed management by maximising production and reducing herbicide usage while reinforcing minimum tillage concepts. Therefore, this project aimed to develop a precision image-based weed spot spraying system to specifically target the difficult to control weed guinea grass/green panic in sugarcane crops. This presents the task of automated detection of green grass weeds from a green grass crop environment. Operating conditions that guided system design included treatment of crop before ‘out of hand’ stage (i.e. before the crop reached tractor height) and weed infestations of less than one weed per square metre.
EXISTING WEED SPOT SPRAYING TECHNOLOGIES
2
These technologies are suitable for identifying weeds in fallow, inter-rows or early stage crops but are not suitable for mature crops or mixed weed/crop situations.
Publicly-reported research literature for automated weed identification using machine vision includes robust segmentation of foliage under daylight conditions (e.g. Tian, 1998), morphological descriptors for individual leaves (Gerhards and Christensen, 2003) and detection of colour and texture differences between species (e.g. Burks et al., 2000). Generally ground-based techniques for species identification require individual leaves to be in the field of view of the camera. Real-time performance is desirable so that weed spot spraying can be integrated with an existing farming operation (e.g. inter-row cultivation).
PRELIMINARY DATA COLLECTION
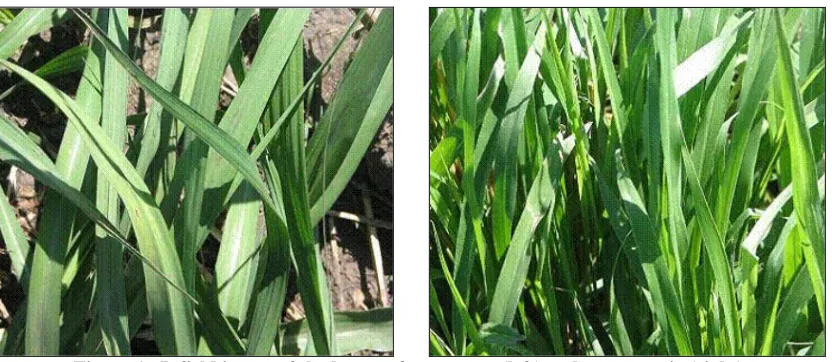
[image:2.595.99.515.319.500.2]Initial investigations of sugarcane and weed properties involved data collection of individual leaves and plants using a video camera (Sony camcorder). The video camera was held steady facing the crop and was moved parallel to the crop row. The video data provided spatial (i.e. shape) as well as colour information about the weeds and crop. Infield observations and inspection of video at different crop growth stages enabled visual differences between the leaf shape, plant structure and growth pattern of weeds and crop to be identified. At all evaluated crop growth stages, sugarcane was bluer in colour, had wider leaves and occurred in less dense tufts than green panic (Figure 1).
Figure 1. Infield image of the leaves of sugarcane (left) and green panic (right).
The colour and shape/structural analysis of the crop and weed species demonstrated that an effective weed detection method should combine both spectral and growth characteristics discrimination. This was anticipated to provide further algorithm robustness in the presence of crop variations introduced by growth stage and/or growing situation (e.g. waterlogging, growth rate, nitrogen or mineral deficiency) which may potentially affect crop colour.
WEED DETECTION ALGORITHM
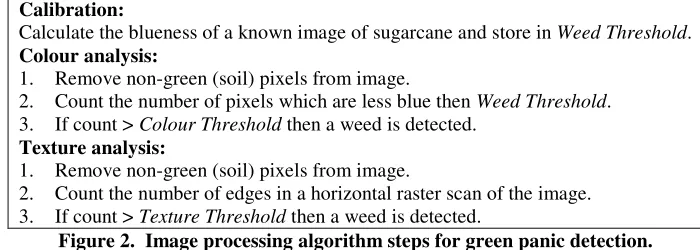
Image analysis algorithms were developed based on the preliminary video data collected. Colour differences between species were embodied as differences in ratios of green to red and blue intensities. Morphological differences (i.e. leaf width and spacing) were embodied as a texture analysis, where texture is a measure of the magnitude and density of intensity changes in an image. The broad algorithm steps are listed in Figure 2.
3
than 10% and false negative detection rates (i.e. weed falsely identified as sugarcane) of less than 20%.
Calibration:
Calculate the blueness of a known image of sugarcane and store in Weed Threshold. Colour analysis:
1. Remove non-green (soil) pixels from image.
2. Count the number of pixels which are less blue then Weed Threshold. 3. If count > Colour Threshold then a weed is detected.
Texture analysis:
1. Remove non-green (soil) pixels from image.
[image:3.595.127.477.109.234.2]2. Count the number of edges in a horizontal raster scan of the image. 3. If count > Texture Threshold then a weed is detected.
Figure 2. Image processing algorithm steps for green panic detection.
The preliminary video provided data for initial algorithm development and was not suitable as an indicator of algorithm performance under field conditions. Therefore, it was determined that a custom field prototype in which the camera angle and lighting was fixed was required to evaluate the algorithm performance under field conditions.
INFIELD WEED DETECTION APPARATUS AND DATA COLLECTION
Field apparatus was developed to evaluate system performance under a range of conditions featuring different crop and weed growth stages and different times of day and night. Two methods employed to verify the algorithm’s accuracy were real-time red dye application on automatically detected weeds (see next subsection) and comparison of manually and automatically detected weeds during video post processing. Both methods were used for the day trials. The apparatus for precision spraying was successfully demonstrated during the day trials so only video post processing was used to evaluate the night trials. Manual identification of weeds during video post processing was enhanced by manually marking the position of weeds before the video was collected such that the weed markers were visible in the collected video.
Day trials with halogen lighting (June-December 2007)
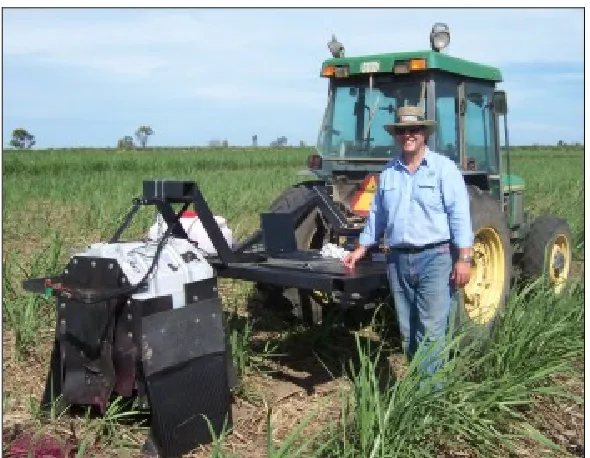
A spot spraying prototype (Figure 3) was developed to enable system evaluation under field conditions and desired ground speeds in late 2007. The prototype featured a hooded enclosure that was suspended from the back of a tractor. The enclosure provided an imaging environment for the vegetation in which incident sunlight was restricted to slits in the hood. Artificial lighting was provided from two halogen lights (Solux, warm white, 50 W). Image capture was via a webcam (Logitech Ultravision) and laptop computer that were mounted under the hood. The spot spraying prototype applied dye to automatically identified weeds (applied dye is visible in bottom left corner of Figure 3). The same weed-infested area of crop was repeatedly sampled 16 times during the course of a day using this apparatus to enable comparison of algorithm performance at different times of day.
Night trials with halogen and LED lighting (August-November 2008)
4
Figure 3. Infield weed spot spraying prototype.
Figure 4. Apparatus for lighting (circled, outer) and image capture (circled, middle) in night trials.
IMAGE ANALYSIS RESULTS AND DISCUSSION
Day evaluations
5 Video
no.
Weed Threshold
Colour Threshold
Texture
Threshold Hit
False negative (=100% – HIT)
False positive
1 0.199 244 118 100% 0% 1 trigger
2 0.231 227 95 100% 0% 2 triggers
3 0.213 236 108 92% 8% 1 trigger
4 0.198 241 114 100% 0% 0 triggers
[image:5.595.91.520.57.147.2]5 0.179 242 115 100% 0% 0 triggers
Table 1. Typical results of the algorithm on the daytime video.
Night evaluations
Halogen lighting
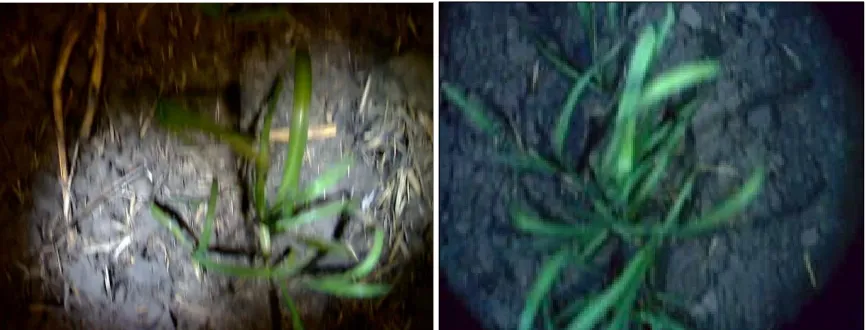
The image analysis results of the night trial using halogen lighting featured a mean weed detection rate of 68%, with 32% false positives. Small weeds were not accurately detected. Inspection of video collected with halogen lighting revealed that the lighting appeared non-uniform on the imaged area (typical image, Figure 5). The appearance of light reflections/shadows varied depending on the size and shape of the vegetation and highly influenced the outcome of the algorithm. The non-uniform lighting necessitated continual readjustment of algorithm parameters Colour Threshold and Texture Threshold and the automatic calibration procedure yielded highly variable values of the parameter Weed Threshold even for consecutive video frames. Therefore, alternative lighting implementations were considered.
LED lighting
White LED lighting was implemented to achieve more homogeneous illumination of the imaged crop area (Figure 5). Consequently, weed detection rate for images featuring large weeds increased to an average of 84% with 5% false positives. Parameter stability also increased as a result of the homogeneous lighting. Identical parameters could be used to successfully detect weeds in multiple videos containing plants of similar shape and size. However, the automated calibration procedure was unreliable. Therefore, the calibration parameter Weed Threshold was manually selected by evaluating a range of threshold values on a set of validation images. The algorithm’s texture criterion was omitted since it was found to conflict with the colour criterion and degraded the overall algorithm performance.
Figure 5. Typical images captured under halogen (left) and LED (right) lighting. The LED lighting appears to illuminate the imaged area more homogeneously.
Study of sugarcane and green panic colour properties
[image:5.595.90.523.495.660.2]6
threshold could not be expected to exclusively isolate one species from the other and the relative sizes of the populations of crop and weed present affected which population was detected in any particular frame. Therefore, an algorithm based on a single colour threshold was not sufficient to discriminate between sugarcane and green panic of various growth stages. It is anticipated that further algorithm development should include shape analysis (e.g. leaf width and spacing) to enhance the discrimination ability of the algorithm.
[image:6.595.87.526.145.320.2]
Figure 6. Blue intensity histograms for sugarcane and weeds at day (left) and night (right).
COST BENEFIT ANALYSIS
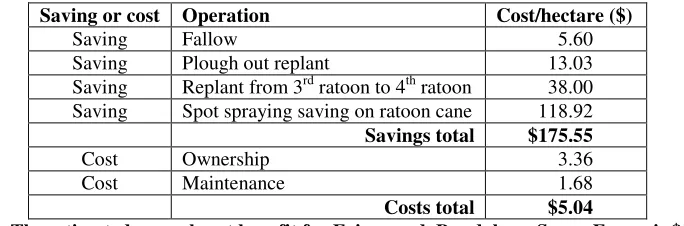
Current weed control techniques and costs were benchmarked from farming operations on Bundaberg Sugar farms at Fairymead for a comparison with potential savings using the precision weed spot sprayer (Table 2). Potential savings were identified in chemical, weed management and replanting costs. In fallow, potentially 80% of chemical costs could be saved by adopting precision weed spot spraying technology. In ratoon cane, spot spraying chemical costs would drop to the cost of in-crop, in-row chemical costs (estimated at 10% of total ratoon chemical costs). It is anticipated that in ratoon cane the spot spraying operation would be integrated with an existing farm operation and as such, the spot spraying application cost would reduce or potentially be eliminated.
Other benefits included reduced competition from weeds which would potentially extend the number of ratoons for the crop cycle. This would extend the number of ratoons from three (Fairymead average for 2007) to four, potentially saving one-quarter of replant costs. Additionally, effective weed control could potentially reduce the crop replant area due to weed infestations each year.
The technology and application costs for the precision weed spot sprayer are offset against anticipated savings to result in an overall annual saving of $170/ha (Table 2). The technology costs were based on the use of two 3-row machines, with depreciation over five years and an annual maintenance cost of 10% of the purchase cost.
Saving or cost Operation Cost/hectare ($)
Saving Fallow 5.60
Saving Plough out replant 13.03
Saving Replant from 3rd ratoon to 4th ratoon 38.00 Saving Spot spraying saving on ratoon cane 118.92 Savings total $175.55
Cost Ownership 3.36
Cost Maintenance 1.68
Costs total $5.04
[image:6.595.136.478.636.749.2]7 CONCLUSIONS AND FURTHER WORK
The image analysis algorithm operating at night time with the white LED illumination produced satisfactory results on mature green panic and guinea grass. However, the algorithm did not perform satisfactorily for smaller weeds or sugarcane. Operating the system at night overcame the variations encountered during the day and stabilised the detection system in similar working conditions so that the algorithm parameters did not need to be constantly reset. Further development should focus on reliable automatic calibration of the Weed Threshold parameter, automation of parameter selection and algorithms that can adapt to changes in daytime conditions and varying growth stages.
The weed spot spray technology in its current form is considered a viable alternative to manual spot spraying methods in mature weeds. Spot spraying apparatus was successfully demonstrated to be effective at precision application. The cost benefit analysis demonstrated potential significant cost savings to growers through reduced chemical and weed management costs while providing beneficial outcomes to the environment through reduced chemical application.
Acknowledgement
The authors would like to thank Bundaberg Sugar for their support throughout the project.
References
Burks, T.F., Shearer, S.A. and Payne, F.A. (2000). Classification of weed species using color texture features and discriminant analysis Transactions of the ASAE 43(2): 441-448.
Gerhards, R. and Christensen, S. (2003). Real-time weed detection, decision making and patch spraying in maize, sugarbeet, winter wheat and winter barley Weed Research 43:385-392.