Numerical Study on the Mode I Delamination Toughness
of Z-Pinned Laminates
Wenyi Yan∗1, Hong-Yuan Liu1 and Yiu-Wing Mai1,2
1
Centre for Advanced Materials Technology (CAMT), School of Aerospace, Mechanical and Mechatronic Engineering J07, The University of Sydney, Sydney, NSW 2006, Australia
2
Department of Manufacturing Engineering and Engineering Management (MEEM) City University of Hong Kong, 83 Tat Chee Avenue, Kowloon, Hong Kong, China
Abstract
A finite element (FE) model is developed to investigate mode I delamination toughness of z-pin reinforced composite laminates. The z-z-pin pull-out process is simulated by the deformation of a set of non-linear springs. A critical crack opening displacement (COD) criterion is used to simulate crack growth in a double-cantilever-beam (DCB) made of z-pinned laminates. The toughness of the structure is quantified by the energy release rate, which is calculated using the contour integral method. The FE model is verified for both unpinned and z-pinned laminates. Predicted loading forces from FE analysis are compared to available test data. Good agreement is achieved. Our numerical results indicate that z-pins can greatly increase the mode I delamination toughness of the composite laminates. The influence of design parameters on the toughness enhancement of z-pinned laminates is also
investigated, which provides important information to optimise and improve the z-pinning technique.
Keywords: B. Fracture toughness; C. Laminates; C. Delamination; C. Computational simulation; Z-pin reinforcement.
1. Introduction
heat and pressure compacting the foam. The z-pinning technique is proven to be a cost effective method to improve the delamination toughness of composite laminates.
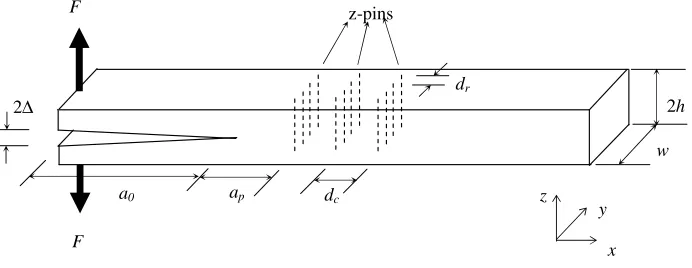
Experimentally, the Double-Cantilever-Beam (DCB) is a standard geometry to study mode I delamination toughness of composite laminates. This can be conveniently adopted to evaluate the toughness of z-pinned laminates. Figure 1 schematically illustrates a DCB test for z-pin reinforced composite laminate. Z-pins are inserted in the laminate along the z direction. The initial crack is created in the laminate mid-plane with length a0 and the distance of the nearest
pin column to the crack tip is ap. With increasing external force F or displacement ∆ at the
loaded ends of the beams, the crack will finally grow along the mid-plane. When the crack reaches the z-pinned zone, the pins will exert closure tractions to close the delaminated crack faces. Thus, a higher external force, compared to an un-pinned crack, is required to maintain the crack growth. That is, the z-pins enhance the delamination toughness of the composite laminate.
work by Liu and Mai [5], the bridging force of the z-pin is calculated by a fibre pullout model which includes the whole pullout process of the z-pin: elastic deformation before z-pin debonding, elastic deformation and frictional sliding during debonding growth and, finally, frictional sliding. The discrete bridging forces calculated from this pullout model were then applied on the beams. The deformation of the DCB specimen and the pullout displacement were numerically quantified by applying the beam theory.
2. Theoretical Approach
2.1 Toughness analysis
According to linear elastic fracture mechanics theory, the toughness of a material or structure can be quantified by the energy release rate, Ga, which is defined as ([6])
) (
1
da dU da dU w
G e s
a = − , (1)
where w is width of the crack front equal to the DCB width, a is crack length, U is external e
work performed and U is stored elastic energy. The energy release rate Gs a represents the
energy available for the creation of a unit new crack area.
For unpinned DCB specimens, the dissipated energy is completely consumed by the surface energy of the newly created crack surface, which is denoted by Gc. During crack growth, Gc
must be equal to the composite’s intrinsic toughness, GIC. Hence,
Ga = Gc=GIC. (2)
surface, Gc, and the energy release rate due to z-pin pullout, Gp, which depends on the extent
of delamination. That is,
p c
a G G
G = + (∆a) (3)
and Gc=GIC. The delamination toughness of z-pinned laminates can be completely described
by the total energy release rate, Ga, which is commonly called the crack-resistance GR. The
FE method is applied to analyse Ga or GR of z-pin reinforced DCB specimens.
2.2 Pullout model and pullout simulation
≤ δ ≤ δ δ − δ δ − − δ ≤ δ ≤ δ δ = h h P P P P a a a a a a a a ), ( 0 ,
. (4)
This function is shown in Fig. 2, which clearly indicates that this pullout model is completely determined by the peak bridging force, Pa, its corresponding pullout displacement, δa, and
the ultimate pull-out displacement, h, equal to half-thickness of the DCB. The bridging force is zero when the pin completely pulls out from the composite, that is, when δ=h.
This pullout model can also be applied to describe the case where the pin ruptures before being completely pulled out, which was discussed by Jain and Mai [4]. This happens when the pullout force is larger than the rupture force of the pin. This becomes possible if the bonding between the pin and the laminate is strong enough. In this special case, the pullout force drops to zero immediately after it reaches the maximum value Pa.
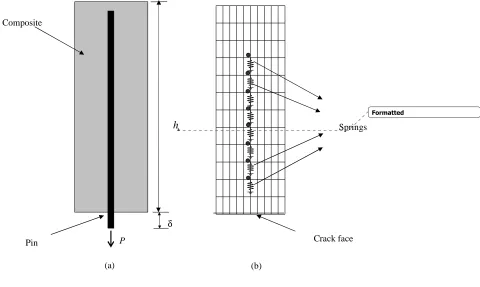
For simplicity, the pullout process of a z-pin from the composite laminate is not explicitly simulated in our FE analysis. Instead, the pin effect is simulated by distributed springs along the thickness of the beam at the same location, which is schematically shown in Fig. 3. Note that a section of the z-pinned laminate with a pin pulling-out is given in Fig. 3(a) and its FE model in Fig. 3(b). Several identical non-linear springs are arranged on the FE nodes, which are highlighted by black dots in Fig. 3(b).
used to simulate the pin pullout process. This is determined in our FE model by s r a s wn n P
p = , (5)
where nr is the number of rows of pins arranged along the beam width, i.e., the y-direction in
Fig. 1. The number of identical springs in one column used to represent a column of pins is denoted by ns. Our trial calculations indicate that the results for ns from 4 to 9 are the same.
Hence, ns is chosen as 8 throughout all the FE calculations.
2.3 Contour integral
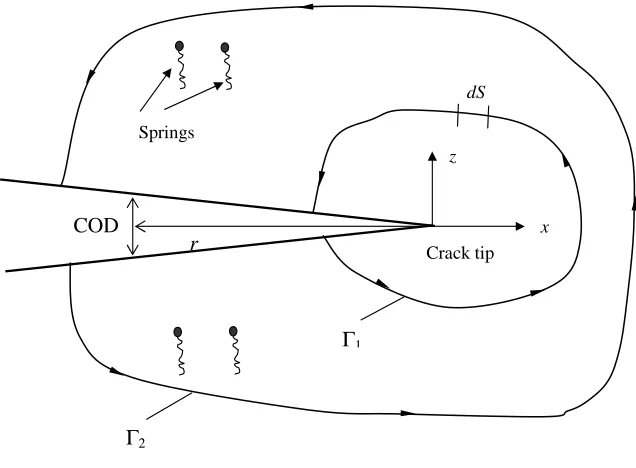
The energy release rate is calculated by the contour integral method. According to linear elastic fracture mechanics (see [6]), the energy release rate, Ga, is equal to a contour integral
with the integrating path starting from the lower crack surface and ending at the upper crack surface, i.e.,
Γ − +
= dS dx du T dx du T dz W G z z x x s
a ( ) , (6)
where Ws is the strain energy density of the composite, Tx and Tz are components of the
traction vector at the section dS of the contour Γ. ux and uz are the displacement components,
see Fig. 4.
Two contours, Γ1 and Γ2, are shown in Fig. 4. Contour Γ1 includes only the composite around the crack-tip without the springs, i.e., z-pins. The calculated energy release rate Ga based on
composite. Thus, Ga = Gc=GIC. Contour Γ2includes all the springs, that is, all the effects of
the z-pins. The calculated energy release rate, based on this contour, Ga, now represents the
total energy release rate, which includes the energy dissipation due to the creation of new crack surfaces Ga and the energy dissipation due to the z-pins Gp. As described Section 2.1, Ga is the same as the crack-resistance GR of the z-pinned DCB.
The FE package ABAQUS adopts a domain integral method to numerically calculate the contour integral based on the divergence theorem. This method has been proved to be quite effective in the sense that accurate contour integral estimates are usually obtained even with quite coarse meshes because the integral is taken over a domain of elements surrounding the crack front. Errors in local solution parameters have less effect on the domain integrated value, i.e., the energy release rate (see, ABAQUS [8]). Therefore, it is not necessary to simulate the stress singularity near the crack-tip. Ordinary 4-node bi-linear plane stress elements are used in our FE analyses. Fig. 3(b) shows part of the FE meshes. In total, there are about 13,700 elements used in the FE model. It takes about 16 h in a Compaq ES45 supercomputer with one CPU to finish a crack growth simulation.
2.4 The critical COD criterion
problem in orthotropic materials. The relation between the energy release rate, Ga , and the
COD is (see, also Suo [11] and Poursartip et al. [12])
r G a a a a a a a a 4 / 1 11 22 11 66 12 4 / 1 22 11 4 / 1 2 2 ) ( ) 2 ( 4
COD + +
π
= , (7)
where a11, a22, a12 and a66 are determined by material elastic constants. In the case of plane
stress studied here, they are ([13])
1 11
1
E
a = ,
2 22
1
E
a = ,
1 12 2 21 12 E E
a =−ν =−ν ,
12 66
1
G
a = . (8)
The r in Eq (7) represents the distance from the crack-tip, which is illustrated in Fig. 4.
The finite element package ABAQUS provides the critical COD fracture criterion to simulate crack growth, which is applied in the present study. In this case, the crack grows by releasing the node in front of the crack-tip when the COD at a specified distance behind the crack-tip reaches a critical value. In our study, the specified distance is determined by several trial tests based on the rule that the calculated energy release rate should be the same as the critical value used to determine the critical COD for the unpinned DCB.
contours like Γ1can be constructed to exclude all the springs. This arrangement for the springs partly reflects the reality because bonding at both ends of a pin is normally not as good as that in the middle, which originates from the z-pin insertion process and the z-pin bending effect. Furthermore, because the energy release rate is used to quantify the toughness of the structure, the local errors due to the arrangement of the springs is expected to have little effect on the contour integral of the energy release rate.
2.5 Material and geometry data
DCB tests had been carried out to study mode I delamination behavior of z-pinned composite laminates by Cartie and Partridge [14]. The material constants and geometrical parameters used in our FE calculations are based on their test results, which are summarized in Tables 1 and 2 below.
In Table 1, E1 and E2 are Young’s moduli in x- and z-direction, respectively. ν12is Poisson
coefficient, which characterizes compression in z-direction due to tension along x-direction.
µ12 is shear modulus for planes parallel to the coordinates xOz. The values of the parameters
to describe the DCB and z-pinning are listed in Table 2.
Here h is half-thickness, w width and L total length of the DCB. The parameter ao is the
initial length of the crack and ap is the distance from the crack-tip to the closest pins. As
pullout displacement. nc is number of columns of pins arranged in x-direction and nr is
number of rows of pins arranged in y-direction. dc represents the column spacing between
adjacent z-pin columns.
2.6 Model verification
For unpinned DCB, there are no z-pins to improve delamination toughness of the composite laminate. The energy release is only consumed in creation of new crack surfaces. That is,
0
= p
G . Thus, from Eq. 3, we have
IC c
a G G
G = = . (9)
Theoretically, the calculated energy release rate, Ga, from the FE analysis using the contour
integral method should be the same value as the critical energy release rate GIC used to
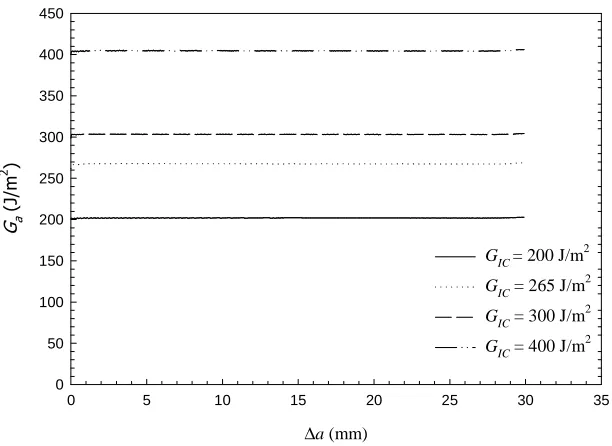
calculate the critical COD during crack growth. Based on this consideration, FE analysis is first carried out to simulate crack growth in the unpinned DCB. Figure 5 shows the variation of Ga with crack growth, a∆ , for different inputted critical energy release rate, GIC. It clearly
demonstrates that the energy release rates are the same during crack growth in all the cases. All the curves indicate very good agreement between the calculated energy release rate and the inputted critical energy release rate is achieved in each case.
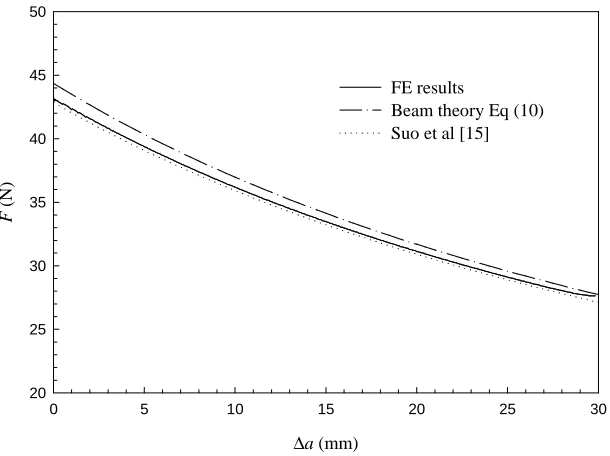
For un-pinned DCB, the reaction force at the loaded ends should decrease gradually during crack growth. This is confirmed in Fig. 6, in which the solid line represents the numerically calculated reaction force plotted against crack growth. Here, G is assumed 265 J/mIC
2
beam width, w, is 20 mm. Because the initial crack length is much larger than the height of the DCB, the analytic solution from conventional beam theory is a good approximation for this case although it neglects the effect of material orthotropy. Thus, we have (see [9])
2 / 1 2 11 3 2 12 = a G E h w
F IC . (10)
The chained line in Fig. 6 represents the analytic solution from Eq. (10). The results from the beam theory are no more than 4% higher than the FE results.
Including the effect of material orthotropy, Suo et al [15] proposed a more accurate solution for the energy release rate of un-pinned DCB specimens (also see [16]). Their solution is obtained using finite elements, together with several analytic considerations and the error is within 1%. Based on the solution of Suo et al [15], in the case of plane stress, the reaction force is determined by
2 / 1 2 4 / 1 2 11 3 2 ) / 1 ( 12 + λ
= − a h Y a G E h w
F IC , (11)
where λ=a11/ a22. The dimensionless factor Y is approximated by 2 ) 1 ( 013 . 0 ) 1 ( 149 . 0 677 . 0 )
(ρ = + ρ− − ρ−
Y (12)
with 1/2
22 11 66
12 0.5 )/( ) (a + a a a
=
ρ . Inserting values of material parameters, results from Eq.
2.7 Dimensional analysis
Crack growth in z-pinned DCB is fairly complex. Too many parameters contribute to the failure process. Hence, to study the major effects of some of these parameters, dimensional analysis is adopted. Generally, given a material’s elastic property, the functional dependency of the crack-resistance, GR, on the independent parameters is
) , , , , , , , , , , , , ( 0
1 p IC a a c c r r
R g F aa a whG P n d n d
G = ∆ δ , (13a)
where dr is spacing between adjacent z-pin rows. The reaction force F at the loaded ends is a
physical quantity similar to GR. Therefore, during crack growth, GR actually depends on:
) , , , , , , , , , , , ( 0
2 p IC a a c c r r
R g aa a whG P n d n d
G = ∆ δ . (13b)
Due to our plane stress assumption, the effect of row spacing, dr, can be ignored. According
to Eq (5), the peak force in the springs of our model, ps, is determined by the product of the
peak force of the single pin pullout model, Pa, and number of z-pins in a row, nr. Therefore,
in the parametrical study, we can just focus on the effect of Pa while fixing the number of
z-pins in a row, nr, which is chosen as 5 according to Cartie and Partridge [14]. Furthermore,
the initial crack length a0 is determined by standard DCB tests, which is 50 mm in our
simulations. The effect of the distance of the z-pinned zone from the initial crack tip, ap, can
be implicitly reflected in the effect of the crack growth a∆ . Hence, ap is also fixed as 5 mm in
our analysis. After these considerations, the function of the crack-resistance of the DCB is simplified as: ) , , , , , , (
3 IC a a c c
R g ahG P n d
According to the dimensional theory, see Anderson [9], we have the follow dimensionless function ) , , , , ( 4 c c IC a a IC R n h d h G P h h a g G
G ∆ δ
= . (14)
Thus, the normalized crack-resistance or “apparent” crack toughness of the z-pinned DCB,
IC
R G
G / , is completely determined by the dimensionless crack advance, ∆a /h, normalized location of peak force in the pullout model, δa/h, normalized peak force in pullout model,
) /(G h
Pa IC , normalized pin column spacing, dc/ , and number of columns of pins, nh c. Based
on Eq (14), the effects of these parameters on the delamination toughness of DCB are studied in Section 3.
3.
Results and Discussion
3.1 Comparison with experimental data
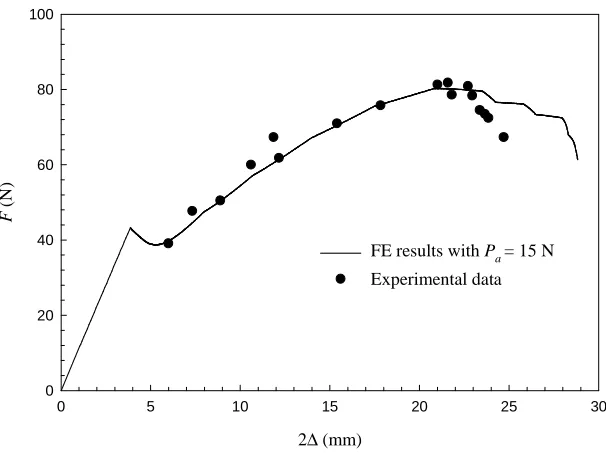
Whilst DCB tests were carried out on mode I delamination of z-pinned composite laminate ([14]), there has been no reliable test data to-date for z-pin pullout to our knowledge. Hence, different peak forces of the pullout model, Pa, were selected in our FE simulations. For Pa=15
However, due to the closure tractions exerted by the z-pins, the applied force increases gradually over a wide range of crack growth. The maximum value reaches ~80 N, which is much larger than the maximum force of the unpinned specimen. This means that the delamination toughness of the DCB has been greatly improved by the z-pins. At the final stage, the load drops again because all the pins have been pulled out. The black dots are the experimentally measured data from [14], and compared to our FE results using Pa=15 N, very
good agreement is obtained.
3.2 Z-pin enhanced toughness
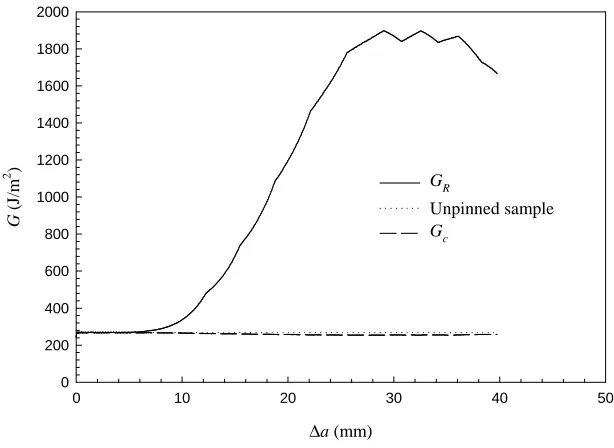
As described above, the energy release rate is a suitable parameter to quantify the toughness of a structure. Here, the energy release rate versus crack growth, or GR-curve, obtained from
our FE analysis is calculated using a Γ2 type contour in Fig. 4 and represented in Fig. 8 by the
solid line. The dotted line is the FE result of the energy release rate for the unpinned sample, which is constant during crack growth and is equal to GIC = 265 J/m2. The dashed line is the
energy release rate, Gc, derived from the z-pinned DCB based on a Γ1 type contour in Fig. 4.
As discussed above, Gc should represent the energy release rate due solely to the creation of
new crack surfaces during delamination crack growth, that is, Gc=GIC. Fig. 8 clearly confirms
Comparing the solid and dotted lines in Fig. 8, it is shown that the crack-resistance GR-curve
of the z-pinned laminate is overall much larger than the unpinned laminate except at initial crack growth, where the z-pins have not yet started to function. The maximum GR is ~1900
J/m2, which is ~7 times the unpinned DCB. Hence, z-pinning is a very effective technique to improve the mode I delamination toughness of composite laminates.
3.3 Parametric study
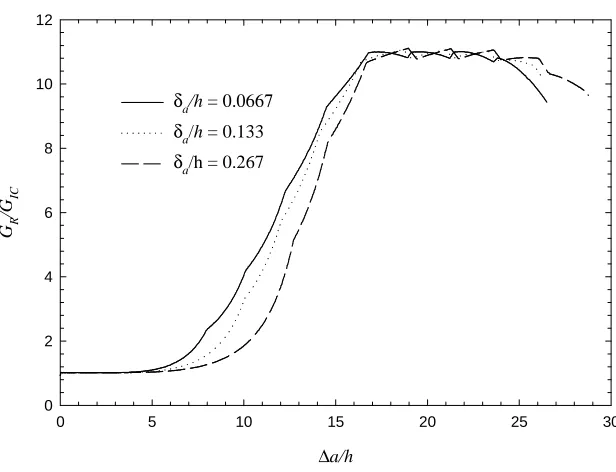
To understand the contribution of the parameters discussed in Section 2.6 on z-pin enhanced toughness of DCB, a parametrical study is quantitatively carried out. The effect of the pullout model is studied first. Fig. 9 shows the influence of the normalized pullout model parameter,
δa/h, on the normalized energy release rate, GR/GIC, during crack growth. In all the three
cases for δa/h from 0.0667 to 0.133 and 0.267, the other parameters are fixed at nc = 8, δc/h =
2.33 and Pa/GICh = 61.9. Fig. 9 shows that the crack-resistance GR increases in all three cases
due to z-pin reinforcement. However, the difference is small, especially at the plateau region
there is no difference. Thus, the effect of the pullout parameter δa on toughness enhancement
is not significant.
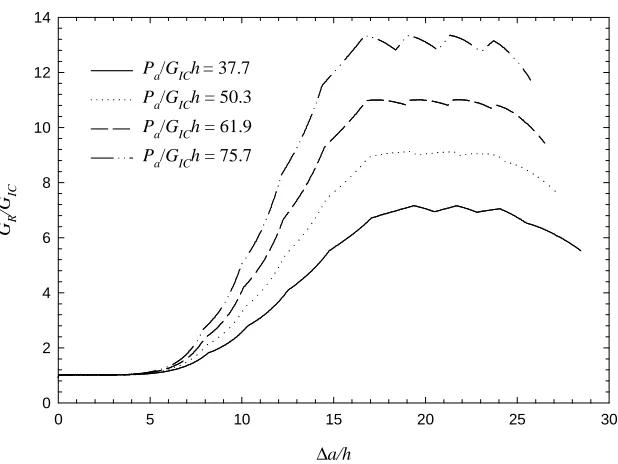
The effect of the normalized pullout model parameter, Pa/GICh, is shown in Fig. 10. It can be
seen that the total energy release rate or crack-resistance increases as the peak pullout force,
7 but this becomes >13 for Pa/GICh=75.7. The contribution of the z-pins on the enhanced
toughness is a manifestation of the work dissipated in pulling out the pins. That is, the work area under the curve of the pullout force P versus pullout displacement δ in Fig. 2. The parameter δa represents the pullout displacement at maximum pullout force, Pa. Thus, by
increasing Pa the area in Fig. 2 and hence the z-pin pullout work is also increased. This in
turn improves the delamination toughness of a z-pinned structure. Conversely, changing the
value of δa alone without varying Pa cannot change the z-pin pullout work. Hence, the effect
of δa on GR should be small as confirmed by Fig. 9. These conclusions are consistent with the
study on cohesive failure (see [17]). Practically, higher pullout peak force Pa can be achieved
by improving the z-pining technique to gain stronger bonding between pins and laminate.
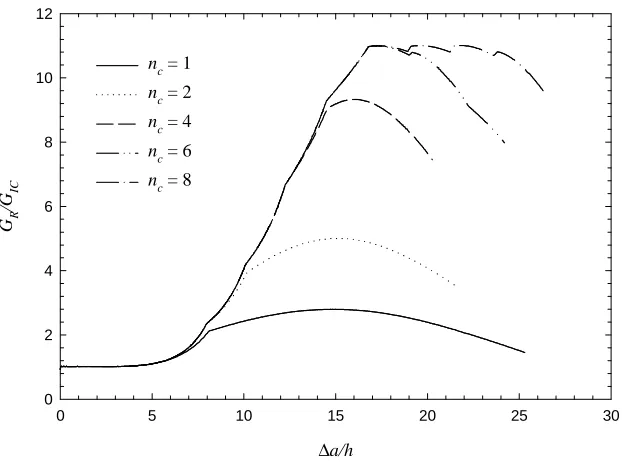
Figure 11 shows the influence of the number of pin columns on the energy release rate of z-pinned laminates. Here six cases are considered for nc = 1 to 8. The number of z-pin columns
represents the size of the z-pinned zone in the crack growth direction for a given column spacing, dc. Therefore, it is not surprised to see that the enhanced toughness GR/GIC covers a
longer delaminated distance for higher number of z-pin columns. Fig. 11 also shows that the maximum crack-resistance GR increases rapidly from nc = 1 to 4. This observation indicates
that interaction between pin columns can also enhance the delamination toughness of the composite laminate. With nc increasing continuously from 4 to 8, this effect becomes less
efficient. For example, GR/GIC are almost identical for nc = 6 and 8. Hence, it is expected that
further increasing nc beyond 8 would not lead to any improvement in GR/GIC. In sum, there is
However, Fig. 11 also indicates that a steady toughening state can be reached when the number of the z-pin columns is over 8.
The influence of the normalized column spacing, dc/h, on the normalized energy release rate, GR/GIC, is shown in Fig. 12. By keeping the same number of z-pin columns, the delamination
toughness is shown to increase with decreasing column spacing. This confirms the interactive effect between z-pin columns. That is, smaller column spacing provides stronger interaction between z-pin columns. This prediction is consistent with experimental results. Cartie and Patridge [14] found in their tests that increasing the z-pin density by reducing the spacing distance greatly increased the mode I delamination toughness of DCB specimens. However, it must be remembered that the present results are obtained based on a single pin pullout model. Detailed experimental and theoretical study should be carried out to determine the limits of the application of the single pin pullout model in multi-pin reinforced laminates.
4. Conclusions
at the loaded ends of the DCB sample agrees well with available experimental data. Our numerical results indicate that z-pins can greatly increase mode I delamination toughness of composite laminates. Parametric study shows that increasing the pullout peak force through improving z-pinning technique can greatly improve the delamination toughness of z-pinned laminates. Furthermore, increasing the number of z-pin columns dramatically enhances the peak crack toughness, but this beneficial effect saturates when the column number reaches a certain value. The column spacing is also a sensitive parameter that affects the delamination toughness. Our results show that by reducing the distance between adjacent z-pin columns the peak toughness is increased.
Acknowledgements
References
1. Freitas G, Magee C, Dardzinski P, Fusco T. Fiber insertion process for improved damage tolerance in aircraft laminates. J Adv Mater 1994; 25(4): 36-43.
2. Rugg KL, Cox BN, Massabo R. 2002. Mixed mode delamination of polymer laminates reinforced through the thickness by z-fibres. Composites Part A 2002; 33: 177-190.
3. Rugg KL, Cox BN, Ward KE, Sherrick GO. Damage mechanisms for angled through-thickness rod reinforcement in carbon-epoxy laminates. Composites Part A 1998; 29:1603-1613.
4. Jain LK, Mai Y-W. On the effect of stitching on mode I delamination toughness of laminated composites. Comp Sci and Tech 1994; (51):331-345.
5. Liu H-Y, Mai Y-W. Effects of z-pin reinforcement on interlaminar mode I delamination. In: Proceedings of the 13th international conference on composite materials, ICCM13, Beijing, 25th-29th June, 2001.
6. Williams JG. 1989. Fracture mechanics of anisotropic materials. In: Friedrich K editor. Application of fracture mechanics to composite materials. Amsterdam: Elsevier, 1989. 7. Liu H-Y, Zhang X, Mai Y-W, Diao, X-X. On steady-state fibre pull-out part II: Computer simulation. Comp Sci Tech 1999; (59):2191-2199.
8. ABAQUS 2001 Version 6.2. Providence, RI: HKS Inc.
10. Sih GC, Paris PC, Irwin GR. On cracks in rectilinearly anisotropic bodies. Int J Fract Mech 1965; l(1):189-203.
11. Suo Z. Delamination specimens for orthotropic materials. ASME J Appl Mech 1990; (57):627-634.
12. Poursartip A, Gambone A, Ferguson S, Fernlund G.. 1998. In-situ SEM measurements of crack tip displacements in composite laminates to determine local G in mode I and II. Eng Frac Mech 1998; 60:173-185.
13. Lekhnitskii SG. Theory of elasticity of an anisotropic elastic body. San Francisco: Holden-Day, Inc. 1963.
14. Cartie DDR, Partridge IK. Delamination Behaviour of Z-pinned Laminates. In: Proceedings of the 12th international conference on composite materials, ICCM12, Paris 5th -9th July, 1999.
15. Suo Z, Bao G., Fan B, Wang, TZ. Orthotropy rescaling and implications for fracture in composites. Int J Solids Struct 1991; 28:235-248.
16. Hutchinson JW, Suo Z. Mixed mode cracking in layered materials. Advances in Applied Mechanics 1991; 29:63-191.
Figure 1. Schematic of a Double-Cantilever-Beam (DCB) test for z-pinned composite laminate.
a0 ap
F
F
w
2h
x y z
z-pins
2∆
dc
Figure 2. Illustration of the z-pin pullout model used in this study.
P
P
aδ
ah
δ
Figure 3. Schematically illustrating FE simulation of the effect of z-pin by distributed nonlinear springs in FE model: (a). a section of z-pinned composite; (b). FE model for this section with distributed springs.
Springs
h
Pin Composite
(a) (b)
Crack face
P
Figure 4. Integral contours for calculating energy release rates: Γ1: contour excluding springs (z-pins); Γ2: contour including all the springs (z-pins).
x z
dS
Γ
1Γ
2Crack tip Springs
COD
∆a (mm)
0 5 10 15 20 25 30 35
0 50 100 150 200 250 300 350 400 450
GIC = 200 J/m2
GIC = 265 J/m2
GIC = 300 J/m2
[image:27.612.86.392.129.352.2]GIC = 400 J/m2
∆a (mm)
0 5 10 15 20 25 30
F
(
N
)
20 25 30 35 40 45 50
FE results
[image:28.612.87.392.151.379.2]Beam theory Eq (10) Suo et al [15]
Figure 6. The reaction force at the loaded ends, F, as a function of crack growth, ∆a, for an
2∆ (mm)
0 5 10 15 20 25 30
F
(
N
)
0 20 40 60 80 100
[image:29.612.87.390.151.378.2]FE results with Pa = 15 N Experimental data
∆a (mm)
0 10 20 30 40 50
G
(
J/
m
2 )
0 200 400 600 800 1000 1200 1400 1600 1800 2000
GR
Unpinned sample
[image:30.612.84.391.130.354.2]Gc
Figure 8. Calculated energy release rates as a function of crack growth with GIC = 265 J/m 2
∆a/h
0 5 10 15 20 25 30
GR
/G
IC
0 2 4 6 8 10 12
δa/h= 0.0667
δa/h = 0.133
[image:31.612.87.395.104.340.2]δa/h = 0.267
Figure 9. Influence of normalized pullout model parameter, δa/h, on normalized delamination
∆a/h
0 5 10 15 20 25 30
GR
/G
IC
0 2 4 6 8 10 12 14
Pa/GICh= 37.7
[image:32.612.88.397.141.373.2]Pa/GICh = 50.3 Pa/GICh = 61.9 Pa/GICh = 75.7
Figure 10. Influence of normalized pullout model parameter, Pa/GICh, on normalized
delamination toughness, GR/GIC, during crack growth with nc = 8, δa/h = 0.0667 and dc/h =
∆a/h
0 5 10 15 20 25 30
GR
/G
IC
0 2 4 6 8 10 12
nc = 1
nc = 2
[image:33.612.87.398.131.365.2]nc = 4 nc = 6 nc = 8
∆a/h
0 5 10 15 20 25 30
GR
/G
IC
0 2 4 6 8 10 12
dc/h =1.33
dc/h = 2.33
dc/h = 3.33
[image:34.612.86.397.125.357.2]dc/h = 4.67
Figure 12. Influence of normalized column spacing, dc/h, on normalized delamination
Table 1. The material constants of the composite laminate.
E1 (GPa) E2 (GPa) ν12 µ12(GPa)
Table 2. Values of parameters to describe the DCB and z-pinning.
h (mm) w (mm) L (mm) a0 (mm) ap (mm) δa(mm) Pa (N) nc nr dc(mm)