400 IEEE TRANSACTIONS ON RADIATION AND PLASMA MEDICAL SCIENCES, VOL. 3, NO. 4, JULY 2019
Effect of PET-MR Inconsistency in the Kernel
Image Reconstruction Method
Daniel Deidda , Student Member, IEEE, N. A. Karakatsanis , Senior Member, IEEE, Philip M. Robson,
Nikos Efthimiou, Member, IEEE, Zahi A. Fayad, Robert G. Aykroyd ,
and Charalampos Tsoumpas , Senior Member, IEEE
Abstract—Anatomically driven image reconstruction algorithms have become very popular in positron emission tomography (PET) where they have demonstrated improved image resolution and quantification. This paper examines the effects of spatial inconsistency between MR and PET images in hot and cold regions of PET images using the hybrid kernelized expectation maximization (HKEM) machine learning method. Our evaluation was conducted on Jaszczak phantom and patient data acquired with the Biograph Siemens mMR. The results show that even a small shift can cause a significant change in activity concentration. In general, the PET-MR inconsistencies can induce the partial volume effect, more specifically the “spill-in” for cold regions and the “spill-out” for hot regions. The maximum change was about 100% for the cold region and 10% for the hot lesion using kernelized expectation maximization, against the 37% and 8% obtained with HKEM. The findings of
Manuscript received March 8, 2018; revised July 27, 2018, September 23, 2018, and October 23, 2018; accepted November 25, 2018. Date of publication November 30, 2018; date of current version July 1, 2019. This work was sup-ported in part by the University Research Scholarship, in part by the University of Leeds, in part by NIH/NHLBI Research under Grant R01HL071021, and in part by the EPSRC Collaborative Computational Flagship Project under Grant EP/P022200/1 and Grant EP/M022587/1. The work of C. Tsoumpas is sup-ported by the Royal Society Industry Fellowship under Grant IF170011. This paper was undertaken on MARC1, part of the High-Performance Computing and Leeds Institute for Data Analytics Facilities at the University of Leeds, U.K. (Corresponding author: Daniel Deidda.)
D. Deidda was with the Biomedical Imaging Science Department, Leeds Institute of Cardiovascular and Metabolic Medicine, School of Medicine, University of Leeds, Leeds LS2 9NL, U.K., and also with the Department of Statistics, School of Mathematics, University of Leeds, Leeds LS2 9NL, U.K. He is now with the National Physical Laboratory, Medical Radiation Physics Department, Teddington, U.K. (e-mail: [email protected]).
N. A. Karakatsanis is with the Department of Radiology, Translational and Molecular Imaging Institute, Icahn School of Medicine at Mount Sinai, New York, NY 10029 USA, and also with the Division of Radio-Pharmaceutical Sciences, Department of Radiology, Weill Cornell Medical College, Cornell University, New York, NY 10021 USA.
P. M. Robson and Z. A. Fayad are with the Department of Radiology, Translational and Molecular Imaging Institute, Icahn School of Medicine at Mount Sinai, New York, NY 10029 USA.
N. Efthimiou is with the School of Life Sciences, Faculty of Health Sciences, University of Hull, Hull HU6 7RX, U.K.
R. G. Aykroyd is with the Department of Statistics, School of Mathematics, University of Leeds, Leeds LS2 9NL, U.K. (e-mail: [email protected]). C. Tsoumpas is with the Biomedical Imaging Science Department, School of Medicine, University of Leeds, Leeds LS2 9NL, U.K., also with the Department of Radiology, Translational and Molecular Imaging Institute, Icahn School of Medicine at Mount Sinai, New York, NY 10029 USA, and also with the Department of Research and Development, Invicro, Ltd., London W12 0NN, U.K. (e-mail: [email protected]).
This paper has supplementary downloadable material available at http://ieeexplore.ieee.org, provided by the author.
Color versions of one or more of the figures in this paper are available online at http://ieeexplore.ieee.org.
Digital Object Identifier 10.1109/TRPMS.2018.2884176
this paper suggest that including PET information in the kernel enhances the robustness of the reconstruction in case of spatial inconsistency. Nevertheless, accurate registration and choice of the appropriate MR image for the creation of the kernel is essential to avoid artifacts, blurring, and bias.
Index Terms—Anatomically driven, expectation maximization,
hybrid kernel, image prior, iterative reconstruction, kernel method, positron emission tomography (PET).
I. INTRODUCTION
M
ACHINE learning techniques are being frequently exploited for positron emission tomography (PET) image reconstruction [1]. Recently, techniques for PET image de-noising involving neural network approaches have been proposed [2], [3], as well as deep learning [4] and support vec-tor machine [5] techniques. The latter with the kernel method has been frequently used to include anatomical information in the reconstruction [6]–[9].Anatomically driven algorithms have become popular in PET. The rationale supporting the use of these techniques is based on the assumption that the radiotracer uptake distribu-tion follows specific anatomical patterns. As a consequence, the anatomical information from MR can be used as prior knowledge. Several studies have recently implemented and investigated different anatomically driven techniques, show-ing that they can suppress noise while preservshow-ing resolution that is usually lost through the regularization process. There are two different ways of including anatomical information in the reconstruction algorithm: 1) Bayesian techniques and 2) the kernel method. Bayesian techniques are also subdivided into segmentation-based [10]–[12] and segmentation-free tech-niques [13]–[24], the latter avoids the potential error due to segmentation. The kernel method can be divided into hybrid [7], [8], where the kernel matrix is extracted from more than one source (for example, PET and MR) and non-hybrid [5], [6], [9], [25], [26], where the kernel is estimated from one source.
In this paper we focus on the kernel method, the afore-mentioned techniques are based on the kernel method, com-monly used in machine learning and described in [27]. The method was first introduced in PET image reconstruction by Hutchcroft et al. [6] and Wang and Qi [5] using one source of information for the kernel matrix, MR and PET, respectively. Novosad and Reader [9] combined the method with temporal
Fig. 1. Learning and reconstruction framework for the HKEM for a generic n+1 subiteration.
basis functions in order to perform full dynamic PET recon-struction. Ellis and Reader [26] proposed the use of kernelized expectation maximization (KEM) in the context of dual-dataset longitudinal PET studies, where a baseline scan reconstruc-tion was used to define basis funcreconstruc-tions for a follow-up scan reconstruction. Gong et al. [7] used a hybrid kernel method to perform direct Patlak reconstruction from dynamic PET using MR and PET information where the latter was obtained by combining different frames. Bland et al. (2017) [28] studied the effect of KEM on simulated dose-reduced datasets, show-ing improved contrast to noise ratio, but at the cost of possible smoothing of features unique to the PET data. To over-come this issue Bland et al. (2018) [29] proposed a method using a spatially constrained MR kernel in order to main-tain the noise reduction properties of the conventional kernel method, whilst better retaining the features unique to the PET data. Spencer and Wang [30] proposed a dual-kernel approach for dynamic PET image reconstruction that combines the exist-ing nonlocal kernel with a local convolution kernel and demon-strated, with simulated brain dynamic data, higher image qual-ity than the standard single-kernel reconstruction approach.
Deidda et al. [8] presented a list-mode hybrid kernelized OSEM (LM-HKEM) that does not require preliminary PET image reconstruction to create a PET kernel matrix by exploit-ing the iterative process to extract the PET information. In addition, both proposed KEM and hybrid kernelized expec-tation maximization (HKEM) use a voxel-wise and spatially restricted kernel rather than a patch-wise one. The two tech-niques were evaluated for different count levels but with a focus on low count conditions corresponding to short acquisi-tion times. The aim of the study was to improve quantificaacquisi-tion in terms of bias and contrast recovery coefficient for the carotid arteries. The HKEM was also applied for the estimation of the image-derived input function from the aorta of rabbit models [31].
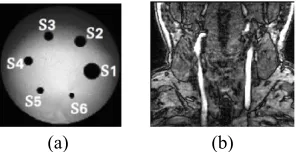
[image:2.612.364.512.327.403.2](a) (b)
Fig. 2. Slices of the MR images used to estimate the kernel matrix for the (a) phantom and (b) patient studies.
(a) (b) (c) (d)
Fig. 3. ROI chosen for the patient study. ROI shown on the (a) MR image for the 300-s acquisition, (b) PET image for the 300-s acquisition, (c) MR image for the 30-s acquisition, and (d) PET image for the 30-s acquisition.
[image:2.612.316.561.447.521.2]402 IEEE TRANSACTIONS ON RADIATION AND PLASMA MEDICAL SCIENCES, VOL. 3, NO. 4, JULY 2019
Fig. 4. Representation of the introduced MR translations using the phantom: from left to right 1, 2, 3, 5, and 10 voxels translation. The blue sphere is the ROI used for the quantification.
(a)
(b)
(c)
(d)
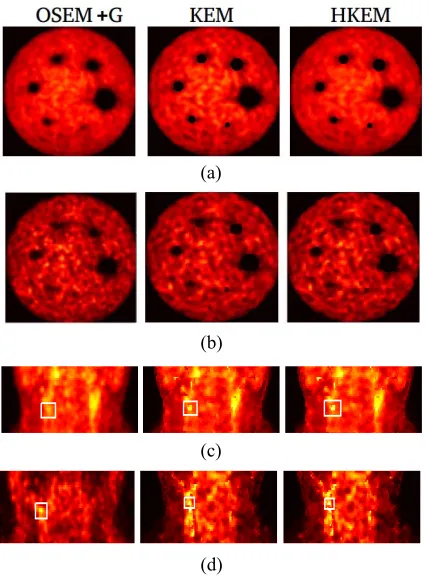
Fig. 5. Reconstructed images with OSEM, KEM using only MR and no shift, and HKEM with no shift, on all the datasets and count-levels. (a) Jaszczak phantom 50-s acquisition. (b) Jaszczak phantom 5 s. (c) Patient 300-s acquisition. (d) Patient 30-s acquisition.
is not acquired at the same time as PET. In this paper, we show the effect on the PET image of PET-MR inconsisten-cies, particularly for PET cold and hot regions that are crossed by MR regions. HKEM and KEM from [8] were used to reconstruct images for four types of dataset: 5- and 50-s acqui-sition with phantom data, and 30- and 300-s acquiacqui-sition with patient neck data. All the data were acquired with the Biograph Siemens mMR. Both algorithm implementations use spatially restricted kernels and, thus, reduced smoothing of the PET unique features is expected compared to the standard patch-based kernel methods as shown by Bland et al. (2018) [29]. The MR image was shifted by a different number of pixels along the x direction, and for each shift, the images were reconstructed for each augmented MR image.
II. KERNELIZEDIMAGERECONSTRUCTION
[image:3.612.69.283.179.468.2]The kernel approach can be applied to the LM-OSEM. The formulation in this paper follows the one in [8].
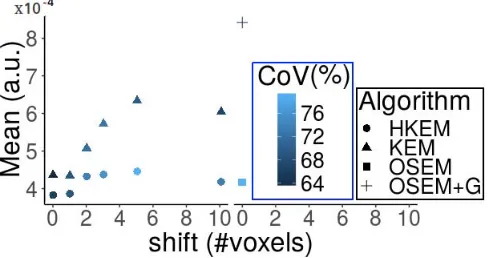
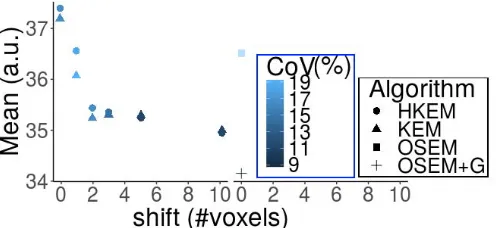
Fig. 6. Mean ROI activity concentration for each MR translation: comparison between reconstructed images with KEM using only MR, HKEM, and OSEM for the 50-s acquisition with the Jaszczak phantom. The x-axis is the MR image shift in terms of number of voxels.
Fig. 1 describes the process of the learning and reconstruc-tion of the HKEM method, the KEM diagram can be easily obtained by removing the PET component in the creation of the kernel. In the traditional kernel method the learning part comes before the reconstruction, while the HKEM contains an iterative learning component which comes from the iterative reconstructed image. Using the kernel method the imageλcan be written as follows:
λj= N
f=1
αfkfj (1)
where kfj is the fjth element of the kernel matrix andαis the
coefficient vector which is to be estimated during the expecta-tion maximizaexpecta-tion process shown in the diagram. At the first subiteration our input images, m for the MR and α0 for the PET, are used to extract the relative feature vectors, v and z0. For each voxel of the PET image the corresponding feature vectors, vj and z(jn), are extracted from the local
neighbor-hood of the voxel from the MR image and the PET update image, respectively. The number of elements in each feature vector was chosen as the total number of available voxels in the neighborhood, which is 27. This was a result of a preliminary study which is reported in Fig. 2, given in the supplementary material. The vj and z(jn) vectors represent the inputs for the
method, and the kernel matrix is calculated using the following functions:
km
vf,vj
=exp
−vf −vj 2
2σ2 m
exp
−xf −xj 2
2σdm2
[image:3.612.311.558.183.309.2]
(a)
(b)
[image:4.612.88.532.50.620.2](c)
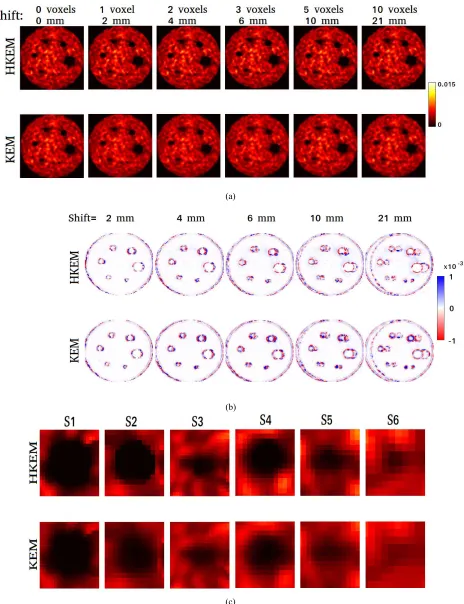
Fig. 7. Reconstructed phantom images with KEM and HKEM for 50-s acquisition with the Jaszczak phantom. The different columns represent a different shift (the first one is without shift), in terms of number of voxels. Comparison between (a) reconstructed images and (b) bias images. Reconstructed images with the correct MR are used as ground truth. (c) Zoomed-in view of the cold spheres for the case with shift=10 voxels.
is the kernel coming from the MR image and
kp
z(fn),z(jn) =exp
⎛ ⎜
⎝−
z(fn)−z(jn)2
2σ2 p
⎞ ⎟ ⎠exp
−xf −xj 2
2σdp2
(3)
is the part coming from the PET iterative update. The quantity
xj is the coordinate of the jth voxel, vj and z(jn)are the feature
vectors calculated, respectively, from the MR image and the
nth PET update image,α, whileσm,σp,σdm, andσdp (the last
404 IEEE TRANSACTIONS ON RADIATION AND PLASMA MEDICAL SCIENCES, VOL. 3, NO. 4, JULY 2019
(such as σm and σp), the feature vector, vj, is normalized so
that (2) becomes
km
vf,vj
=exp
−vf −vj 2
2(SDm)2σm2
exp
−xf −xj 2
2σdm2
(4) for km(vf,vj), where SDmis the standard deviation of the mean
voxel value over the whole MR image. For the PET contribu-tion, kp(z(fn),z(jn)), this normalization is slightly different. The
differences in (3) are normalized with αj(n)
kp
z(fn),z(jn) =exp
⎛ ⎜
⎝−
z(fn)−z(jn)2
2
α(n)
j 2 σ2 p ⎞ ⎟ ⎠exp
−xf −xj 2
2σdp2
.
(5) Once the kernel matrix is created, it is used in the first subiteration of HKEM to estimate α1, and as a consequence the PET image λ1. Consequently, the image α1 will be used to calculate the PET component of the kernel, while the MR component is stored in memory. The process will be repeated for every subiteration.
The iterative nature of the HKEM method allows the train-ing sample to be updated with more accurate information. In addition, preliminary reconstructions, to obtain the PET input to the kernel estimation step, are not necessary.
III. METHODS ANDMATERIALS A. Phantom Experiment
A phantom experiment was performed with a Jaszczak phantom for resolution studies and was acquired with the Siemens Biograph mMR scanner at Mount Sinai Hospital, New York, NY, USA. The phantom consists of cold spheres with different diameters, 31.8, 25.4, 19.1, 15.9, 12.7, and 9.5 mm. The background represents the hot region, which was filled with 155 MBq of 18F-fludeoxyglucose (FDG), and data were acquired over 1 h. The attenuation image was obtained from an MR volumetric interpolated examination (VIBE) acquisition, segmented into two tissue classes (air and water) [34]. The MR component of the kernel was obtained from a co-registered MR-VIBE sequence. The original voxel size was 0.35×0.35×1 mm3. The image is then aligned to the PET field of view (FOV) and resliced to match the PET native voxel size, 2.087×2.087×2.031 mm3, and FOV size, 344×344×127 voxels. The raw PET data were reconstructed in two different cases: 1) 5- and 2) 50-s acquisition-time frames. These frames correspond to the beginning of the acquisition obtained from the full LM file.
B. Patient Experiment
The LM-HKEM method was also applied to dynamic data of the head and neck region of a patient. The acquisition was carried out using the Siemens Biograph mMR at Mount Sinai Hospital and a consent form was signed by the patient. The patient was injected with [18F]FDG 184 MBq and scanned for 90 min. The attenuation images were obtained from the Dixon MR sequence using four tissue classes (fat, water,
Fig. 8. Mean activity concentration comparison between reconstructed phan-tom image with KEM, HKEM, and OSEM for 5-s acquisition with the Jaszczak phantom. The x-axis is the MR image shift in terms of number of voxels.
air, and bone), and contains attenuation coefficients for bed and coils [34]. The LM data were divided into shorter frames, 30 and 300 s. The scan started after 10 min from the injec-tion of the tracer. Note that the two different durainjec-tions are considered as two different datasets and the uptake in these datasets is not comparable due to different kinetic behavior, especially because they are the first frames after injection. The MR part of the kernel matrix is obtained from a time-of-flight (TOF) MR angiography sequence (Fig. 2), the original voxel size was 0.7×0.7×1 mm. It is then aligned to the PET FOV and resliced to match the PET native voxel size, 2.087×2.087×2.031 mm3, and FOV size, 344×344×127 voxels. The MR TOF acquisition time is 540 s. A head and neck coil was employed: three slabs, each consisting of 60 slices of 1-mm thickness. This image sequence is particu-larly suitable for studying the carotid because it provides high contrast between the carotid arteries and the surrounding tissues.
C. Reconstruction Setup
All the datasets were reconstructed with 21 subsets and three iterations using HKEM and KEM. The subset division for the LM reconstruction is made by subdividing the events accord-ing to the view number. The values of the kernel parameters for this paper are set to give the best tradeoff between quan-tification accuracy and noise suppression while minimizing PET feature suppression: N = 3 ×3 ×3, σm = σp = 1,
andσdm =σdp=5. The best tradeoff between quantification
and noise suppression was estimated as the maximum CNR. For small values of σdm the HKEM will be always noisier
than the KEM because the hybrid kernel contains also the noise from the PET image. When theσdmincreases, the noise
[image:5.612.316.560.57.186.2](a)
(b)
[image:6.612.78.542.51.655.2](c)
Fig. 9. Reconstructed phantom images with KEM using only MR and HKEM on 5-s acquisition. The different columns represent a different shift (the first one is without shift), in terms of number of voxels. Comparison between (a) reconstructed images and (b) bias images and reconstructed images with the correct MR are used as ground truth. (c) Zoomed-in view of the cold spheres for the case with shift=10 voxels with HKEM and KEM.
less noise suppression [bigger coefficient of variation (CoV)] but at the same time a smaller bias. The calculated RMSE, which provides a tradeoff between bias and noise, does not
406 IEEE TRANSACTIONS ON RADIATION AND PLASMA MEDICAL SCIENCES, VOL. 3, NO. 4, JULY 2019
size of the neighborhood. The comparison is made at the third iteration, as early stopping is routinely used in hospi-tals. The different frame durations are obtained by selecting only events which have occurred during the first 50 and 5 s for the phantom, and 300 and 30 s for the patient.
Scatter correction was performed with the method described in [35] and [36]. Randoms were estimated from singles, which were calculated from delayed events [37]. The procedures for these evaluations including attenuation and normalization cor-rections [38], make use of Software for Tomographic Image Reconstruction library [39] version 3.0. All datasets were reconstructed using span 11. The MR image, for both experi-ments, was translated by 1, 2, 3, 5, and 10 voxels (as in Fig. 4) along the x-direction in order to study the effect of inaccu-rate registration between PET and MR images, and also to introduce differences so that different case scenarios can be explored. Note that the attenuation image was not translated so that we only study the effect of the anatomical image used for the kernel.
D. Image Analysis
The comparison was carried out in terms of mean activity concentration. Region of interest (ROI) analysis was per-formed using: a sphere in a uniform cold region of the phantom represented by the blue circle in Fig. 4, extracted from the MR image whereas for the patient, the ROI was obtained using a few steps: first, the carotid was segmented using the MR image, which was also used as a mask on the HKEM image; a threshold was applied on the HKEM image only to segment the hot part of the carotid; finally it was cropped to match the shape of the lesion in both HKEM and KEM image as the shape of the hot lesions are the same in HKEM and KEM (as can be seen in Fig. 5). In this paper, what is different between the HKEM and KEM lesion is the uptake. The ROI was not taken from the MR image because it provides the whole carotid, while the OSEM image is substantially affected by PVE. One ROI is used for the 300-s acquisition, and the other for the 30-s acquisition as the kinetics and possible motion make the two datasets very different (Fig. 3).
Quantitative comparison between algorithms was performed using the following figure of merit:
mean=
izi
V (6)
where zi is the value of voxel inside the ROI and V is the
number of voxels included in the ROI. To estimate the bias images, showing the induced error for each MR translation, the reconstructed images with the correct MR is used as ground truth, also labeled as shift = 0. The difference between the CoV, which is defined as the percentage SD, was used in the measured ROI to asses the noise and the repeatability of the measure.
IV. RESULTS
[image:7.612.314.562.56.170.2]In this paper, we show the effect of the anatomically driven kernel method on the PET reconstructed images, with a focus on those occasions where MR and PET information do not
Fig. 10. Mean activity concentration comparison between reconstructed patient image with KEM using only MR and HKEM and OSEM on 300-s acquisition. The x-axis is the MR image shift in terms of number of voxels.
match. To recreate these circumstances the MR image was translated along the x-axis creating some specific cases, such as a cold PET region partially crossed or surrounded by an MR well-defined region with the phantom data, and hot lesion partially crossed by MR regions with the patient data. All the shifts can be seen in Fig. 4. The blue circles in the figure help to better understand and locate the area we are studying. This investigation was carried out using the hybrid and nonhybrid kernel methods in [8] to explore the limitation of these meth-ods as well as to study whether the hybrid method performs better when small differences between PET and MR images are introduced. Theσm andσp from (2) and (3) were fixed at
1 to maximize CNR.
The values of the two modulation parameters,σdmandσdp,
(a)
[image:8.612.69.548.63.320.2](b)
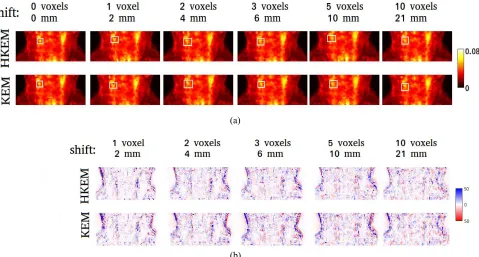
Fig. 11. (a) Reconstructed patient images with KEM using only MR and HKEM on 300-s acquisition using different translations. (b) Difference images between the nonshift case and all the different translations for HKEM and KEM, reconstructed images with the correct MR are used as ground truth. The different columns represent a different shift (the first one is without shift).
KEM and OSEM is shown. In particular Fig. 11(a) shows the reconstructed images with each translation, while Fig. 11(b) reports the bias images estimated as the difference between the image reconstructed with the correct MR and the image obtained using each translated MR. The same is repeated for the 30-s acquisition, where image-based and quantitative results are shown in Figs. 12 and 13, respectively.
V. DISCUSSION
The images in Fig. 5 show the improvements, in terms of contrast and resolution, provided by the two anatomically-driven kernelized methods over the OSEM. With the Jaszczak phantom we investigated the effect of the PET-MR misalign-ment on cold spheres: in Fig. 6 the ROI mean shows how the mean value, which is supposed to be zero, increases as the shift increases, with a significantly stronger effect for KEM. The maximum increase is 100% for KEM against the 37% of HKEM. This is due to the introduction of the PET information in the kernel, which makes HKEM more flexible allowing the PET borders to be restored. The increase in activity along with the shift seems to indicate that the activity was pushed from its original position to the area after the MR border. Fig. 7 shows the same result visually, where the effect of the dif-ference between PET and MR can already be seen for the 1 voxel shift for both HKEM and KEM. Bias appears close to the borders of the MR and PET images. In particular, we can see positive bias in the cold region and negative bias in the hot regions close to the borders. It is also possible to see that the smoothing effect is more significant for the smaller spheres.
Fig. 12. Mean activity concentration comparison between reconstructed patient image with KEM using only MR and HKEM and OSEM on 30-s acquisition. The x-axis is the MR image shift in terms of number of voxels.
For the 5-s acquisition, Fig. 8 shows more moderate vari-ation than the higher count case. In this case the maximum variation was 33% for KEM and 15% for HKEM with the 5 voxels shift. The fact that the short acquisition shows less quantitative change than the 50-s acquisition is probably due to the fact that the noise here has a more important impact and there is already an increased uptake even with the correct MR image. In fact, the OSEM value is close to the “wrong” HKEM value. Looking at the zoomed-in view of the spheres in Fig. 9 it is possible to see that the degradation is actually more visible for the low count.
[image:8.612.314.560.386.508.2]408 IEEE TRANSACTIONS ON RADIATION AND PLASMA MEDICAL SCIENCES, VOL. 3, NO. 4, JULY 2019
(a)
[image:9.612.56.554.62.318.2](b)
Fig. 13. (a) Reconstructed patient images with KEM using only MR and HKEM on 30-s acquisition using different translations. (b) Difference images between the nonshift case and all the different translations for HKEM and KEM, reconstructed images with the correct MR are used as ground truth. The different columns represent a different shift (the first one is without shift), in terms of number of voxels.
variety of visible tissue in the MR image. Fig. 10 shows the translation consequences for the 300-s acquisition. We can see an instant drop of uptakes as soon as the shift takes place. The HKEM performs better for the small shifts, however, after the 2 voxels translation it behaves similarly to the KEM with a maximum variation of 7% for both. Although the ROI analysis for the hot regions show more moderate variation than the case of the cold spheres, in Fig. 11 it is possible to see that the shape of the lesion changes with the shift and becomes gradually blurred. It is a consistent results over the different count-levels that when the inconsistency is too severe HKEM behaves similarly to KEM. In Fig. 3 (given in the supplementary material), a similar analysis is shown for a 5400-s acquisition dataset. Also, negative and positive bias can be seen all over the image, which can reach 50% in certain locations. The ROI quantification for the 30-s acquisition, as reported in Fig. 12, shows slightly more significant variation with a maximum of 10% for KEM and 8% for HKEM. In this case, HKEM performs better for all translations except the 5 voxel translation. Similarly for the 300s case, in Fig. 13 it is possible to see the gradual blurring of the lesion and the variation voxel by voxel for all the different shifts. The dark blue and the dark red areas in Figs. 11(b) and 13(b) represent a bias of up to 50% and which is more important for the low-count case. Note that, 2 cm of motion is probably too big to be missed, and this type of motion can be corrected by registration. However, in this case we studied the effect of the uniform MR area of the neck overlaying the carotid artery of the PET image. This represents, for example, cases where a high uptake region in PET does not show any signal in the MR. In general, the PET-MR inconsistencies can induce partial volume effects, more specifically spill-in for the cold regions
and spill-out for the hot regions. The more significant errors are introduced for the cold spheres than the hot lesions. In this case the HKEM appears more flexible thanks to the PET information included in the kernel. The average ROI error for the hot lesions was always smaller or equal to 10% and the HKEM outperformed KEM only in some cases while they behave similarly in other. Finally, although the PET-MR spa-tial inconsistencies introduce voxel variations and errors, it is a consistent result over our datasets that the application of a 5-mm Gaussian filter provide a significantly bigger PVE than the one created by any MR translation, while OSEM provide accurate but very noisy results. This can be seen in Figs. 5, 6, 8, 10, and 12. The CoV showed up to a 20% differ-ence between HKEM and KEM when using the phantom. On the other hand, for the patient data the difference was always around or lower than 1% Note that if the PET and MR images have the same dimensions and voxel size, then the Euclidean distances in (2) and (3) are the same. For the KEM there is noσdp but only σdm. The extra spatial Gaussian term and the
Gaussian term with the PET information contribute to improve the PET unique feature preservation compared to KEM. A nar-rower Gaussian term for KEM can be obtained with smaller
σdm, however this comes at the cost of CNR. In fact, the
maxi-mum CNR was obtained withσdm=5. The findings highlight
VI. CONCLUSION
In this paper, we showed the effect of introduced mis-matches between PET and MR images, for cold and hot regions, when we use the kernel method with MR information for PET reconstructed images. We showed that even small changes in the MR can result in a change in quantification and blurring. Moreover, hybrid information can help to reduce this effect, especially in the case of cold regions. The ideal solution is to avoid MR sequences having tissue-borders crossing the PET ROI as well as a very accurate PET-MR registration. In addition, creating a protocol where the chosen MR sequence is acquired during the PET scan would minimize the PET-MR inconsistencies.
ACKNOWLEDGMENT
The authors would like to thank the group in Mount Sinai Hospital for data support and Dr. K. Thielemans INM, UCL. They would also like to thank the reviewers and the editor for dedicating their time to help significantly improve this paper.
REFERENCES
[1] G. Wang, J. C. Ye, K. Mueller, and J. A. Fessler, “Image reconstruction is a new frontier of machine learning,” IEEE Trans. Med. Imag., vol. 37, no. 6, pp. 1289–1296, Jun. 2018.
[2] B. Yang, L. Ying, and J. Tang, “Artificial neural network enhanced Bayesian PET image reconstruction,” IEEE Trans. Med. Imag., vol. 37, no. 6, pp. 1297–1309, Jun. 2018.
[3] K. Gong et al., “Iterative PET image reconstruction using convolu-tional neural network representation,” IEEE Trans. Med. Imag., to be published, doi:10.1109/TMI.2018.2869871.
[4] K. Kim et al., “Penalized PET reconstruction using deep learning prior and local linear fitting,” IEEE Trans. Med. Imag., vol. 37, no. 6, pp. 1478–1487, Jun. 2018.
[5] G. Wang and J. Qi, “PET image reconstruction using kernel method,” IEEE Trans. Med. Imag., vol. 34, no. 1, pp. 61–71, Jan. 2015. [6] W. Hutchcroft, G. B. Wang, and J. Qi, “Anatomical-image aided PET
reconstruction by the kernel method,” J. Nucl. Med., vol. 55, no. S1, pp. 6668–6683, 2014.
[7] K. Gong et al., “Direct Patlak reconstruction from dynamic PET data using the kernel method with MRI information based on structural similarity,” IEEE Trans. Med. Imag., vol. 37, no. 4, pp. 955–965, Apr. 2018.
[8] D. Deidda et al., “Hybrid PET-MR list-mode kernelized expectation maximization reconstruction for quantitative PET images of the carotid arteries,” in Proc. NSS/MIC, Atlanta, GA, USA, 2017, pp. 1–7. [9] P. Novosad and A. J. Reader, “MR-guided dynamic PET reconstruction
with the kernel method and spectral temporal basis functions,” Phys. Med. Biol., vol. 61, no. 12, pp. 4624–4645, 2016.
[10] K. Baete et al., “Evaluation of anatomy based reconstruction for par-tial volume correction in brain FDG-PET,” Neuroimage, vol. 23, no. 1, pp. 305–317, 2004.
[11] K. Goffin et al., “Anatomy-based reconstruction of FDG-PET images with implicit partial volume correction improves detection of hypometabolic regions in patients with epilepsy due to focal cortical dysplasia diagnosed on MRI,” Eur. J. Nucl. Med. Mol. Imag., vol. 37, no. 6, pp. 1148–1155, 2010.
[12] J. Nuyts, K. Baete, D. Bequé, and P. Dupont, “Comparison between MAP and postprocessed ML for image reconstruction in emission tomography when anatomical knowledge is available,” IEEE Trans. Med. Imag., vol. 24, no. 5, pp. 667–675, May 2005.
[13] R. Leahy and X. Yan, “Incorporation of anatomical MR data for improved functional imaging with PET,” in Information Processing in Medical Imaging. Heidelberg, Germany: Springer, 1991, pp. 105–120, doi:10.1007/BFb0033746.
[14] B. Lipinski, H. Herzog, E. R. Kops, W. Oberschelp, and H. W. Müller-Gärtner, “Expectation maximization reconstruction of positron emission tomography images using anatomical magnetic resonance information,” IEEE Trans. Med. Imag., vol. 16, no. 2, pp. 129–136, Apr. 1997.
[15] J. E. Bowsher et al., “Bayesian reconstruction and use of anatomical a priori information for emission tomography,” IEEE Trans. Med. Imag., vol. 15, no. 5, pp. 673–686, Oct. 1996.
[16] J. Tang and A. Rahmim, “Bayesian PET image reconstruction incorpo-rating anato-functional joint entropy,” Phys. Med. Biol., vol. 54, no. 23, pp. 7063–7075, 2009.
[17] S. Somayajula et al., “PET image reconstruction using information theoretic anatomical priors,” IEEE Trans. Med. Imag., vol. 30, no. 3, pp. 537–549, Mar. 2011.
[18] K. Vunckx et al., “Evaluation of three MRI-based anatomical priors for quantitative PET brain imaging,” IEEE Trans. Med. Imag., vol. 31, no. 3, pp. 599–612, Mar. 2012.
[19] M. J. Ehrhardt et al., “Joint reconstruction of PET-MRI by exploit-ing structural similarity,” Inverse Problems, vol. 31, no. 1, 2014, Art. no. 015001.
[20] A. Mehranian, M. A. Belzunce, C. Prieto, A. Hammers, and A. J. Reader, “Synergistic PET and SENSE MR image reconstruction using joint spar-sity regularization,” IEEE Trans. Med. Imag., vol. 37, no. 1, pp. 20–34, Jan. 2018.
[21] J. Jiao et al., “Detail-preserving PET reconstruction with sparse image representation and anatomical priors,” in Proc. Inf. Process. Med. Imag., vol. 24, Jun. 2015, pp. 540–551.
[22] A. Mehranian et al., “PET image reconstruction using multi-parametric anato-functional priors,” Phys. Med. Biol., vol. 62, no. 15, pp. 5975–6007, 2017.
[23] F. Knoll et al., “Joint MR-PET reconstruction using a multi-channel image regularizer,” IEEE Trans. Med. Imag., vol. 36, no. 1, pp. 1–16, Jan. 2017.
[24] G. Schramm et al., “Evaluation of parallel level sets and Bowsher’s method as segmentation-free anatomical priors for time-of-flight PET reconstruction,” IEEE Trans. Med. Imag., vol. 37, no. 2, pp. 590–603, Feb. 2018.
[25] W. Hutchcroft, G. Wang, K. T. Chen, C. Catana, and J. Qi, “Anatomically-aided PET reconstruction using the kernel method,” Phys. Med. Biol., vol. 61, no. 18, pp. 6668–6683, 2016.
[26] S. Ellis and A. J. Reader, “Kernelised EM image reconstruction for dual-dataset PET studies,” in Proc. NSS/MIC, Strasbourg, France, 2016, pp. 1–3.
[27] T. Hoffman, B. Schölkopf, and A. Smola, “Kernel methods in machine learning,” Ann. Stat., vol. 36, no. 3, pp. 1171–1220, 2008.
[28] J. Bland et al., “MR-guided kernel EM reconstruction for reduced dose PET imaging,” IEEE Trans. Radiat. Plasma Med. Sci., vol. 2, no. 3, pp. 235–243, May 2018.
[29] J. Bland et al., “Spatially compact MR-Guided kernel EM for PET image reconstruction,” IEEE Trans. Radiat. Plasma Med. Sci., vol. 2, no. 5, pp. 470–482, Sep. 2018.
[30] B. Spencer and G. Wang, “Statistical image reconstruction for shortened dynamic PET using a dual kernel method,” in Proc. NSS/MIC, Atlanta, GA, USA, 2017.
[31] D. Deidda et al., “Hybrid PET-MR kernelised expectation maximi-sation reconstruction for improved image- derived estimation of the input function from the aorta of rabbits,” Contrast Media Mol. Imag., Nov. 2018.
[32] M. J. Ehrhardt et al., “PET reconstruction with an anatomical MRI prior using parallel level sets,” IEEE Trans. Med. Imag., vol. 35, no. 9, pp. 2189–2199, Sep. 2016.
[33] D. Strul and B. Bendriem, “Robustness of anatomically guided pixel-by-pixel algorithms for partial volume effect correction in positron emission tomography,” J. Cerebral Blood Flow Metab., vol. 19, no. 5, pp. 547–559, 1999.
[34] N. Karakatsanis et al., “MR-based attenuation correction in cardio-vascular PET/MR imaging: Challenges and practical solutions for cardiorespiratory motion and tissue class segmentation,” J. Nucl. Med., vol. 57, no. S2, p. 452, 2016.
[35] C. Tsoumpas, P. Aguiar, K. S. Nikita, D. Ros, and K. Thielemans, “Evaluation of the single scatter simulation algorithm implemented in the STIR library,” in Proc. IEEE NSS/MIC/RTSD, vol. 6, 2004, pp. 3361–3365.
[36] I. Polycarpou et al., “Comparative evaluation of scatter correction in 3D PET using different scatter-level approximations,” Ann. Nucl. Med., vol. 25, no. 9, pp. 643–649, 2011.
[37] M. W. Jacobson and K. Thielemans, “Optimizability of loglikelihoods for the estimation of detector efficiencies and singles rates in PET,” in Proc. IEEE NSS/MIC/RTSD, 2008, pp. 4580–4586.
[38] D. Hogg, K. Thielemans, T. Spinks, and N. Spyrou, “Maximum-likelihood estimation of normalisation factors for PET,” in Proc. IEEE NSS/MIC, vol. 4. San Diego, CA, USA, 2001, pp. 2065–2069. [39] K. Thielemans et al., “STIR: Software for tomographic image