Int. J. Electrochem. Sci., 14 (2019) 5813 – 5819, doi: 10.20964/2019.06.65
International Journal of
ELECTROCHEMICAL
SCIENCE
www.electrochemsci.orgShort Communication
A Mesoporous Carbon-Based Amperometric Sensor for
Ascorbic Acid Determination
Haiyang Zhang1, Zuode Gong3, Hongyu Jing2, Mengna Duan1, Min Wang1, Ming Qian1,*
1 Department of Prosthodontics, School of Stomatology, Jilin University, Changchun, China 2 Department of Respiratory, First Hospital of Jilin University, Changchun, China
3 Jinan Stomatological Hospital, Jinan, China *E-mail: [email protected]
Received: 27 November 2018 / Accepted: 5 March 2019 / Published: 10 May 2019
Using ordered mesoporous carbon (OMC) as the sensing material, an amperometric biosensor for ascorbic acid (AA) determination was successfully built on a glassy carbon electrode (GCE). Using a micro-electrochemistry system (MECS), the detection capability of the sensor was evaluated. Compared with the results obtained for a bare GCE, the AA oxidation overpotential of the OMC detector decreased by approximately 800 mV. The electro-catalytic oxidation peak currents had a linear relationship with the AA concentration over the range of 3.5 × 10⁻⁷ - 7 × 10⁻⁵ mol/L and a detection limit of 1.5 × 10⁻⁷
mol/L (S/N = 3). Additionally, the sensor was shown to be interference free and exhibited good stability and reproducibility.
Keywords: Ordered mesoporous carbon, Ascorbic acid, Dopamine, Uric acid, Amperometric, Sensor
1. INTRODUCTION
For human survival, ascorbic acid (AA) plays a compulsory and very important role. However, AA bioavailability is highly dependent on dietary intake and cannot be biochemically synthesized in the human body. Therefore, determination of the AA concentrations in food is of high importance. It is essential to develop simple and rapid methods for the determination of AA in the pharmaceutical and food industries. For this purpose, multiple methods have been developed [6, 7]. Among them, electrochemical methods have been considered to be one of the most promising approaches due to the high sensitivity and simplicity of these methods. However, on bare electrodes, AA exhibits a high oxidation overpotential and irreversible electrochemical behaviour [8], resulting in electrode fouling, poor reproducibility, low selectivity and poor sensitivity. Thus, various chemically modified electrodes (CME) have been developed to decrease the AA oxidation overpotential. For example, Tian [9] obtained a decrease in the overpotential of 220 mV on a vanadium oxide polypropylene carbonate modified GCE. On a carbon nanotube and redox-polymer multilayered film-modified screen-printed carbon electrode [10], the decrease in overpotential was approximately 350 mV.
For AA determination, newer materials with simple production processes and high electro-catalytic activities are still needed. Here, an OMC-0.6 material is presented. AA oxidation is catalysed by this material with a decrease in the overpotential of approximately 800 mV compared to a bare GCE, and AA can be selectively determined in the presence of UA and DA.
2. EXPERIMENTAL
Based on previously reported methods [5], ordered mesoporous carbon (OMC) was synthesized. Because the silica-to-sucrose ratio (w/w) was controlled to be 0.6, this material was labelled OMC-0.6. Ascorbic acid (AA), potassium chloride (KCl), potassium ferricyanide (K3Fe(CN)6), potassium
dihydrogen phosphate (KH2PO4), dipotassium hydrogen phosphate (K2HPO4) and uric acid (UA) were
purchased from Beijing Chemical. Co. Ltd. Doubly distilled water was used throughout the experiment. X-ray diffraction (XRD) results were obtained on a D4 X-ray diffractometer (Brucker, Germany) with Cu Kα radiation (λ = 0.15406 nm) operating at 40 kV and 20 mA. N2-adsorption isotherms were
carried out on an ASAP 2020 (Micromeritics, USA), and the pore size distributions (PSD) were calculated using the BJH method. Raman spectroscopy was obtained on a Renishaw-1000 Raman spectrometer (Renishaw, UK).
3. RESULTS AND DISCUSSION
The characteristics of OMC-0.6 are described as follows. From the XRD pattern, the three well-resolved XRD peaks of OMC can be assigned to the (100), (110), and (200) planes, which are characteristic of a 2-D hexagonal P6mm symmetry, indicating that OMC-0.6 possess an ordered arrangement of hexagonally uniform mesopores with long-range order [3]. From the Raman spectrum, the G peak at approximately 1577 cm-1 and the D peak at approximately 1326 cm-1 are assigned to the
Raman-active E2g mode and the presence of defects in the graphitic layer, respectively. The relative
intensity ratio of the D and G bands (ID/IG ratio) was calculated to be 1.58, which is higher than that of other reported OMC-x materials (x = 0.6) [11]. According to previous reports [12, 13], it can be concluded that more edge-plane defective sites exist on the surface of 0.6 than do for other OMC-x materials (OMC-x = 0.6). The N2 adsorption isotherm of OMC-0.6 exhibits a typical type IV shape, according
to IUPAC classification, indicating its mesoporous characteristics. The pore size and volume were calculated to be 4.7 nm and 987 m2 g-1, respectively, which indicates that OMC-0.6 has a high pore volume and surface heterogeneity, which are beneficial for electro-catalytic applications [14, 15].
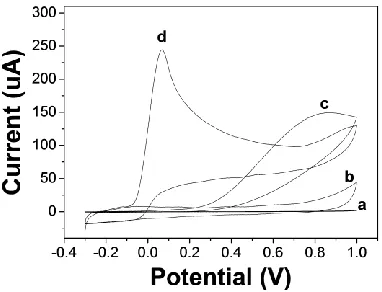
Figure 1. CV curves obtained from the OMC-0.6/GCE (a) and bare GCE (b) in a 5 mM K3Fe(CN)6 +
0.1 M KCl solution, scan rate: 50 mV/s. The inset shows the plot of the peak current vs square root of the scan rate obtained for the OMC-0.6/GCE in a 5 mM K3Fe(CN)6 + 0.1 M KCl solution.
[image:3.596.198.397.351.492.2] [image:3.596.199.390.581.727.2]
The OMC-0.6/GCE was first studied using cyclic voltammetry (CV) in a 5 mM K3Fe(CN)6 + 0.1
M KCl solution. As shown in Fig. 1, the peak separation was 96 mV for the bare GCE (a) and 63 mV for the OMC-0.6/GCE (b), which suggested a faster electron transfer rate in the OMC-0.6/GCE [4]. Additionally, the peak currents obtained for the OMC-0.6/GCE were much higher than those of the GCE. According to the Randles-Sevcik equation, the peak currents are proportional to the area of the electro-active surface area, which means that the electro-electro-active surface area of the OMC-0.6/GCE is larger than that of the bare GCE. The results above indicate that the OMC-0.6/GCE has a relatively better electrochemical reactivity, which is attributed to the large number of edge plane defect sites on the OMC-0.6 surface that are accessible to the electrolyte [16].
The inset of Fig. 1 shows the plot of the peak current vs. square root of the scan rate, which was obtained on the OMC-0.6/GCE in a 5 mM K3Fe(CN)6 + 0.1 M KCl solution. It was found that the curve increased linearly over the range of 0.01 to 0.2 V/s, which indicated that the electrode reaction was controlled by diffusion.
Fig. 2 shows the CV curves of the bare GCE and OMC-0.6/GCE in 1.15 mol/L PBS solution (pH 7.0) in both the absence and presence of 10 mmol/L of AA. As seen, when no AA is present, both the GCE and OMC-0.6/GCE exhibit no electrochemical response, whereas in the presence of AA, electrochemical responses are observed for all the electrodes. Compared with the bare GCE, the AA oxidation overpotential decreases by approximately 800 mV on the OMC-0.6/GCE, which can be attributed to the edge plane defect sites on the OMC-0.6 surface [12, 13].
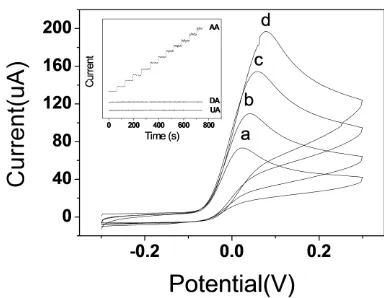
Figure 3. CV curves of the OMC-0.6/GCE in a 1.15 mol/L PBS solution (pH 7.0) in the presence of 0.4 (a), 0.5 (b), 0.6 (c) and 0.7 mmol/L (d) of AA, scan rate: 20 mV/s. The inset shows the current vs time curves for the successive additions of AA, UA or DA to PBS to form the same final concentration, the applied potential is 0 V.
Fig. 3 shows the CV curves of the OMC-0.6/GCE in a 1.15mol/L PBS solution (pH 7.0) in the presence of different concentrations of AA. It can be seen that the oxidation currents increased significantly with increasing AA, which suggests that the OMC-0.6/GCE has excellent electro-catalytic activity towards the oxidation of AA and can be used as an AA electrochemical sensor.
[image:4.596.196.388.428.577.2]
chosen to act as interfering agents. The inset of Fig. 3 shows the current vs. time curves for the successive additions of AA, DA or UA to PBS to form the same final concentrations. The applied potential is 0.0 V. As can be observed from the plots, with increasing amounts of AA, the oxidative current increased and the response time was fast. A linear relationship between the current response and AA concentration was obtained over the range of 3.5 × 10⁻⁷ to 7 × 10⁻⁵ mol/L with a correlation coefficient of 0.999 (n =
10), and the detection limit was 1.5 × 10⁻⁷ mol/L (S/N = 3). No changes in the oxidative currents were
seen upon the addition of UA or DA, which proved that AA could be selectively determined in the presence of UA and DA.
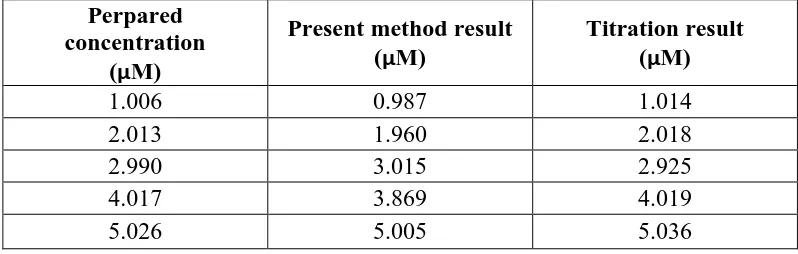
[image:5.596.98.497.631.758.2]Table 1 presents a comparison between the analytical performances of previously reported AA sensors and that of the current work. From the comparison, it can be concluded that the present method has a relatively low detection limit, and it is linear over a range that several of the methods cannot reach. To test the applicability of the present method, the iodine method (a kind of titration) was used as a standard reference [23]. For comparison, five different concentrations of AA were prepared and subsequently determined with both methods and the results are included in Table 2. A good correlation was obtained between the present method (X) and the titration method (Y) with a linear regression equation of Y = 1.008X + 0.0106 (R2 = 0.996), which proved the applicability of the present method for the determination of AA.
Table 1. Comparison of the analytical performance of reported AA sensors vs. this work
Ref. Electrodes Linear range
(mM) Detection limit (µM)
17 NiCoO2/C/GCE 0.02 - 2.41 0.5
18 PdNi/C/GCE 0.01 - 1.80 0.5
19 GS/GNR/GCE 0.01 - 0.36 0.23
20 PG/GCE 9.0 - 2314 6.45
21 Graphene/Pt/GCE 0.00015 - 0.0344 0.15
22 AuNP/GO/GCE 0.1 - 0.6 0.11
This work OMC/GCE 0.35 - 0.7 0.15
Table 2. Comparison of the determination results towards different concentrations of AA obtained by titration and the present method.
Perpared concentration
(µM)
Present method result (µM)
Titration result (µM)
1.006 0.987 1.014
2.013 1.960 2.018
2.990 3.015 2.925
4.017 3.869 4.019
The repeatability of the present sensor was studied by performing parallel experiments, for which the relative standard deviation was 4% (n = 10). After storing at 4 °C for two weeks, the response of the present sensor to a 1 mmol/L solution of AA decreased by less than 3% of the initial value, which proved this detector has good stability.
For the application of this sensor to real sample analysis, a commercially available sample, a vitamin C boiling tablet, was chosen. Using the standard addition method, the average recovery was 98.0% (R.S.D. 3.6%, n = 6), which was a satisfactory result and further proved the application value of the sensor.
4. CONCLUSIONS
Using an OMC-0.6 material as the sensing material, an AA sensor was successfully constructed. With the sensor, the AA oxidation over-potential decreased by approximately 800 mV compared to a bare GCE, and it was found that AA can be selectively determined in the presence of DA and UA. Additionally, this method of sensor construction possesses great potential applicability to the detection of AA or other species.
ACKNOWLEDGEMENTS:
This work was supported by grants from Development and Reform Commission of Jilin Provincial (2019C049-1) and the Education Department of Jilin Province (No. JJKH20190192KJ).
References
1. C.T. Kresge, M.E. Leonowicz, W.J. Roth, J.C. Vartuli and J.S. Beck, Nature, 359 (1992) 710. 2. J.S. Beck, J.C. Vartuli, W.J. Roth, M.E. Leonowicz, C.T. Kresge, K.D. Schmitt, C.T.W. Chu, D.H.
Olson, E.W. Sheppard, S.B. McCullen, J.B. Higgins and J.L. Schlenker, J. Am. Chem. Soc., 114 (1992) 10834.
3. B. Qi, X.J. Peng, J. Fang and L.P. Guo, Electroanalysis, 21 (2009) 875. 4. B. Qi, F.Y. Lin, J. Bai, L. Liu and L.P. Guo, Mater. Lett., 62 (2008) 3670. 5. Y. Hou, L.P. Guo and G. Wang, J. Electroanal. Chem., 617 (2008) 211. 6. R. Leubolt and H. Klein, J. Chromatogr., 640 (1993) 271.
7. A.P. Dos Reis, C.R.T. Tarley, N. Maniasso and L.T. Kubota, Talanta, 67 (2005) 829. 8. R.N. Adams, Anal. Chem., 48 (1976) 1126A.
9. L. Tian, L. Chen, L. Liu, N. Lu, W. Song and H. Xu, Sens. Actuators. B., 113 (2006) 150. 10. Y.F. Sha, L. Qian, Y. Ma, H.X. Bai and X.R. Yang, Talanta, 70 (2006) 556.
11. A. Vinu, P. Srinivasu, M. Takahashi, T. Mori, V.V. Balasubramanian and K. Ariga, Microporous Mesoporous Mater., 100 (2007) 20.
12. V. Georgakilas, D. Voulgaris, E. Vazquez, M. Prato, D.M. Guldi, A. Kukovecz and H. Kuzmany, J. Am. Chem. Soc., 124 (2002) 14318.
13. A.C. Ferrari and J. Robertson, Phys. Rev. B., 61 (2000) 14095.
14. A. Vinu, M. Miyahara and K. Ariga, J. Phys. Chem. B., 109 (2005) 6436. 15. M. Hartmann, A. Vinu and G. Chandrasekar, Chem. Mater., 17 (2005) 829.
17. X. Zhang, S. Yu, W. Y. He, H. Uyama, Q.J. Xie, L. Zhang and F.C. Yang, Biosens. Bioelectron., 55 (2014) 446.
18. X. Zhang, Y. Cao, S. Yu, F.C. Yang and P.X. Xi, Biosens. Bioelectron., 44 (2013) 183. 19. J. Lavanya and N. Gomathi, Talanta, 144 (2015) 655.
20. S.P. Qi, B. Zhao, H.Q. Tang and X.Q. Jiang, Electrochim. Acta, 161 (2015) 395. 21. C.L. Sun, H.H. Lee, J.M. Yang and C.C. Wu, Biosens. Bioelectron., 26 (2011) 3450.
22. J. Song, L. Xu, R.Q. Xing, Q.L. Li, C.Y. Zhou, D.L. Liu and H.W. Song, Sci. Rep., 4 (2014) 7515. 23. Chinese Pharmacopoeia, 2 (2010) 901.