Rochester Institute of Technology
RIT Scholar Works
Theses
Thesis/Dissertation Collections
10-1-1998
Design and implementation of a DSP based
MPEG-1 audio encoder
Eric Hoekstra
Follow this and additional works at:
http://scholarworks.rit.edu/theses
This Thesis is brought to you for free and open access by the Thesis/Dissertation Collections at RIT Scholar Works. It has been accepted for inclusion in Theses by an authorized administrator of RIT Scholar Works. For more information, please [email protected].
Recommended Citation
Design and Implementation of a DSP Based
MPEG-l Audio Encoder
by
Eric Hoekstra
A Thesis Submitted
InPartial Fulfillment of the
Requirements for the Degree of
MASTER OF SCIENCE
InComputer Engineering
Approved by:
Principle Advisor
Muhammad Shaaban, Assistant Professor
Committee Member
Roy S. Czemikowski, Professor and Department Head,
Committee Member
Soheil
A.
Dianat, Professor, Electrical Engineering Department
Department of Computer Engineering
College of Engineering
Rochester Institute of Technology
Rochester, New York
RELEASE PERMISSION FORM
Rochester Institute of Technology
Design and Implementation of a DSP Based
MPEG-l Audio Encoder
I,
Eric Hoekstra, hereby grant permission to any individual or organization to reproduce
this thesis in whole or in part for non-commercial and non-profit purposes only.
Eric
J
Hoekstra
(b
199:5
ABSTRACT
The speed ofcurrentPCs enablesthem to decode andplay an MPEG bitstream in real
time. The encodingprocess,
however,
cannotbe done in real-time. Thepurpose ofthisthesisisto producealow-costreal-time Digital Signal Processor
(DSP)
implementationof an MPEGencoder. The DSP will provide an MPEG bitstreamto thePC that can be
savedtodisk.
The input to the DSP will be an analog audio signal. A codec provides the DSP with
16-bitsamples ofthe signal. The DSP compressesthese 16-bit samples using MPEG-1
layer 1 compression. Then it formats the compressed data to the correct MPEG-1
bitstream,
andtransmits itto thePC overits byte-wide host interface. Onthe PC side, aprogram receives the data from the DSP and saves the MPEG data to the disk. An
Table
ofContents
Listof
Figures
iiiListofTables iv
Listof
Equations
vGlossary
vi1 AUDIO COMPRESSION METHODS 1
1.1. PCM 1
1.2. Time domaincompression 2
1.2.1. fi-law
Encoding
27.2.2. DPCMandADPCM 3
1.3. Transform
Coding
41.4. Subband
Coding
52. QUANTIZATION 7
3. PSYCHOACOUSTICS 8
3.1. Absolute threshold 9
3.2.
Masking
104. MPEG COMPRESSION 14
4.1. Overview 14
4.2. MPEG Frame Format 15
4.2.1. MPEGHeader 16
4.2.2. Layer 1 Audio Data 19
4.3. Subband
Processing
214.4. PsychoacousticModel 24
4.4.1. FFT Analysis 24
4. 4.2. Determination ofthesound pressurelevel 25
4. 4. 3.
Considering
the thresholdin quiet 264, 4.4,
Finding
tonalandnon-tonalcomponents 264.4.4.1. Tonal 26
4.4.4.2. Non-Tonal 27
4.4.5. Decimation oftonalandnon-tonalmaskingcomponents 28
4.4. 6. Calculationof the individual maskingthresholds 2S
4.4. 7. Calculation oftheglobalmaskingthreshold 32
4.4.8. Determination of theminimummaskingthreshold 32
4.5. Bit Allocation 33
4.6. Frame
Packing
355. PC SOFTWARE
IMPLEMENTATION
375.1.
Graphics
375.2. Bit File 38
5.3. MPEG I/O 40
5.4. DSP
Considerations
415.4.1. 24 Bit
Mode,
Scaling
andFFT. 415.4.2. Logarithms 43
6. DSP
SOFTWARE IMPLEMENTATION
456.1. DSP Selection 45
6.2. Codec Interface 48
6.3. Pipeline 50
6.4. Foreground
Processing
526.5. Simulation 53
6.6. Port B
Testing
556.7. BitAllocation 56
7. DSP- PC INTERFACE 59
7.1. Protocol 59
7.2. Hardware Needed 61
7.3. PC Implementation 62
7.4. DSP Implementation 63
7.5. Transfer Rates 65
8. CONCLUSION 66
8.1. Difficulties Encountered 69
8.2. Recommendations forFutureWork 70
9. REFERENCES 71
List
ofFigures
Figure 1:DPCMSignal 3
Figure 2: AbsoluteThreshold 10
Figure 3: IllustrationofFrequencymasking ll
Figure4: Criticalband rate vs. Frequency 13
Figure 5: MPEG Encoder Block Diagram 14
Figure 6:MPEGaudio frame format 16
FIGURE7:MPEGLAYER1 FRAME FORMAT 20
Figure8: MPEGlayer1 Subband Sample Format 20
Figure 9: CalculationofSubband Samples 22
Figure 10: Plotof the
C[i]
vector 23Figure11: Frequency ResponseofSubband Filters 23
Figure 12: IndividualMasking Threshold: X(z(j))+vf 31
Figure 13: 24-bitfixed point representation 46
Figure 14: SSIdata frame 49
Figure 15: Frame Processing 51
Figure 16:PortBtesting 56
Figure 17:Full Handshake ReadOperation 60
Figure18:Double EdgeAcknowledge 60
Figure19: State MachineforDSPTransmitter 64
List
ofTables
Table1:MPEGheader 17
Table2: TotalBit-rateofMPEGframe 18
Table 3: Channel Mode 18
Table4: Layer 1 and2 Mode Extensions 19
Table 5: Layer 3 ModeExtensions 19
Table6: Layer 1 Bit Allocations 20
Table 7: MPEG Layer 1,2 scalefactors 21
Table 8: X(k)
-X(k+j)
>=7dB 27Table 9: Frequenciescorresponding to indexi 29
Table 10: LayerI SignaltoNoise Ratios 34
TABLEll:DSP56302vs. DSP56302 46
Table 12: State TableforPC Receiver 63
Table 13:State TableforDSP Transmitter 64
Table14:Slot 2 Idletimes as afunctionofbit-rate 69
List
ofEquations
Equation 1:Criticalband rate as a function offrequency 13
Equation 2: Criticalbandwidthasafunctionof frequency 13
Equation 3: Scalefactor as a function of index 21
Equation4: Expressionform matrix 22
Equation 5: Hann Window 24
Equation 6: Calculationof the log-power density spectrum 25
Equation 7: DeterminationofSound Pressure Level 26
Equation 8: CalculationofTonal SPL 27
Equation9: Individual Masking Threshold 30
Equation 10: MaskingIndex 30
Equation 11: Masking Function 31
Equation 12:Global Masking Threshold 32
Equation13: BitsperLayerI Frame 34
Equation 14: Convertingfrom powerdomainto logdomain 44
Equation 15: Modifiedlog domain calculations 44
ASIC Bark Codec DCT
dz
FIR FFTIntensity
Stereo ISR kbps LSB PsychoacousticMasking
Masking
function MIPS MNR MPEG MSB MS Stereo Non-Tonal PC PCM Quantization SMR SNR SPL Slot TonalGlossary
Applications Specific
Integrated CircuitUnitof
frequency
measurebasedon criticalbandwidth 12Coder/decoder
-provides 16bitsamples ofanalog signal
Discrete Cosine Transform 5
Difference betweentwo
frequencies
in barks. 12Finite Impulse Response
-filter basedontheweighted sum of 22
inputvalues.
Fast Fourier Transform
-time to
frequency
transform 4Subbandsthatareless than thebound are codedin stereo,while 18
thesum ofthe two channels iscoded forthehighersubbands.
Interrupt Service Routine
-code executedto serviceaninterrupt 47
Kilo bitspersecond
Least Significant Byte- lower 8 bits of a 16 bit value 40
The science ofhowthe ear andbrainperceive sounds. 8
The effect of onetoneor noisetomake atest toneinaudibleor
less loud.
TheSPLofthesurrounding frequenciesthatismasked out
by
themasking
frequency
Million InstructionsPerSecond
MasktoNoise Ratio
Moving
PicturesExpertsGroup
MostSignificant Byte - upper8 bits
of a 16bitvalue
Encoding
ofstereo signals as theirsum anddifferenceNoiselike
frequency
componentsPersonal Computer
Pulse Code Modulation
Continuousrepresented asdiscretevalues.
Signal toMaskRatio
Signal toNoiseRatio
Sound Pressure Level = 10
log
10(power)
Partof abitstream. 4bytesin layer 1. 1 in layers2 and 3 Sinusoidal like
frequency
components1
Audio
Compression
Methods
There are three
forms
ofaudio compression. Time domain compression transmits areduced amount of
information
for each sample. Transform-based compressionperforms a transform on the
data,
compacting the information present in the audiosignal, and transmits the transform information. Subband based compression breaks
the input signal
into
multiple subbandsof reduced frequency.1.1.
PCM
Pulse Code Modulation
(PCM)
represents an uncompressed audio signal. Eachchannel ofthe input signal is regularly sampled and the value ofthe analog signal is
represented
by
a linear 2's complement value. The number ofbits for each sampledeterminesthenumber of quantization steps thatare available.
Typically,
8 or 16 bitsrepresent the data. Ifthe audio signal consists of more than one channel, then the
bitstream is constructed
by
alternating samples from each channel. The dataportionof.WAV files is in PCM format. CD audioisalso stored as PCM. CD audio consists
oftwo channels of 16 bit data sampled at 44.1 kHz. Thisrequires a total bandwidth
1.2.
Time domain
compressionTime domain compression usesthe current sample, and possibleprevious samples to
transmit fewer bits for each sample in the audio stream. The simplest compression
method
discards
the least significant bits of each sample.Transmitting
the mostsignificant 8 bits of a 16 bitaudio stream, easily achieves a compression ratio of2:1.
However,
reducing the number ofquantization levels from 65536 to 256 reduces thequalityofthe signal.
1.2.1. |j-law
Encoding
Most ofthe
time,
the audio signal is close to the zero line, u-law distributes thepossible values according to an eight bit
log
based code so more codes are locatednear the zero line. This decreases the amount of noise present at smaller values, but
increases it for larger values. The codes with higher amplitudes are spaced further
apart. The range of values coded with the eight-bit u-law code need about 14 bits if
represented as PCM. The
following
equation transfers from u-law back to PCM.[1,
p.l]
10*7
255
j-rxln(l+
u|.v|)
forx>0 ln(l+p.)
1 27
j-:xln(l+
ulxl)
forx < 01.2.2. DPCM
andADPCM
The next sample in an audio signal has some correlation to the previous samples.
Differential Pulse
Code Modulation
(DPCM)
and Adaptive DPCM compressionmethods take advantage ofthis. The encoder uses a predictor function to predict a
value for the current sample from the knowledge of the previous samples. This
predicted valueissubtracted fromthe actual value andtheresulting error is coded and
placed in the bitstream. The
decoding
process is the reverse.Using
the samepredictor
function,
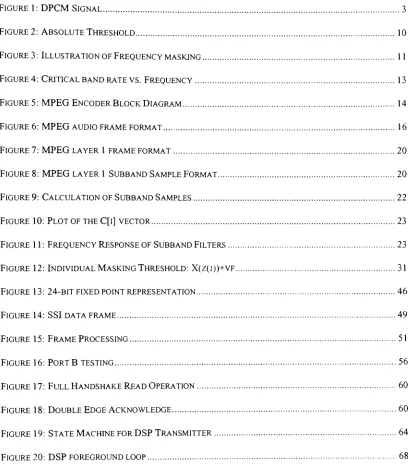
the decoder predicts what the next output sample should be and [image:13.552.102.450.318.587.2]addsintheerrorcodedin thebitstream.
Figure 1: DPCM Signal
The quality of this compression is based on how closely the predictor function
matches the actual audio signal. A more accurate predictor generates smaller errors
fixed,
and much smallerthanthe 8 or 16 bitsneededto representthe same signal withPCM. This
limited
number ofbits leads to a problem when the error cannot berepresented in the allocated bits. The extra error is then carried over into the next
sample's error. This has the effect of
delaying
the data as shown in Figure 1. Thisexample shows a sudden change in the input signal. The steps ofthe DPCM signal
representthemaximumerror valuethatcanbe coded. Sincethechange was
large,
theDPCM signal continues to be saturated at the maximum error for almost six values.
ADPCM adapts thepredictorto bettermatchthe audio signal. Theparameters ofthe
predictor need to be added to the bitstream so that the decoder can use the same
predictor.
1.3. Transform
Coding
Audio data is
highly
correlated. A transform ofthe audio data can be less correlatedthan the audio data. Thetransform places the energyofthesignal in a more compact
area. Thismore concise form ofthe signal information can be transmitted with much
less datarequirements.
One exampleoftransformcoding istheDiscrete Fourier Transform (DFT). An audio
signal that contains only one
frequency
component has energy distributed over theentire sample vector. The information in the DFT ofthis signal concentratesinto one
frequency
component ifthefrequency
component is a harmonic ofthe fundamentalfrequency. The magnitudeandphaseofthis one
frequency
can betransmitted andthedestination can reconstruct the exact waveform. Other transforms besides the DFT
can decorrelate the information present in the audio data. The discrete cosine
transform
(DCT)
is a realdomain transformthat usuallyperforms betterthan theDFTto compactthe
information.
TheJPEG compression standarduses atwo-dimensionalDCTtocompress
images,
whicharetwo-dimensional signals.1.4.
Subband
Coding
According
to theNyquist samplingtheorem,
the largestfrequency
component presentin a sampled signal equals halfthe sampling
frequency
(fs).By
analyzing N digitalN
samples of asignal, there are
frequency
components that are present inthe signalf
from DC to with each component
being
an integer multiple ofthe fundamentalf
frequency
of . If the audio signal is filteredby
a bandpass filter that has af
Npassband width of
-jLj-, then the resulting signal only contains
frequency
2M" "
2M
components. It can be shown that the resulting signal can be downsampled
by
a/
Nfactor of M to produce a signal that has a bandwidth of and contains
2M M
samples. This reduced bandwidth signal is called a subband, because it contains the
information for only a portion ofthe
frequency
spectrum ofthe original signal.[2,
p.18]
and are designed so there is no overlap between subbands. The resulting subband
signalscanbecoded separately. Since eachsubbandhas information from alocalized
portion of the spectrum, bits can be allocated to subbands that represent the more
2.
Quantization
An audio signal is a continuous analog voltage. In order for a digital device to
processthe signal,the analog signal mustbeconverted to adigital signal. An
Analog
toDigital Converter
(ADC)
samples thevoltage at fixedrate and converts thevoltagelevel into a digital code. This process of conversion from analog to digital is called
quantization. Quantization approximates a value to a code that consists ofdiscrete
levels. In the case of PCM the levels are evenly spaced, while u-law encoding
consists of a non-uniform code. For any code, using more quantization levels
improvesthequality oftheapproximation.
Quantization determines the quality of audio compression. Each additional bit used
to code a signal, increases the signal to noise
(SNR)
by
approximately 6 dB.Compression methods thatbreak a signal upinto its components distributethe bits so
that a larger SNR is provided to components that contain the most important
information.
Generally,
using more bits to code audio data increases the SNR and improves thequality of the sound, while using a higher sampling rate increases the
frequency
3.
Psychoacoustics
Psychoacoustics is the science ofhuman sound perception. The ear is an excellent
microphone, capable of
hearing
frequencies
from about 20 Hz up to 20kHz. Thehuman auditorysystemis broken
into
threeparts: theouter,middle andinnerear.The outer ear channels sound to travel down the ear canal to hit the eardrum. The
length ofthe outer ear canal is approximately 2 cm. This length is equal to one
quarter ofthe wavelength of a 4kHz tone. The outer ear canal acts as an open pipe
and resonates at that
frequency
tobest transmit itto the eardrum. This contributestothe sensitivityofhuman
hearing
inthe4kHz range.[3,
p.21]The innerearis filled with asalty fluid. Themiddle ear converts thevibrations ofthe
air into vibrations of the liquid fluid. This can best be described as impedance
matching. The eardrum,
hammer,
anvil and stirrup act as a mechanical lever totransferthe energy fromone fluid
(air)
into another. The efficiency ofthe impedancematching is afunction of
frequency,
andhasabestmatch atfrequencies around 1kHz.[3,p.22]
The inner ear, or cochlea, is shaped like a snail and is filled with fluid. This fluid
transmits the oscillations to the basilar membrane, which runs the length of the
cochlea and supports the organ ofCorti. The organ ofCorti converts the vibrations
consistsof2.5 turns andmakesthe
basilar
membrane approximately 32mm inlength.The thickness ofthe
basilar
membraneincreases
along the length ofthe cochlea.[3,
pp.22-23]
Different
frequencies
cause different places along the basilar membrane to vibrate.Higher
frequencies
cause the thinnerbasilarmembrane locatedby
the opening ofthecochlea to vibrate. Lower
frequencies
cause the thicker basilar membrane locatedtowards the end of the
twisting
cochlea to vibrate. The organ of Corti along thelength ofthebasilar membrane senses onlythe oscillations that cause thatportion of
the basilar membrane to vibrate, and therefore is only sensitive to a small range of
frequencies. The
delay
to detect afrequency
increases along the length of thecochlea. High frequencies aredetected first because
they
are closestto theopening ofthe cochlea. A 1.5kHztonemay have a
delay
around1.5ms,
and the low frequenciesatthe end ofthecochleahave delaysof almost 5ms.
[3,
pp.26-27]
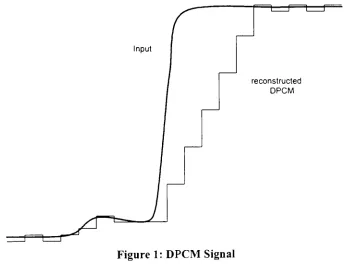
3.1. Absolute threshold
The absolute threshold is the minimum Sound Pressure Level
(SPL)
required for asound, in orderfor a person to hear it. The threshold, shown in Figure
2,
vanes withfrequency. Human speech rangesfrom around 100 Hz upto 7 kHz. The figure shows
the human ear is most sensitive to frequencies between 1kHz and 6 kHz. These
frequencies are in the same range as human speech. Each person has a different
be an average threshold. There are many different ways to obtain this
data,
but thebasic testis to playa test tone at a
frequency
andvary thepower ofthe tone until thelistenercanhearorcannothearthe tone.
70 60 50
1
m .CD -'-. ,330 ,m-S. fit.-
;-thresholdvs.frequency
CD 73 w 10 0 -10
i i i i 1 1 T I 1 1 1
/
1 1 ; :/
/
/
1i ; :
LV" :
1 1 1 1 i i
0 1 2 3 4 5 6 7 8 9 10 11 12 13 14 15 16
frequency (kHz)
Figure2: Absolute Threshold
3.2.
Masking
Masking
is the phenomenon of a tone or noise causing the loudness of a tone todecrease or be inaudible. This is best illustrated
by
an example. Two people aretalking
to each otherby
a street. The listener can clearly hear and understand whatthe speaker is saying. Ifatruck drives
by,
the sound ofthe truck masks out the voiceofthe speaker. The listener may have
difficulty
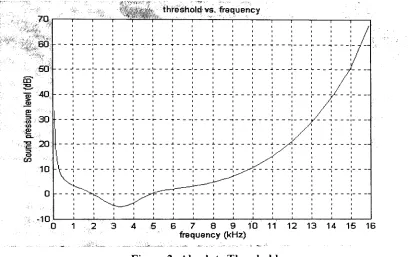
understanding what the speaker is [image:20.552.72.480.167.424.2]There aremany differenttypes of masking. The objectivewhen studying masking is
to seethe effect ofamasking toneor noise on apuretone, or test tone.
Masking
canoccur
by
broadband
noise(white noise),highpassnoise, lowpassnoise, narrow bandnoise, or a puretone. Temporaleffects existthatalso cause masking. Once amasker
isturnedoff, theremay bea short
delay
beforethe tones that were masked are audibleagain. Each type ofmaskerhas a different masking function. The masking function
shows the Sound Pressure Level
(SPL)
that the surrounding frequencies are maskedby. Ifthe SPL of a masked
frequency
is less than the maskingfunction,
then thefrequency
will be inaudible. Ifthe SPL ofthe maskedfrequency
is greater than themasking function then the
frequency
will be partially masked and will be heard at areducedloudness.
masker
[image:21.552.167.397.391.517.2]Frequency
Figure 3: Illustration of
Frequency
maskingMasking
is a function ofthe type andfrequency
ofthe masker and the SPL ofthemasker. For most types ofmaskers, the shape ofthe masking function changes for
different masking frequencies. Figure 3 illustrates the general shape of a masking
properties ofthe
human
auditorysystem. Remember that the length along the basilarmembrane
determines
whatfrequency
the earwillhear.
However,
frequencies do notchange
linearly
along the basilar membrane.Masking
can be visualized as thevibrations caused
by
themaskereffectingthe neighboringfrequencies
that are withina certain distance alongthebasilarmembrane.
Itistheorized thatwhen atone ismasked
by
anoise, thenonlythefrequencies neartothe tone contribute to the masking. This range of frequencies is a function of
frequency
and called the critical bandwidth. Critical bandwidth is approximately100Hz for frequencies less than 500
Hz,
and0.2/
for frequencies greater than 500Hz.Numbering
the edges of adjacent critical bandwidths creates the critical band ratescale. The first complete bandwidth starts at 0 and goes to
100Hz,
and the secondstarts at 100Hz and goes to 200Hz. The unit of Bark is defined as the transition
between two ofthese bandwidths. Shown in Figure 4 is a plot of critical band rate in
Barks
(z)
vs.frequency
(Hz). The critical band rate better suites psychoacousticstudies because it has almost a linear relationship to the length along the basilar
membrane. The shape ofmasking functions represented, as a function ofdz (change
in critical band rates) is independent ofthe masking frequency. Within the auditory
frequency
range, the value of the critical band rate at anyfrequency
can beapproximated
by
Equation 1. The approximate criticalbandwidth atanyfrequency
intherange isgiven
by
Equation 2.[3,
p.147]
criticalbandratrvs.
Iraq
,2, 15 a)
-o a to X>
*<6 10
Figure 4: Criticalband rate vs.
Frequency
Equation 1: Critical bandrate as a function of
frequency
z/Bark =13*arctan
^0.76/^
v kHz j
+3.5*arctan
/
7.5kHz
Equation 2: Critical bandwidth as afunction of
frequency
4.
MPEG
Compression
MPEG is a perceptually-lossless subband-based compression method. Since
information is lost in the coding process, the original signal cannot be reconstructed
from the compressed data. MPEG removes
information
from the audio signal that alistenerwouldnotbeabletohear intheoriginal signal.
4.1.
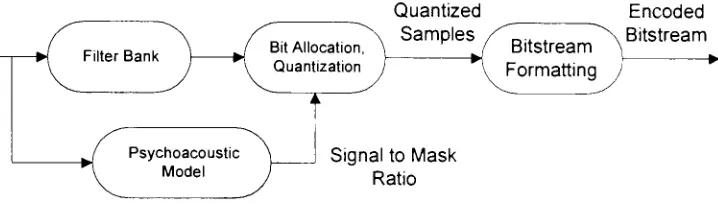
Overview
Quantized Encoded
. .
"N.
Samples /^TT'
~\
Bitstream .....
D . Bi Aiocation, \ / Bitstream
Filter Bank m '
*. I *.
Quantization
j
^\Formatting
J
/ Psychoacoustic
~^> Model
Signalto Mask
[image:24.552.93.452.325.429.2]Ratio
Figure 5: MPEG EncoderBlock Diagram
The encoder block diagram for the MPEG ISO/IEC 11172-3 standard is shown in
Figure 5. The filter bank divides the input signal into 32 subbands. The
psychoacoustic model calculates the Signal to Mask Ratio
(SMR)
for each of thesubbands. The bit allocation and quantization stage uses this SMR todetermine how
each subband should be quantified. The final stage properly formats the information
into an MPEG frame. The standard allows forthree different layers of compression.
Each layer has a different frame format and
increasing
encoder complexity. Theaudio datato be compressed canbe originally sampled at
32kHz,
44.1kHz or 48kHz.Foreach
layer,
thereare 14possiblebit-rates forthecompresseddata.The audio data is broken down into 32 subbands of reduced frequency. These
subbands are equally spaced in layer 1 and 2. In layer
3,
the bandwidths of thesubbands are more closely related to critical bandwidth. MPEG audio compression
uses psychoacousticprinciplesto determinethesignal tomask ratio foreach subband.
This information is used to
dynamically
distribute the available bits among thesubbands.
The number of samples used in a layer 2 or 3 frame is three times that of layer 1.
This provides more information for the psychoacoustic model and better
frequency
resolution. Except for more samples
being
used in the processing, layer 2 does nothave anypsychoacousticimprovements overlayer 1. The codingofbit allocation and
scalefactors datais improved to reduce the amount ofdata. In addition to improved
MPEG compression, Layer 3 also provides Huffman coding on the resulting MPEG
frames.
4.2. MPEG Frame Format
MPEG audio data is a frame-based bitstream. All information presented here
regarding the MPEG frame format is from
[4],
the ISO/TEC 1 1 172-3 standard. For ainformation from 384 samples ofaudiodata for
layer
1 or 1152 samples in layer 2 and3. Figure 6 showsthe general format forall layers ofMPEG audio compression. All
layers ofMPEG audio share the same 32-bit header. The error check is an optional
16bit CRC thatcanbeused todetect errors present inthebitstream. Each layer hasa
different format forthe dataportion ofthe MPEG frame.
Any
bits thatare remaininginthe frameafter
filling
intheheader,
ErrorCheck,
and audio dataisignored,
and canbeused for ancillary data.
Header Error Check AudioData
Ancillary
DataFigure 6: MPEGaudio frame format
4.2.1. MPEG Header
The header contains all the information needed for a MPEG decoder to interpret the
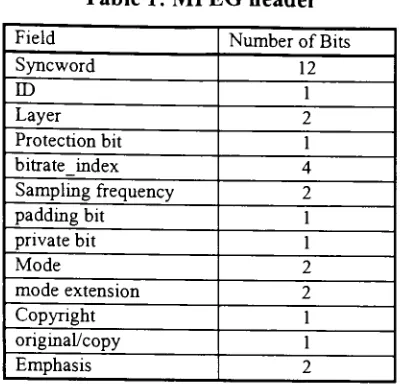
fieldsoftherest ofthe MPEG frame. Table 1 showsthe format ofthe MPEGheader
and the number of bits for each field. The syncword is the bit string '1111 1111
1111'. When the decoder encounters twelve ones in a row in the bitstream it
interprets it as the startof a new frame. Care istaken in thedataportion ofthe frame
sothat thesyncworddoesnot appearaccidentally.
Table 1: MPEG
header
Field NumberofBits
Syncword 12
ID 1
Layer 2
Protectionbit 1
bitrate index 4
Sampling frequency
2padding bit 1
privatebit 1
Mode 2
mode extension 2
Copyright 1
original/copy 1
Emphasis 2
ID is a T to indicate ISO/IEC 11172-3 audio. The ID of '0' is reserved. Layer
indicates what compression layer was used to encode the frame and indicates the
format forthe dataportion ofthe frame.
Tl', TO',
and '01' are used torepresent layer1,2 and 3 respectively. The layer of '00' is reserved. A protection bit set to '0'
indicatesthat theMPEG frame includes a 16 bit CRC. The 4bit bit-rate index is used
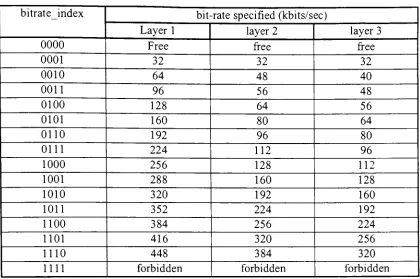
as an index into Table 2 to determine the total bit-rate oftheMPEG frame. The 2 bit
sampling
frequency
indicates the original audio data sample rate.'00',
'01',
and '10'indicate
44.1kHz,
48kHz and 32kHzrespectively. The samplingfrequency
of '11'is
reserved. For a sample rate of
44.1kHz,
it is necessary to pad the audio data so thatthe mean bit-rate is equal to thebit-rate indicated
by
thebitrateindex. The paddingTable 2:
Total
Bit-rateofMPEG framebitrateindex
bit-rate specified(kbits/sec)
Layer 1 layer 2 layer 3
0000 Free free free
0001 32 32 32
0010 64 48 40
0011 96 56 48
0100 128 64 56
0101 160 80 64
0110 192 96 80
0111 224 112 96
1000 256 128 112
1001 288 160 128
1010 320 192 160
1011 352 224 192
1100 384 256 224
1101 416 320 256
1110 448 384 320
mi forbidden forbidden forbidden
Theprivate bit isnot used
by
the standard and can be used for private use. MPEG-1hassupportto encodeupto twochannels of audio. Themode andthemode extension
indicate what number and type of channels are
being
encoded, and how the decodershould interpret those channels. The copyright bit is set if the bitstream is
copyrightedmaterial. Theoriginal/copybit is set ifthebitstream is original.
Table3: Channel Mode
Mode Mode specified
00 Stereo
01 Joint Stereo
(intensity
stereo anoVorMS stereo)10 Dualchannel
11 Single channel
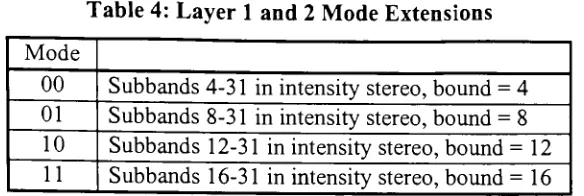
[image:28.552.136.426.538.618.2]Table 4:
Layer
1 and 2 ModeExtensionsMode
00
Subbands
4-31 inintensity
stereo,bound =401
Subbands
8-31 inintensity
stereo,bound=810
Subbands
12-31 inintensity
stereo,bound = 12 [image:29.552.173.376.189.281.2]11
Subbands
16-31 inintensity
stereo,bound= 16Table 5: Layer 3 Mode Extensions
Mode
Intensity
stereo MS Stereo00 off off
01 on off
10 off on
11 on on
4.2.2. Layer 1
Audio Data
Each layer has a different format for the audio data section ofthe frame.
Only
theformat for a layer 1 frame containing single channel data is described here. The
format for the MPEG-1 layer 1 frame can be seen in Figure 7. MPEG audio consists
of 32 subbands. All values are inserted into the bitstream in order from lowest
subband to highest subband. The allocation section specifies how many bits are
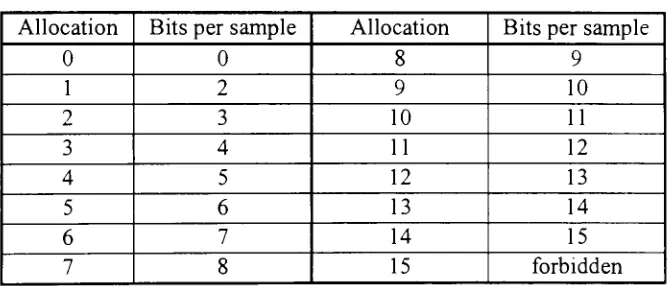
allocated for each subband. The four bit allocation value is used as an index into
Table 6 to obtain the number of bits for each subband. If a subband has a bit
allocationofzero, then no scalefactor or subband sample values for that subband are
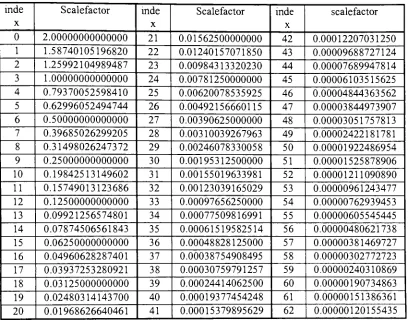
present in the frame. Foreach ofthe transmitted subbands, a six bit scalefactor index
is placed in the bitstream. This index corresponds to the entry
in
Table 7 that all thesubband samples of that subband have been normalized to. The values in the
effectively a one third bit shift to the left ofthe previous scalefactor. The subband
samples are addedto the
bitstream
inthe orderthatthey
were calculated. The first setof subband sample values calculated is output in
increasing
subband order. Thesecond set
follows
the third and so on, until the twelfth set of subband samples isoutput. Figure 8 shows this graphically. In the
figure,
sb0..sb31 represents thesubband samples that were calculated at the same
time,
and have bits allocated tothem.
Header
32bits
Optional
CRC
16bits
Allocation
32x4 bits
Scalefactors
6bits / subband
Subband Samples
12x2-15 bits /subband
Figure 7: MPEG layer1 frame format
sample0 sample 1 sample2 ... sample 10 sample 1 1 sb0..sb31 sb0..sb31 sb0..sb31 sb0..sb31 sb0..sb31
[image:30.552.113.449.469.612.2]Figure8: MPEG layer 1 Subband Sample Format
Table 6: Layer1 BitAllocations
Allocation Bitsper sample Allocation Bitsper sample
0 0 8 9
1 2 9 10
2 3 10 11
3 4 11 12
4 5 12 13
5 6 13 14
6 7 14 15
7 8 15 forbidden
Equation
3:Scalefactor
as afunction ofindex(
[7\mdex scalefactor(index)=2.0* [image:31.552.72.480.153.477.2]\l-V ' J
Table 7:
MPEG
Layer 1,2 scalefactorsinde X Scalefactor inde X Scalefactor mde X scalefactor
0 2.00000000000000 21 0.01562500000000 42 0.00012207031250
1 1.58740105196820 22 0.01240157071850 43 0.00009688727124
2 1.25992104989487 23 0.00984313320230 44 0.00007689947814
3 1.00000000000000 24 0.00781250000000 45 0.00006103515625
4 0.79370052598410 25 0.00620078535925 46 0.00004844363562
5 0.62996052494744 26 0.00492156660115 47 0.00003844973907
6 0.50000000000000 27 0.00390625000000 48 0.00003051757813
7 0.39685026299205 28 0.00310039267963 49 0.00002422181781
8 0.31498026247372 29 0.00246078330058 50 0.00001922486954
9 0.25000000000000 30 0.00195312500000 51 0.00001525878906
10 0.19842513149602 31 0.00155019633981 52 0.00001211090890
11 0.15749013123686 32 0.00123039165029 53 0.00000961243477
12 0.12500000000000 33 0.00097656250000 54 0.00000762939453
13 0.09921256574801 34 0.00077509816991 55 0.00000605545445
14 0.07874506561843 35 0.00061519582514 56 0.00000480621738
15 0.06250000000000 36 0.00048828125000 57 0.00000381469727
16 0.04960628287401 37 0.00038754908495 58 0.00000302772723
17 0.03937253280921 38 0.00030759791257 59 0.00000240310869
18 0.03125000000000 39 0.00024414062500 60 0.00000190734863
19 0.02480314143700 40 0.00019377454248 61 0.00000151386361
20 0.01968626640461 41 0.00015379895629 62 0.00000120155435
4.3.
SubbandProcessing
There are 384 samples in anMPEG layer 1 frame. These 384 samples are critically
filtered to produce 384 subband samples.
Every
32 samples, the most recent 512points are filtered
by
a polyphase filter. The polyphase filter contains 32 equallyspaced non-overlapping bandpass filters. The filter produces one output for each of
points for each subband. This
effectively
runs the 32 bandpassfilters
on the samedata and
downsamples
thefiltered
data to produce critically sampled subbands.Figure 9 shows the method of calculating the subband samples as stated
in
thestandard. It canbe shownthat each output
S[i]
canberepresentedby
a 512 pointFIRfilter.
[5,
p.64]
Thefrequency
responseofthe first four subband filters is shown inFigure 1 1. The
top
plot showsthe completefrequency
spectrum from 0 to pi, andthebottom plot shows a close up in the area where the filters begin to overlap. These
figures were produced
by
matlab scripts to examine thefrequency
response ofthesubbandfilters.
Shift 32 newsamplesinto
FIFO buffer
X[i]
WindowX
by C[i]
vectorZ[i]
=X[i]*C[i]
for i=0..511
Partial Calculations
Y[i]
=j^Z[i
+64j]
for i=0.. 63
CalculateSubband Samples
S[i}= 2ZM[i,k]*Y[k]
k=0
fori=0..31
Figure9: Calculation ofSubband Samples
Equation 4: Expression for M matrix
M[i,k]
= cos(2/
+lXfr-16>
64
fori =0.3l,k =0.. 63
[image:32.552.210.354.333.575.2]50 %.100 350,, 200 . 250.
. 300.. 350
'
[image:33.552.114.441.56.314.2]400 450 500
Figure 10: Plotofthe
C[i]
vectorFrequency
ResponseofFirst 4 Subband Filters.m 0
-100
-300
h
-i r
0 0.1 0.2 0.3 0.4 0.5 0.6 0.7 0.8 0.9 1
0.1 0.15
Frequency (pi)
Figure 11:
Frequency
ResponseofSubband Filters [image:33.552.75.481.316.635.2]4.4.
Psychoacoustic
Model
Thepsychoacousticmodel portionoftheencoder
determines
the SMRfor thefirst 30subbands. The
SMR
providesinformation
about howmuch ofthe signal is notbeing
masked in each subband. A large SMR indicates that the global masking threshold
masked less of the signal than a subband that has a smaller SMR. There are two
psychoacoustic models used to calculatethe SMR. Bothmodels can be used for any
ofthe three layersofcompression, but Model 1 is generallyused for layer 1 and 2 and
Model 2is used for layer3.
Following
arethe stepsto the psychoacoustic model 1 assuggested
by
theISO/TEC 1 1 172-3 standard.4.4.1.
FFT Analysis
MPEG layer 1 uses a 512 point Fast Fourier Transform
(FFT)
to determine thefrequency
spectrum of the current frame. Since there are only 384 samples in aframe,
an additional 128 points need to be used to calculate the FFT. The 384samples of the current frame are centered between the last 64 samples from the
previous frame and the first 64 samples of the next frame. The 512 samples are
windowed
by
the modified Harmwindow shown in Equation 5 beforecalculating theFFT.
Equation 5: HannWindow
(
f %T,^
h(i)
=V8/3*0.5* 1-cos271/
512
The resultfromtheFFT is acomplexvector of size 512. Sincethe inputto the FFT is a real signal, the k*
frequency
component will be equal to the k+N/2frequency
component. The upperhalfofcomponents is discarded and the lower half is squared
to determine the power
frequency
spectrum. This spectrum is converted to thelog
power domain and normalizedto a maximum value of96 dB. Equation 6 shows the calculations performed to determine the log-power domain FFT. Thisfrequency
spectrum is used in the rest ofthepsychoacoustic model stage to calculatethe Signal
toMask Ratio (SMR).
Equation 6: Calculation ofthelog-power
density
spectrumX(k)
=\0*\og\0i
.271
AM ~J nk
N
1 /V-l
YJHn)*x(n)*e
N n=0
N
dB for jfc=0..
7
2
4.4.2. Determination ofthe sound pressure level
The sound pressure level is calculated for each ofthe subbands. The sound pressure
level indicates how much energy is present in each subband. The sound pressure
level is determined
by finding
the maximumfrequency
spectrum in the subband andcomparing it to log-power representation of the scalefactor for that subband. As
showninthe standard, the expressionforthe sound pressurelevelofsubbandncan be
represented
by
Equation 7. The expression scalefactor(n)*
32768 represents the
largest subband sample possible for subband n. The -10 is needed to adjust the
Equation 7:
Determination
ofSound Pressure LevelL!b
=MAX[X(k),20*log10
(scalefactor(n)
*32768)-10]
forX(k)
in subbandn4.4.3.
Considering
thethreshold in
quietThe threshold in quiet is the minimum sound level that can be heard
by
a person.Sounds lower than this threshold are inaudible to the listener and can be removed
from the audio signal. There is an offset of-12dB added to the threshold in quiet
whenthebit rateis greater or equal to 96 kbps. This downwardshift ofthe threshold
in quiet allows for less ofthe masking components to be removed. With the higher
bit rates, more masking components are needed so there more data is available for
building
theframe.4.4.4.
Finding
tonal and non-tonal componentsCompression uses many aspects ofpsychoacoustics. MPEG layer 1 and 2 only use
two types of maskers - tonal
and non-tonal maskers - when
determining
the globalmasking threshold. Each of the two types of maskers has a different shape for the
masking function.
4.4.4.1. Tonal
Tonal
frequency
components are sinusoidal. A local maximum or peak in thefrequency
spectrum indicates atonalfrequency
component. Thefrequency
spectrumconsists of 257 values indexed
by
k from 0 to 256. Afrequency
component in thespectrum that is larger thantheprevious and next
frequency
component is marked aslocal maximum. A
frequency
markedas a local maximum is only marked as a tonalcomponent if its SPL is 7 dB largerthanneighboring
frequency
components within arelative distance (j). The relative distance is determined
by
the k* index of the [image:37.552.126.429.205.289.2]frequency
component andis shownin Table 8.Table 8:
X(k)
-X(k+j)
>= 7 dBRelative distance
(j)
k indexoflocal maximum-2,+2 2<k<63
-3,-2,+2,+3 63<k<127
-6,-5,-4,-3,-2,+2,+3,+4,+5,+6 127<k<250
Once a
frequency
component is marked as tonal, the sound pressure level iscalculated for the
frequency
component.Adding
the power of the two adjacentspectral lines with the tonal component does this. Since the
frequency
spectrum isrepresented in the
log
powerdomain,
the calculation ofthe SPL must be done usingEquation 8. All ofthe
frequency
componentswithin therelative distance are set to apowerofnegative
infinity
decibels. Thisprevents those frequencies frombeing
usedinthenon-tonal calculations.
Equation 8: Calculation ofTonal SPL.
SPL{X(k))
=10*\ogt
f X(k-\) X(k) XQc+l) \ +10 l0 +10 10
v
4.4.4.2. Non-Tonal
One non-tonal
frequency
componentis assignedforeach ofthe criticalbands. ASPL ofthe non-tonal component is the sum of all of the
frequency
components ineach critical
band
not zeroed outby
the tonal calculations or picked as tonalcomponents. The non-tonal component is assigned the k index that most closely
relates tothegeometric mean ofthecriticalband.
4.4.5.
Decimation
oftonal and non-tonalmasking
componentsDecimation is used to reducethe number oftonal and non-tonal components thatwill
be used when calculating the global masking threshold. Tonal and non-tonal
components lower than the threshold in quiet at the components
frequency
areremoved from the masking components list. Tonal components that are close
together will produce similar effects when calculating the global masking threshold.
Tonal components that are within 0.5 bark of each other are compared. The tonal
component withthelower SPLisremoved fromthelist.
4.4.6. Calculation ofthe individual masking thresholds
Not all of the 256
frequency
components are used when calculating the globalmasking threshold. A reduced number of them (108 in layer
1)
are used for thecalculations. This reducedset offrequenciesis shownin Table
9,
and is indexedby
i.For the first six subbands
(3kHz),
all frequencies areused as i indices. For the nextsix subbands, every other
frequency
component is used, and for the remainingsubbands, every fourth
frequency
is used. Tonal and non-tonal masking components [image:39.552.90.461.155.526.2]are assigned anindex i that isclosestto the
frequency
ofthemasking component.Table 9: Frequencies correspondingtoindex i
i
Frequency
iFrequency
iFrequency
i Frequency1 62.5 28 1750.0 55 3875.0 82 8500.0
2 125.0 29 1812.5 56 4000.0 83 8750.0
3 187.5 30 1875.0 57 4125.0 84 9000.0
;
4 250.0 31 1937.5 58 4250.0 85 9250.0
5 312.5 32 2000.0 59 4375.0 86 9500.0
6 375.0 33 2062.5 60 4500.0 87 9750.0
7 437.5 34 2125.0 61 4625.0 88 10000.0
8 500.0 35 2187.5 62 4750.0 89 10250.0
9 562.5 36 2250.0 63 4875.0 90 10500.0
10 625.0 37 2312.5 64 5000.0 91 10750.0
11 687.5 38 2375.0 65 5125.0 92 11000.0
12 750.0 39 2437.5 66 5250.0 93 11250.0
13 812.5 40 2500.0 67 5375.0 94 11500.0
14 875.0 41 2562.5 68 5500.0 95 11750.0
15 937.5 42 2625.0 69 5625.0 96 12000.0
16 1000.0 43 2687.5 70 5750.0 97 12250.0
17 1062.5 44 2750.0 71 5875.0 98 12500.0
18 1125.0 45 2812.5 72 6000.0 99 12750.0
19 1187.5 46 2875.0 73 6250.0 100 13000.0
20 1250.0 47 2937.5 74 6500.0 101 13250.0
21 1312.5 48 3000.0 75 6750.0 102 13500.0
22 1375.0 49 3125.0 76 7000.0 103 13750.0
23 1437.5 50 3250.0 77 7250.0 104 14000.0
24 1500.0 51 3375.0 78 7500.0 105 14250.0
25 1562.5 52 3500.0 79 7750.0 106 14500.0
26 1625.0 53 3625.0 80 8000.0 107 14750.0
27 1687.5 54 3750.0 81 8250.0 108 15000.0
Each of the tonal and non-tonal masking components has an individual masking
function that contributes to the global masking function. The standard gives
equations to approximate the individual masking function of a tonal or non-tonal
masker. The equations are functionsofthe critical band rate, the SPL ofthe masker
maskers have different
masking
properties. In the equations thatfollow,
a subscriptoftm indicates tonal masker, and a subscript ofnm
indicates non-tonal masker. The
index
j
represents thei-index
ofthe masker and anindex
ofirepresents thei-index
ofthe
frequency being
masked. The expression ofz(j) represents the critical band ratefor the
frequency
component with an i-index ofj.Equation
9 shows the equationsthat summarize the calculations for the
individual
masking threshold.X[z(j)]
is theSPL ofthe tonal ornon-tonal masker. Thetermaviscalled themasking index and is
a function ofthe criticalband rate ofthe masker. Equation 10 shows the expression
for the masking index. The masking index for a tonal masker is always a larger
negative number than anon-tonal masker at the same frequency. This shows that a
non-tonal maskerhasmoremasking abilitythanatonalmasker ofthesame SPL does.
Equation 9: Individual
Masking
ThresholdLT^
[z0)4)]=
Xm [z0)]+
av^[z(/)]+
v/[z(/)z(0]
LTnm
[z(j)
z(i)\=Xnm
[z(/)]+
avnm[;(,)]+
vf[z(j)4)]
Equation 10:
Masking
Indexav^ =
-1.525-0.275*z(j)-4.5
m>m=-1.525-0.175*z(/)-0.5
The final term, vf of the individual masking threshold calculation is the masking
function. This masking function is a piecewise linear approximation of the actual
masking function. A masker at the critical band
frequency
of z(j) masks only thesurrounding frequenciesto the left
by
3 barksand to therightby
8 barks. The vfltrmis a function of the SPL of the masker at z(j) and the distance the surrounding
frequencies are from the masker. The equations for vfare shown in Equation 11.
Except forthe av
term,
the calculation oftheindividual
masking function is identicalfortonal andnon-tonal maskers andisnot a functionofthemaskerfrequency. Figure
12 shows the common maskingproperties for amasking tone of
0,25,50,75,
and 100dB. Theeffectsofthe SPLofthemaskeronthe shape ofthemaskingfunction canbe
seeninthefigure.
Equation 11:
Masking
Functionv/ =17*(dz+
l)-(0.4*A'[z(/')]+6)
for-3 <dz < -1vf=
(0.4
*^[z(/')]+6)*dz for-1 <dz<0
vf= -\7*dz forO <dz<\
v/= -(Jz-l)*(l7-0.15*X[z(/)D-17 fori <dz<8
dz =
z(i)-z(j)
Masking
Functionof a masker X(z(j))=u,25;50.75,irj0 dB-5 0 5
Relative bark
frequency
[image:41.552.79.449.231.651.2]10
4.4.7.
Calculation
ofthe globalmasking threshold
The global
masking
thresholdis
only calculated atfrequencies
indexed
by
i in Table9. The global maskingthreshold is the masking level that results from the threshold
in quiet, the tonal maskers, and the non-tonal maskers.
Overlapping
maskingfunctions have an additive effect. This means that ifthere are two maskers present,
theeffective masking level at a
frequency
willbe the sum ofthe two masking levels.To calculate theglobalmasking
threshold,
themasking level is calculated for each ofthe frequencies
indexed
by
i. At each indexi,
the global masking threshold is equalto the sum ofthe threshold in quiet
(LTq(i)),
and the individual masking effects fromall ofthe tonal andnon-tonal maskingcomponents.
Equation 12: Global
Masking
ThresholdZT(0=101og10
10 10 +io 10 +io 10>=1 j=1
4.4.8.
Determination
ofthe minimummasking
thresholdThe global masking threshold is a vector of108 SPL values spread over the first 30
subbands. The minimum masking thresholdis the amount ofmasking that all ofthe
frequency
components contained in a subband are masked by. Somefrequency
components may have more masking, but it is necessary to find the SPL that can be
removed from all of the
frequencies
contained within the subband. The minimummasking threshold of all the frequencies in each subband determines the masking
thresholdofthesubband. The
following
expression summarizes thisprocess.LT^rii)
=MIN[LT(i)]
foralli in subbandn4.4.9.
Calculation
ofthe signal to mask ratioThe calculation of the signal to mask ratio
(SMR)
is the final step of thepsychoacoustic model. The SMR quantifies how much ofthe original signal energy
is left in a subband aftermasking hasoccurred. To calculatethe
SMR,
theminimummasking threshold
(LT^rii))
is subtracted from the sound pressure levelLsb(n)
foreach subband.
SMR(n)
=Lsb(n)-LTmn(n)
4.5.
Bit
AllocationThe size of an MPEG frame is fixed based on the targetbit-rate. The target bit-rate
and the sampling rate (as shown in Equation
13)
determine the total number ofbitsavailablefortheframe. Ofthese
bits,
32bits are reserved fortheheader,
the subbandbit allocations use 32*4=128
bits,
and an optional 16 bits contain the CRC. Thesubband scalefactors and subband samples must be coded within the remaining bits.
The bitallocation process is iterative. Eachtime through the
loop,
thenumber ofbitsfor the subband with the minimum Mask to Noise Ratio
(MNR)
is increased.subband
by
subtracting theSNR
from the SMR. Table 10 shows the SNR for thecorresponding
number of steps used. The subband that has the minimum MNR ischosen. It is checked to see ifthe number of additional bits required exceeds the
numberof availablebits. Ifthe subbandhas zerobits allocated to
it,
changing thebitallocation to 2 bits would require 30 bits: six bits forthe scalefactor index and 24bits
forthe twelve2-bit samples. Ifthe subbandhas a non-zerobit allocation,then adding
one more bit of precision to the subband samples requires an additional 12 bits.
Subbands are no longer picked for minimum MNR when
they
contain 15 bits persample, or the additional bit requirements is larger than the available bits. This
process is repeated until no more subbands can be added, and no more subbands can
be increased
by
onebit.Equation 13: BitsperLayer I Frame
, , ,^u. titrate ^. .
totalbits= 12*
[image:44.552.180.380.459.670.2]sampling_
frequency
Table 10: LayerI Signal toNoise Ratios
NumberofSteps SNR(dB)
0 0.00
3 7.00
7 16.00
15 25.28
31 31.59
63 37.75
127 43.84
255 49.89
511 55.93
1023 61.96
2047 67.98
4095 74.01
8191 80.03
16383 86.05
32767 92.01
[image:44.552.181.379.463.669.2]4.6.
Frame
Packing
Not all ofthe bits ofthe samples are transmitted. This reduction ofbits reduces the
precision ofthe values that canbetransmitted. The subband samples are transmitted
as fractions from -1 inclusive to 1 non-inclusive. The most significant bits of the
sample are transmitted so the receiver can properly restore the sample.
Many
timesthe most significant bits of a number are all zero or one and do not provide the
majority of the information stored in the sample.
By
dividing
the samplesby
anumber slightlylargerthan the maximumsample, the resultingvalues are normalized
and closer to the value of 1 or -1. This has the effect ofmoving more information
aboutthe samples to themore significant bits ofthe number. In orderto reverse this
normalization process, the encoder and the decoder must use the same scalefactors.
The scalefactors used forMPEG-1 Layer 1 and2 are shownin Table7.
All the samples in each subband are normalizedto the smallestentry in the table that
is
larger than the maximum of the twelve samples of the subband. The resultingvalueswill bebetweenthe values of-1 and 1 non-inclusive. To correct small changes
around zero quantizing to different quantization
levels,
the samples go through alinear quantizer. The final step in preparing the subband samples for the bitstream
inverts the most significant bit of every sample. This is done to
help
prevent thesyncwordof'1 111 1111 1111*
Once the subband samples have been normalized and quantized, the frame can be
built and added to the bitstream.
First,
the 32 bits of the header go into to thebitstream. The optional 16 bit
CRC follows.
For each section ofthe MPEGframe,
information is listed in order from lower
frequency
subbands to higherfrequency
subbands.
Next,
thebit allocations areinserted.
Four bits for each subband indicatethe number ofbits used to represent each subband sample. After this point
in
thebitstream only information about subbands that have bits allocated to them are
present. Six bits are used to indicate which scalefactor was used when normalizing
the subband samples. The final portion ofthe MPEG frame is the subbands samples.
Starting
with the lowest subband with allocatedbits,
the first subband sample isinserted into the
bitstream,
followedby
the first subband sample ofthe next subbandwith allocated bits. This is repeated until all ofthe first samples for each subbands
that have bits allocated to them are inserted into the bitstream. This process is
repeatedfortheremaining 1 1 samples forall subbands.
5. PC
Software
Implementation
A PC
MPEG
encoder was written in Cto examinethefacets
ofthe encodingprocessand test the
functionality
ofthe DSP algorithms. The code was written using thestandard
[4]
as aguide.Clarification
on themeaningofsome ofthepoints presentinthe standard came
from
theWorking
Draft ofthe MPEG/Audio Technical Report [6].This contained source code for
implementing
an MPEG-1 layer 1 or 2 encoder anddecoder.
Using
a high levellanguage,
such asC,
allowed for quick changes to theencoderalgorithm. All code was firsttestedfor
functionality
in C beforebeing
portedto DSP assembly. The PC encoderwas compiled as a 16 bit DOS application using
Borland C++version 3.1.
5.1.
Graphics
The information present in an audio signal is best represented in a graphical format.
Graphics routines were written toplot an array of values to the screen. The ability to
visually see the results of the individual encoding steps aided in understanding the
encodingprocess. Thebenefits of visual representation ofthe datawere first realized
whenexamining the figurespresentedin
[7]
as atutorial onMPEG compression. TheBorland BGI graphics libraries were selected for visual output for the encoding
process becauseofthe simplicity ofAPI calls. The maximum resolution of640x480
havethe ability to plot
both integer
arrays anddouble
precision floating-point arrays.Two
identical
plottingfunctions,
ploti and plotd, were written to plot an array ofintegers and
doubles,
respectively. The two plottingfunctions
were not written forspeed, and a considerable speed
improvement
could be gainedby
rewriting them touse double
buffering
methods andby
using a faster graphics library. The functionprototypes for the plotting functions are shown below. The
functions
plot the datapointed to
by
the data parameter in the color definedby
the color parameter. Theparameter numPoints specifies how many data points of the input data are plotted.
The parameteroffset is addedto each element ofdata before plotting. This shifts the
plot up or
down,
adding the ability to perform multiple plots without overlap. Theparameters minval and maxval are used for scaling and represent the bottom and
top
ofthe screen,respectively.
void ploti (int *data, int offset, int minval, int maxval, uint numPoints, int color);
void plotd(double *data, double offset, double minval, double maxval, uint numPoints, int color);
5.2.
Bit File
In order to generate the MPEG
bitstream,
file I/O routines were needed to read andwrite bits to a file. The bitfile code simplified the writing ofthe bitstream. One to
sixteenbits of an unsignedintegercanbewrittento afile. Thebits are written leftto
right and canbe taken fromthe most significantbits orthe least significant bits. The
bitfile code was also not written for performance.
The bitstream
was constructedusing a shift and OR for each bit. In the low
level
I/O,
bytes are transferred to orfrom the disk one at a time. Improvements in the
bitstream
routines would greatlyincrease the speed ofthe program. The
function
prototypes for the Bit File routinesare shownbelow.
BitFile*
OpenFile (char *fname, BF_mode mode); void CloseFile (BitFile *bFile);
uchar WriteBits(BitFile *bFile, uint data, uchar numBits, uchar dir); uint ReadBits (BitFile *bFile, uchar numBits, uchar dir);
uchar BF_EOF(BitFile *bFile);
uint Read_LSB_MSB (BitFile *bFile); void ByteAlign(BitFile *bFile);
char*
PrintBits (uint data, uchar numBits, uchar dir);
The first two
functions,
OpenFile andCloseFile,
provide a way to open and close abitstream file. OpenFile returns a pointer to a newly created BitFile structure and
requires a filenameand the mode ofbitstream file. The BitFile structure containsthe
bufferused to translate fromthe bitstream to the byte based file I/O routines. All of
thebitfile routines usethis structure to access the bitstream file. Abitstream file can
be opened in read or write mode. ReadBits and WriteBits read and write bits in a
bitstream file. The numBits parameter indicates how many bits should be read from
or written to thebitstream. Whenwriting tothe
bitstream,
thedirparameterindicatesthe side ofthe datato be written. A dir set to BF_LEFT writes the most significant
bits of the data to the
bitstream,
while a dir set to BF_RIGHT write the leastsignificantbits. When reading fromthe
bitstream,
dirindicatesthe destinationside ofthe data.
Setting
dir to BF_LEFT is used to read or write fixed point fractionalProcessing
bitstream files
requires four morehelper functions.
BF EOF returns anon-zero value when the end offile has been reached whenreading abitstream. For
Intel based 16 bit audio
formats
such as .PCM and .WAVfiles,
the least significantbyte
(LSB)
of the 16-bit audio sample is listed first in the bitstream.ReadLSBMSB reads 16 bits
from
thebitstream
and places the first 8 bits in theLSB and thesecond 8 bits inthe Most
Significant
Byte (MSB). MPEG audio framescontain an integernumberofbytes and always starton abyte aligned
boundary
inthebitstream. Ifthebitstream is not currently on abyte
boundary,
ByteAlign will flushthe BitFile buffer and correctly align the bitstream to a byte boundary. The final
function, PrintBits,
is used fordisplay
purposes. It constructs a character string thatrepresentsthebitsthatwouldberead or written
by
theBitFileroutines.5.3.
MPEG I/O
The aforementioned bitfile routines provide a means to write a variable number of
bits to a bitstream. The encoder required variable bitfile routines because the MPEG
frame contains fields that are shorterthan eight
bits,
and fieldsthat can change widthevery frame. Data structures to store all the information needed to construct an
MPEG frame were used throughout the MPEG encoder. The MPEG I/O functions
write and read an entireMPEG frame to and from disk. Theencoderproperlyfillsthe
MPEG frame data structure with the required data. Then the write MPEG frame
function
calls the proper bitfile routines to write theMPEG
frame data structure todisk inthecorrect
MPEG
format.5.4.
DSP
Considerations
The hardware
implementation
ofthe encoder utilized a fixed point fractional DSP.The DSP chosen uses 24 bit numbers when performing calculations. Besides
validating the encoder algorithms,thePC versionofthe encoder examinedthe effects
of24 bitfixedpointcalculationsontheencodingprocess.
5.4.1. 24
Bit
Mode,
Scaling
and FFTMany
timesduring
the encodingprocess, a vector mustbe normalized to one. Whenwritingthe PC encoderit is easyto scale the largest value to one
by
searching forthelargest value and
dividing
all elements in the vectorby
that largest value. Theinstruction set ofthe DSP contains instructions to perform fast normalization and
shifting. Normalization on a DSP is done using shifting. The value is shifted left
until one more shift would cause a sign change. This shifting multiplies the number
by
2 until it is greater than one half. For a fractional number between -1 and1,
normalization produces a result greater than 0.5 or less than -0.5. The worst case
produces a value of0.5
instead
of 1.0. When converting the result to thelog
powerdomain,
the amount of error equals -3 dB. Allfrequency
components share the sameoftwo
SPLs,
theerror doesnot appear.The
DSP has instructions toperform adivideiteration,
butadivide
cantakeup to 24timesmoreinstruction
cycles to execute. ThePC program's 24-bit mode, in combination with graphic visualizations, allowed tests
todetermine ifthe
inaccuracy
presentintheDSP normalization algorithm wouldhaveanyeffect ontheencodingprocess.
The PC encoder revealed that scaling performed before the FFT calculations greatly
increased the usability of the FFT results. Low power audio signals contain PCM
samples withvery small magnitudes. Smallermagnitudesonlycontain informationin
the least significant bits and the more significant bits are unused. The FFT process
performsalargenumber of multiplies. Eachmultiplycan easilylose these lower bits
in the rounding and clipping.
Normalizing
the input signal before performing FFTcalculations improves the signal and moves the information in the samples from the
less significant bits to the greater significant bits. Normalization effectively
multiplies allinput samples
by
the same number. Since theFFT isa linear transform,this scales the results ofthe FFT
by
the same factor. The first step after performingthe FFT is to normalize theresults. The effects caused
by
thepre-FFT normalizationdonothavetobereversedbeforeproceeding.
The DSP performs calculations with 24 fixed-point fractional number, while the PC
performs calculations with double
floating
point values. This enables the PC toproduce results that contain more precision than the DSP. One purpose ofthe PC
program was to analyze the results using 24 bit coefficients and the effects of
rounding errors
during
24 bit FFT calculations. ThePC encodersimulated theDSP'sprecision
by
using an optionalmode ofcalculations where allfloating
pointmultiplieswere
immediately
quantized to 24 bits and then converted back tofloating
point.Graphics compared the results from both the
floating-point
and fixed-pointcalculations. The displays and output from the PC program showed that24 bit fixed
point calculationswere sufficient for performingthe encodingprocess.
5.4.2.
Logarithms
One ofthe major drawbacks ofusing a fixed point DSP is that there is the lack of
dynamic range for accurately calculating logarithms. The 24 bits available for
calculations on theDSP has dynamic range of69 dB. In the psychoacoustic portion
ofthe MPEG encoding process, an FFT is performed on the last 512 audio samples.
Psychoac