How commuting affects subjective wellbeing
Ben Clark1 · Kiron Chatterjee1 · Adam Martin2 · Adrian Davis3
© The Author(s) 2019
Abstract
Commuting between home and work is routinely performed by workers and any wellbeing impacts of commuting will consequently affect a large proportion of the population. This paper presents findings from analyses of the impact of commuting (time and mode) on multiple aspects of Subjective Well-Being (SWB), including: satisfaction with life overall and the SWB sub-domains of job satisfaction, satisfaction with leisure time availability and self-reported health. Measures of strain and mental health (GHQ-12) are also examined. Six waves of individual-level panel data from Understanding Society (2009/10 to 2014/15) are analysed, providing a sample of over 26,000 workers living in England. Associations between commuting and SWB are identified, paying particular attention to those arising from individual changes in commuting circumstances over the six waves. It is found that longer commute times are associated with lower job and leisure time satisfaction, increased strain and poorer mental health. The strongest association is found for leisure time satis-faction. Despite these negative associations with the SWB sub-domains, longer commute times were not associated with lower overall life satisfaction (except where individuals per-sisted with them over all six waves). Workers in England appear to be successful in balanc-ing the negative aspects of commutbalanc-ing against the wider benefits, e.g. access to employ-ment, earnings and housing. Differences amongst selected population sub-groups are also examined. The job satisfaction of younger adults and lower income groups are not found to be negatively associated with longer commute times; longer commute times are more strongly negatively associated with the job satisfaction of women compared to men. With respect to mode of transport, walking to work is associated with increased leisure time satisfaction and reduced strain. The absence of the commute, via working from home, is associated with increased job satisfaction and leisure time satisfaction. Overall, the study indicates that shorter commute times and walkable commutes can contribute to improved SWB—particularly through the release of leisure time. But life satisfaction overall will only be maintained if the benefits of undertaking the commute (earnings and satisfactory housing/employment) are not compromised.
Keywords Commuting · Subjective Wellbeing · Mental Health · Panel Data
* Ben Clark
Introduction
There has been increasing attention internationally on how transport policies and practices can contribute to better health (for example, see UNECE (2015) for Europe and CIHT (2016) for UK). The focus has mostly been on reducing the impacts on physical health from traffic injuries and pollution and reversing the decline in physical activity. However, it is also acknowledged that transport systems and different forms of travel behaviour can have effects beyond physical health on people’s mental health and happiness. This has coincided with concern about the limits of GDP as a measure of economic performance and social progress and growing interest globally in measuring people’s wellbeing1 (OECD 2011).
Personal wellbeing can be measured using objective measures (e.g. income) and subjec-tive measures (e.g. happiness)—measurement of the subjecsubjec-tive measures are argued to be particularly important as only the person themselves knows how they are feeling (Layard
2005). Subjective wellbeing (SWB) is defined formally in the 2013 OECD Guidelines on Measuring SWB as “Good mental states, including all of the various evaluations, posi-tive and negaposi-tive, that people make of their lives, and the affecposi-tive reactions of people to their experiences” (OECD 2013). As such, SWB is a broad concept encompassing (1) self-evaluations of satisfaction with different aspects (or domains) of one’s life (e.g. satisfaction with home, family, job, health) and with life overall-referred to as ‘evaluative wellbeing’; (2) the frequency with which one experiences different emotions,-referred to as ‘experien-tial wellbeing’, and (3) whether individuals feel they are fulfilling their poten‘experien-tial-referred to as ‘eudaimonic wellbeing’. The first two of these SWB dimensions are sometimes jointly referred to as ‘hedonic wellbeing’, since they relate to pleasure and satisfaction (e.g. de Vos et al. 2013).
Recent research has sought to identify whether the commute to work has an impact on the SWB of workers. The rationale for this research is that the journey to and from work is routinely repeated-for example, full-time workers in England commute to work on about 160 days of the year (DfT 2016). Any SWB benefits or dis-benefits of commut-ing will potentially affect a large proportion of the population. Indeed, there are multiple ways through which commuting could affect SWB. The journey to work may consume more time and money than individuals would prefer and may also be a stressful experi-ence (Koslowsky et al. 1995). On the other hand, the commute may offer SWB benefits in providing time to relax (Redmond and Mokhtarian 2001) or to undertake physical activity. The impact on SWB of commuting is likely to depend upon its duration, the mode of trans-port used and the conditions experienced during the journey.
This paper presents an analysis of the impact of commuting (time and mode) on multi-ple aspects of SWB, including: satisfaction with life overall and the SWB sub-domains of job satisfaction, satisfaction with leisure time availability and self-reported health. Meas-ures of strain and mental health are also examined. Six waves of individual-level panel data from Understanding Society (2009/10 to 2014/15) (University of Essex 2016) are ana-lysed, providing a sample of over 26,000 workers living in England. The paper expands on the summary of an examination of commuting and wellbeing reported in Chatterjee et al.
(2017). Specifically, the paper provides a detailed explanation and justification of (1) the models used to identify robust associations between commuting and SWB, paying particu-lar attention to those arising from individual changes in commuting circumstances over the six waves, (2) the results of these models and (3) their implications.
In the next section we summarise the existing evidence on how commuting influences different aspects of SWB. Through this, we build the argument that it is valuable to take a multi-dimensional view of SWB within a single research framework. This is the contribu-tion of our empirical analysis, which set out to identify and compare which specific aspects of SWB are affected by commute time and mode. The remainder of the paper is structured as follows: The objectives and research framework are explained under “Study objectives and contribution”, in relation to evidence gaps identified through the literature review. The data set used in the empirical work is then described under “Data”, followed by an explana-tion of the approach to the analysis, under “Analytical approach”. The “Results” are sum-marised next, with implications and opportunities for further research considered in the “Discussion”.
Literature review
There is a growing body of research examining the relationship between travel behav-iour and SWB, reviewed by Ettema et al. (2010), De Vos et al. (2013) and, most recently, Mokhtarian (2018). For example, a recent study by Friman et al. (2017) found that satisfac-tion with daily travel directly influences both experiential wellbeing and life satisfacsatisfac-tion and that greater satisfaction with daily travel is highest for those that walk and cycle and lowest for those that use public transport. This review concentrates, however, on summa-rising the findings from studies that have specifically looked at the relationship between commuting travel and SWB. We begin by reviewing studies of commuting and overall life satisfaction, and then move on to consider evidence of the effects of commuting on (1) sub-domains of life, (2) experiential wellbeing and (3) mental health.
Commuting and satisfaction with life overall
A review of the economic literature on SWB found that higher life satisfaction is associ-ated with being in good physical health, being employed, being married or cohabiting and not being in middle age (Dolan et al. 2008). Income has a positive association with life satisfaction, but with diminishing returns. Women report higher life satisfaction scores than men (ibid). Turning to the effect of commuting on life satisfaction, cross-sectional studies have consistently found a negative relationship between commute time and life satisfac-tion, including studies in Sweden (Olsson et al. 2013), the United States (Choi et al. 2013), Great Britain (ONS 2014) and China (Nie and Sousa-Poza 2018).
theory implies rational individuals will only take on burdensome commutes if compen-sated by better jobs or housing. Hence, they would not have expected the negative associa-tion between longer commute times and life satisfacassocia-tion.2 The authors offered the explana-tion that this ‘commuting paradox’ arises from people underestimating the negative effects of commuting and their ability to adapt to it.
By contrast to Stutzer and Frey (2008), Lorenz (2018) found no association between commute distance and life satisfaction using the same data source and method but data for years 2007–2013. In the UK context, no association was found between commute time and life satisfaction in a fixed effects regression analysis of data from 1996 to 2008 for partici-pants of the British Household Panel Survey (BHPS) (Dickerson et al. 2014).
With respect to commute mode, Stutzer and Frey (2008) found no significant differences in the negative association between commute time and life satisfaction for those using dif-ferent modes. Similarly, the non-significant association between commute time and life sat-isfaction applied to all commute modes for the UK analysis by Dickerson et al. (2014).
Commuting and satisfaction with sub‑domains of life
Some researchers have considered how commuting affects different domains of life, includ-ing satisfaction with family and social networks, housinclud-ing, employment, leisure time avail-ability and health. One reason for exploring sub-domains is that self-reported life satisfac-tion responses are relatively stable over time (which has been attributed to genetics and personality) and only differ substantially after extreme events (e.g. bereavement, unem-ployment) (Lucas 2007). Furthermore, it is plausible that commuting might affect one sub-domain differently from another.
A number of studies have found longer commute times to be associated with reduced
satisfaction with leisure time (Dickerson et al. 2014; Stutzer and Frey 2008). Lorenz’s (2018) assessment of multiple life domains (based on GSOEP data for 2007–2013) found that longer commute distances have a negative association with satisfaction with leisure and family life. But no association was identified between commute distance and job sat-isfaction. This differs with the result of Stutzer and Frey (2008) which showed a negative association between commute time and job satisfaction (using the same panel data, but for years 1985–2003). It could be (1) that there are differing effects of commute time and
distance on job satisfaction and/or (2) that the relationship between commuting and job satisfaction in Germany has changed over time.
Other studies have shown a relationship between commuting and subjective assess-ments of physical health. Künn-Nelen (2016) found (from an analysis of BHPS data for 1991–2008, using fixed effects models) that longer commute times are associated with lower health satisfaction, but not with objective health measures such as the presence of health problems and sickness absences from work.
The studies that have analysed the relationship between commuting time and satisfac-tion with sub-domains of life have not reported differences by commute mode but their main focus has been on the effects of commute time and this might reflect absence of anal-ysis rather than lack of association.
Commuting could be considered a sub-domain of life given it occupies a considerable amount of time in many workers’ lives. Recent research has investigated satisfaction with the commute and the factors that influence this. These generally show that longer commute durations decrease commute satisfaction and that commuters using active modes of trans-port (walking and cycling) retrans-port the highest levels of commute satisfaction and public transport users the lowest levels (e.g. Olsson et al. 2013, St-Louis et al. 2014).
There are few studies that measure SWB in terms of commuting as well as other sub-domains and life overall. One exception is a cross-sectional study of Swedish commut-ers which found satisfaction with the commute contributed to explaining both experien-tial wellbeing and life satisfaction (Olsson et al. 2013). It would be valuable to examine whether this relationship also holds with longitudinal data. However, large-scale, longitu-dinal data sets which capture different aspects of SWB do not capture satisfaction with the commute. Hence our study explores the relationship between different commuting behav-iours and SWB, measured in terms of life overall and other major sub-domains, without directly considering satisfaction with the commute itself.
Commuting and experiential wellbeing
Kahneman et al. (2004) analysed how people rated their mood (positive affect) during vari-ous daily activities. Commuting received the lowest positive affect scores and one of the highest negative affect scores, indicating that mood is worsened during the journey to/from work. Some studies have examined whether there is a relationship between commuting and people’s overall experiential wellbeing (their emotions across all activities). Cross-sec-tional studies have shown longer commute times associated with reduced happiness (Ols-son et al. 2013; Choi et al. 2013; ONS 2014; Nie and Sousa-Poza 2018). However, Lorenz (2018) found no association between commute distance and frequency of feeling angry, worried, happy or sad (based on panel data and fixed effects models for workers in Ger-many). It is unclear whether these contrasting results might be explained by differences in exposure measures used (commute time versus distance) or differences in the data and type of analysis used (cross-sectional data/analysis versus longitudinal data/analysis).
Commuting and mental health
Other studies have examined the effect of commuting on mental health, as measured using the General Health Questionnaire (GHQ-12) scale (which involves 12 questions designed to detect symptoms of psychological distress). Mental health has been defined as a “state of well-being in which an individual realizes his or her own abilities, can cope with the nor-mal stresses of life, can work productively and is able to make a contribution to his or her community” (WHO 2018).3 Mental health is distinct from SWB, since mental health refers to an objective state of the individual. However, there are some overlapping features— mental health is often measured through asking people about themselves, albeit with the aim to identify their level of cognitive-emotional functioning (Manwell et al. 2015).
Roberts et al. (2011) carried out fixed effects modelling analysis of BHPS data (1991–2004) and found that longer duration commutes were associated with worse men-tal health for women, but not men. Martin et al. (2014) analysed the same data set (for
1991–2008) and with fixed effects modelling found walking to work and using the bus to be associated with better mental health than commuting by car. Martin et al. (2014) also separately analysed associations between commute mode and responses for the 12 differ-ent GHQ-12 symptoms and found that car travel was associated with higher likelihood of reporting ‘being constantly under strain’ and ‘being unable to concentrate’ compared to walking or cycling to work, but no significant differences for other symptoms.
Study objectives and contribution
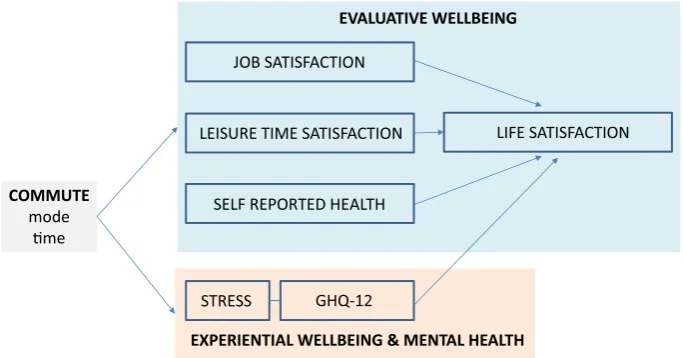
Previous studies have indicated associations between commuting and SWB. However, the results are mixed, with the effect of commuting being found to vary according to the out-come measure used (for SWB), the exposure measure used (for commuting), the country setting and the data sets and type of analysis employed. Hence, it is valuable to examine the effects of different aspects of commuting behaviour on multiple outcome measures in a single analytical framework (see Fig. 1). Accordingly, the empirical study presented in this paper addresses three objectives:
1. To identify how commuting (in terms of time and mode) influences sub-domains of SWB;
2. To identify how commuting (in terms of time and mode) influences overall life satisfac-tion and to what extent this is explained by its effects on sub-domains of SWB; and 3. To identify whether the relationships between commuting and SWB differ for different
groups in the population (considering gender, age and position in the income distribu-tion).
Note that, although our primary focus is on SWB, we have also considered a measure of mental health (GHQ-12) as this provides complementary insights (explained in the next sec-tion). Lorenz (2018) considered the relationship between commuting and multiple outcome
LEISURE TIME SATISFACTION JOB SATISFACTION
SELF REPORTED HEALTH
STRESS GHQ-12
EXPERIENTIAL WELLBEING & MENTAL HEALTH EVALUATIVE WELLBEING
LIFE SATISFACTION
COMMUTE
mode me
[image:6.439.49.391.57.236.2]measures of SWB using panel data, but only considered the influence of commuting dis-tance. Our study focusses on the effects of commuting time and mode, rather than disdis-tance. We suggest that the burden of commuting is most likely to be related to its duration, i.e. commute time, and conditions experienced, i.e. commute mode. We believe the data we use captures the most salient characteristics of commuting likely to influence SWB.
Data
We addressed the objectives through an analysis of a six-wave panel sample of over 26,000 employed people living in England (from 2009/10 to 2014/15), drawn from Understand-ing Society, also known as the UK Household Longitudinal Study (UKHLS) and prior to 2009/10 known as the British Household Panel Survey (BHPS) (University of Essex 2016). Understanding Society captures a wide range of social, economic and attitudinal informa-tion about the lives of members of 40,000 households, through an annual interview. Two measures of (self-reported) commuting are captured for employed participants in every wave: (1) the one-way door-to-door journey time (in minutes) and (2) the mode of trans-port normally used to get to work (Table 1). Although self-reported journey times may not
Table 1 Understanding Society measures of commuting
Variable Question Measure
Commute time About how much time does it usually take for you to get to work each day, door to door (in minutes)?
Integer number of minutes
Commute mode And how do you usually get to your place of work? (mode used for the longest part of the journey)
Categorical variable: drive by car or van, get a lift, motorcycle, taxi, bus, train, metro, cycle, walk, other
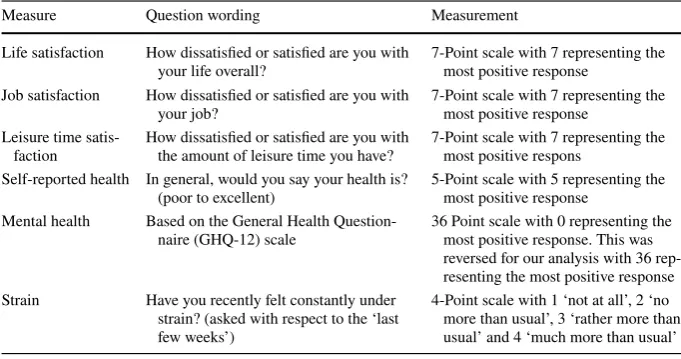
Table 2 Understanding Society measures of SWB
Measure Question wording Measurement
Life satisfaction How dissatisfied or satisfied are you with
your life overall? 7-Point scale with 7 representing the most positive response Job satisfaction How dissatisfied or satisfied are you with
your job? 7-Point scale with 7 representing the most positive response Leisure time
satis-faction How dissatisfied or satisfied are you with the amount of leisure time you have? 7-Point scale with 7 representing the most positive respons Self-reported health In general, would you say your health is?
(poor to excellent) 5-Point scale with 5 representing the most positive response Mental health Based on the General Health
Question-naire (GHQ-12) scale 36 Point scale with 0 representing the most positive response. This was reversed for our analysis with 36 rep-resenting the most positive response Strain Have you recently felt constantly under
strain? (asked with respect to the ‘last few weeks’)
[image:7.439.47.397.68.173.2] [image:7.439.46.387.438.617.2]provide a precise representation of objective journey times (see Witlox 2007), this was not considered to introduce any serious systematic biases.
The analysis sample included Understanding Society participants that were employed, resident in England and that had reported a valid commute time and commute mode (including working from home). The sample was limited to England since the broader analysis (not all of which is reported in the paper) included testing to see whether a num-ber of spatial context variables (e.g. residential settlement type) influenced the relationship between commuting and SWB. These were linked to Understanding Society from external data sets, which were only available for England. Spatial context variables were not found to be statistically significant in most cases. Observations pertaining to commute times of over 180 min were excluded as these were found to be outliers (representing 0.18 percent of all observations) and it was thought unlikely that such long commutes would be under-taken every working day. This analysis sample included 26,551 individuals with a total of 79,793 person-year observations recorded across the six waves.
We analysed six measures of SWB that are captured in Understanding Society every wave (Table 2). These include evaluative and experiential measures of SWB (see Fig. 1) but no eudaimonic measure as this was not available at every wave. We examined an evalu-ative measure of overall life satisfaction, noting that other studies have shown no associa-tion between commute time and life satisfacassocia-tion for workers in England (Dickerson et al.
2014). This may be because the negative impacts of commuting on life satisfaction are compensated by commuting benefits such as improved income, employment or housing. Hence, in addition to examining life satisfaction, we analysed three SWB sub-domains that could plausibly be directly impacted by commuting, whilst not being compensated for by other factors. These sub-domains were satisfaction with the job and leisure time availabil-ity and self-reported health (we assume the latter measure is interpreted by respondents as relating to their physical health).
We also assessed the relationship between commuting and mental health and strain. Mental health is measured in Understanding Society using the General Health Questionnaire (GHQ-12) scale—a composite score based on responses to 12 questions which are designed to identify psychiatric disorders. A number of the GHQ-12 questions record frequency of experiencing negative emotions and hence can also be interpreted as indicators of experien-tial wellbeing. Martin et al. (2014) previously identified an association between commuting and the GHQ12 question about strain and this question was analysed independently.
As noted previously, a number of studies have examined satisfaction with the commute itself (e.g. St-Louis et al. 2014). Commute satisfaction is not measured in Understanding Soci-ety, as is typically the case for multi-topic surveys that obtain diverse wellbeing measures. The focus of this study was, therefore, on the broader impacts of commuting on people’s lives.
Analytical approach
Model specification
The regression model used for the analysis can be expressed as:
The dependent variable is the SWB score (we tested six different measures of SWB) for individual i at time t. Xit is a vector of independent variables (including commuting time
(1)
and mode and control variables) and X̄i is a vector of the means of the independent
vari-ables over the time interval 1,…6. β and γ are coefficients to be estimated by the model. The unknown components are αi which is a time-invariant idiosyncratic (random) effect
(assumed to be Normal distributed with mean 0 and standard deviation σα), uncorrelated
with X̄i or with Xit, and εit which is a random error term that is assumed to be
indepen-dently distributed over i with arbitrary serial correlation.
This specification was suggested by Mundlak (1978) and is referred to as the correlated random effects model. It is a variant of the fixed effects models typically used to analyse panel data (by Stutzer and Frey (2008) and others in the previously reviewed commuting and wellbeing studies) and has some advantages. Fixed effects models provide coefficient esti-mates that only reflect within-individual variation of independent variables. The introduction of the mean values of time-varying independent variables removes cross-sectional variation from the coefficients of the time-varying variables which are then effectively the coefficients that would have been estimated from a fixed effects model. However, additionally, the coef-ficient estimates for the means of time-varying independent variables enable the association between SWB and time invariant variables (such as gender) to be estimated and also repre-sent associations between SWB and between-individual variation in independent variables.4
In interpreting the results, we place greater weight on the coefficients for within-individ-ual variation in independent variables. However, we do not dismiss associations based on between-individual variation in independent variables since we consider this still provides plausible evidence for effects on SWB (given that we control for other independent vari-ables and given that six waves of data provides somewhat limited data on within-individual variation in commuting over time, a point argued by Dolan et al. (2008)).
The SWB indicators used in our analysis are measured on an ordinal scale but in our main models we treat them as cardinal variables and estimate linear, ordinary least squares (OLS) models. Substantive differences have not been found when comparing OLS and ordered mod-els in previous work (Ferrer-i-Carbonell and Frijters 2004). This was checked and confirmed for our data by estimating fixed effect ordered logit models for each dependent variable, using the ‘Blow-up and Cluster’ (BUC) approach proposed by Dickerson et al. (2014).
The independent variables included commute time, commute mode and a set of control variables as set out in Table 3. We also included dummy variables for each wave to allow for the possibility for differences in SWB over time that are common to all individuals (fixed time effects, as included by Roberts et al. 2011 and others). The controls were selected based on previous studies of SWB (Dolan et al. 2008; Stutzer and Frey 2008; Dickerson et al. 2014; Roberts et al. 2011; Martin et al. 2014), an assessment of bivariate correlations in the data set and an incremental process of regression model development. The functional form incorporated a linear relationship between commute time and SWB and a log form relationship between income and SWB, to recognise diminishing SWB returns on income.5
4 Between-individual variation refers to variation across all individuals in the sample pooled across six waves. Note that the sample includes multiple individuals within households and we did not account for this in the error structure to simplify the model specification. However, the Mundlak estimation does adjust for error term correlations for individuals with multiple observations, as per a random effects model.
5 In contrast to Stutzer and Frey (2008) but in common with other studies (Dickerson et al. 2014; Lorenz
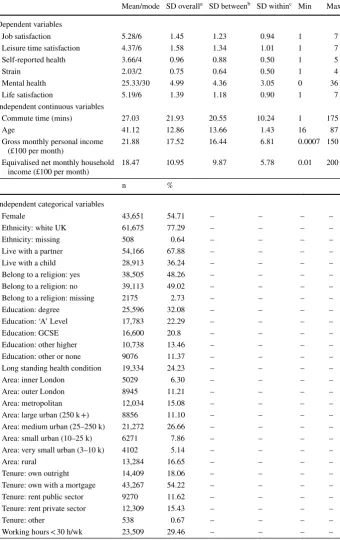
Table 3 Descriptive statistics for dependent and independent variables
Mean/mode SD overalla SD betweenb SD withinc Min Max Dependent variables
Job satisfaction 5.28/6 1.45 1.23 0.94 1 7
Leisure time satisfaction 4.37/6 1.58 1.34 1.01 1 7
Self-reported health 3.66/4 0.96 0.88 0.50 1 5
Strain 2.03/2 0.75 0.64 0.50 1 4
Mental health 25.33/30 4.99 4.36 3.05 0 36
Life satisfaction 5.19/6 1.39 1.18 0.90 1 7
Independent continuous variables
Commute time (mins) 27.03 21.93 20.55 10.24 1 175
Age 41.12 12.86 13.66 1.43 16 87
Gross monthly personal income
(£100 per month) 21.88 17.52 16.44 6.81 0.0007 150
Equivalised net monthly household
income (£100 per month) 18.47 10.95 9.87 5.78 0.01 200
n %
Independent categorical variables
Female 43,651 54.71 – – – –
Ethnicity: white UK 61,675 77.29 – – – –
Ethnicity: missing 508 0.64 – – – –
Live with a partner 54,166 67.88 – – – –
Live with a child 28,913 36.24 – – – –
Belong to a religion: yes 38,505 48.26 – – – –
Belong to a religion: no 39,113 49.02 – – – –
Belong to a religion: missing 2175 2.73 – – – –
Education: degree 25,596 32.08 – – – –
Education: ‘A’ Level 17,783 22.29 – – – –
Education: GCSE 16,600 20.8 – – – –
Education: other higher 10,738 13.46 – – – –
Education: other or none 9076 11.37 – – – –
Long standing health condition 19,334 24.23 – – – –
Area: inner London 5029 6.30 – – – –
Area: outer London 8945 11.21 – – – –
Area: metropolitan 12,034 15.08 – – – –
Area: large urban (250 k +) 8856 11.10 – – – –
Area: medium urban (25–250 k) 21,272 26.66 – – – –
Area: small urban (10–25 k) 6271 7.86 – – – –
Area: very small urban (3–10 k) 4102 5.14 – – – –
Area: rural 13,284 16.65 – – – –
Tenure: own outright 14,409 18.06 – – – –
Tenure: own with a mortgage 43,267 54.22 – – – –
Tenure: rent public sector 9270 11.62 – – – –
Tenure: rent private sector 12,309 15.43 – – – –
Tenure: other 538 0.67 – – – –
[image:10.439.50.391.71.612.2]These functional forms have been adopted in previous studies (Dickerson et al. 2014; Lor-enz 2018) and were also consistent with our own assessment of the nature of the relation-ships. For example, including commute time as a categorical variable in the models showed that SWB decreases approximately linearly with commute time. Some previous studies have included a commute time squared term as well as a commute time linear term (e.g. Stutzer and Frey 2008) but our data did not demonstrate the need for this.
It was observed that significant changes in commute time often correspond with a change in the origin or destination of the commute (see “Descriptive analyses” section). Binary variables were included to control for home and employment location changes, since each of these events (as choices made to improve personal/household circumstances) might be expected to improve SWB. As a robustness check we excluded the binary vari-ables controlling for home and employment location changes. As expected, these varivari-ables were found to confound the commute time-SWB relationship i.e. the commute time coef-ficients were smaller, but remained significant when the move home/employment location controls were removed.
We examined the effects of working from home on SWB compared to commuting, by estimating a model variant in which working from home was included as a dummy ‘commute mode’ category. Commute time was coded as zero for observations where the individual worked from home. Compared to commuters with non-zero but low commute
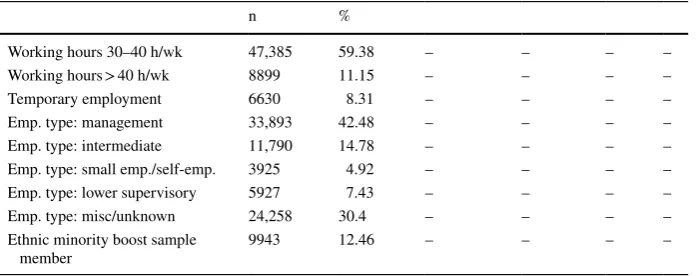
Table 3 (continued)
n %
Working hours 30–40 h/wk 47,385 59.38 – – – –
Working hours > 40 h/wk 8899 11.15 – – – –
Temporary employment 6630 8.31 – – – –
Emp. type: management 33,893 42.48 – – – –
Emp. type: intermediate 11,790 14.78 – – – –
Emp. type: small emp./self-emp. 3925 4.92 – – – –
Emp. type: lower supervisory 5927 7.43 – – – –
Emp. type: misc/unknown 24,258 30.4 – – – –
Ethnic minority boost sample
member 9943 12.46 – – – –
Source: Understanding Society, waves 1–6, pooled sample, n = 79,793 a Standard deviation for full sample pooled across 6 waves
b Standard deviation based on variation between individuals c Standard deviation based on variation within individuals
Due to large numbers of missing values, categories for missing values were explicitly coded for ‘Belong to a religion’ and ‘Ethnicity’ and included as dummy variables in the regression models
GCSE refers to General Certificate of Secondary Education taken at aged 16 ‘A’ Level refers to Advanced Level qualification taken at aged 18
Emp. refers to employment/employer/employed
Ethnic minority boost sample member: ethnic minorities are over-sampled in Understanding Society to enable sub-group analyses of these population groups. We included the ethnic minority boost sample com-ponent in the regression models and controlled for over-sampling of this population group by including a binary flag variable
[image:11.439.48.398.69.207.2]times, the working from home dummy variable represents the additive effects of working from home beyond the effect of a zero commute time. The dummy variable will also pick up unmeasured characteristics of respondents working from home relating to factors such as job type, but this effect is likely to be limited when considering associations based on within-individual variation (where the same person works from home on some occasions and elsewhere on other occasions).
Population sub‑groups
We were also interested in identifying whether relationships between commuting and SWB differ for different sub-groups in the population (such as where Roberts et al. (2011) found that longer commute times had a more negative association with mental health of women than men). Sub-group analysis was conducted by estimating four separate sets of fixed effects models6 for each SWB indicator with interaction terms between commute time and categorical variables for: (1) commute mode, (2) gender, (3) age group, and (4) personal income quintile. This enabled an assessment to be made of whether the commute time— SWB relationship was stronger/weaker for particular sub-groups in the population.
Life satisfaction mediation
It is possible that the relationship between commuting and life satisfaction is mediated through the impact of commuting on SWB sub-domains such as satisfaction with leisure or job (as indicated in Fig. 1). Mediation of the life satisfaction relationship was examined by including selected SWB sub-domains as additional controls in the life satisfaction model. The development of this model variant and its interpretation is explained in further detail in the “Results” section.
Results
We first of all present some descriptive analyses as a basis for discussing the regression models.
Descriptive analyses
The commute mode and time distributions are summarised in Table 4. The majority of people included in the sample drove to work (61%) with walking the second most common means of travelling to work (12%).
The mean (one-way) commute time across the pooled sample was 27 min, but there are large differences between modes. For example, rail commuters travelled for nearly an hour on average, compared to 25 min for drivers.
Changes to commuting behaviour
We examined the prevalence of commute mode changes occurring from one observation to the next and found that a change in commute mode occurred for 18% of observations. Consistent with a previous study (Clark et al. 2016), driving is found to be the most stable commuting mode compared to alternative options. For example, 91 per cent of car drive commutes were still being driven by the following observation, compared to just 12 per cent of walking commutes.
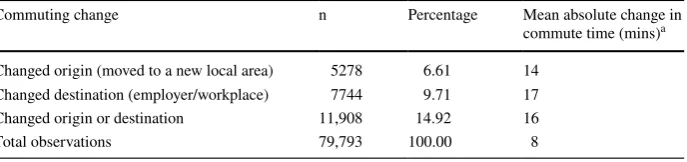
Substantial changes in commute time are most likely to occur for those who change the origin or destination of their journey or change their mode. Increases in delay owing to congestion are only likely to introduce modest changes in commute time from 1 year to the next. Table 5 shows that a change in origin or destination occurred from 1 year to the next for 15% of panel observations. The mean wave to wave change in commute time for those with no change in origin or destination was 6 min, compared to 16 min for those that changed the origin or destination of the commute.
Bivariate associations
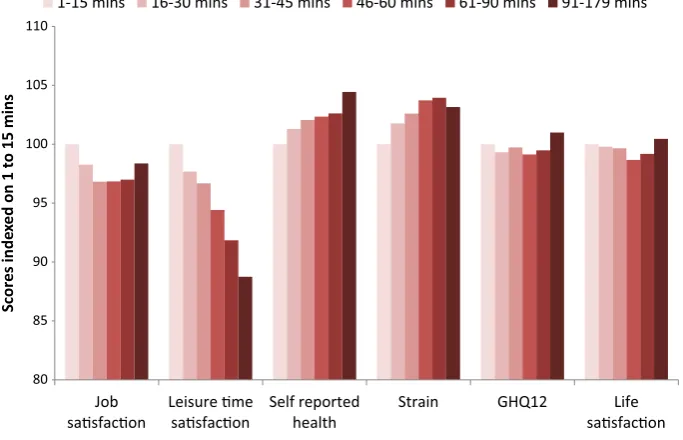
Figure 2 shows the bivariate (between-individual) associations between commute time and each measure of SWB (for the wave 1–6 sample). This indicates that the satisfaction with
Table 4 Commute mode and time, sample distributions
Source: Understanding Society, waves 1–6, pooled sample
Commute mode n Percentage One-way
com-mute time (mins)
Mean SD
Drive by car/van 48,550 60.8 24.7 19.1
Bus 5959 7.5 39.2 21.3
Rail/metro 6937 8.7 58.0 26.1
Cycle 2925 3.7 20.1 13.9
Walk 9869 12.4 14.8 12.2
Other 5553 7.0 21.1 17.2
Full commuting sample 79,793 100.0 27.0 21.9
Work from home 6631 7.7 – –
Full work from home
sample 86,424 100 – –
Table 5 Prevalence of changes to the commute origin or destination
Source: Understanding society, waves 1–6, Pooled sample a Based on absolute wave to wave commute time changes
Commuting change n Percentage Mean absolute change in
commute time (mins)a
Changed origin (moved to a new local area) 5278 6.61 14
Changed destination (employer/workplace) 7744 9.71 17
Changed origin or destination 11,908 14.92 16
[image:13.439.166.394.60.222.2] [image:13.439.50.394.266.347.2]job, leisure time and life scores are lower amongst those with longer commute times. The trend is strongest for leisure time satisfaction and only modest for life satisfaction. Strain is higher amongst those with longer commute times, and this is a contributing factor to slightly lower mental health (GHQ12) for those with longer commutes. The higher job and life satisfaction and mental health for those with commutes of over 90 min only applies to a small group, constituting just 1% of the sample. A limitation in the data is that we do not know how many times in the week such long commutes are performed. Self-reported health is higher for those with longer commute times.
Regression models
The results for the main regression models are summarised in Table 6, with the results for the working from home variant reported separately in Table 7. The additional tests of inter-action performed to identify population sub-group differences are summarised in Table 8. We provide a detailed description of the results for each measure of SWB in this section. The key findings and their implications are then summarised in the “Discussion” section.
Job satisfaction
We found a negative association between job satisfaction and time spent travelling to work (every extra 10 min (each way) reduces job satisfaction by 0.011 points on the 7-point scale—Table 6). This is based on the within-individual commute time coefficient which provides the strongest indication of a causal relationship. The between-individual coeffi-cient is consistent with the within-individual coefficoeffi-cient, providing confidence in the result. The coefficients for control variables (not shown in Table 6) show that job satisfaction
80 85 90 95 100 105 110
Job
sasfacon Leisure mesasfacon Self reportedhealth Strain GHQ12 sasfaconLife
Scores inde
xe
d on 1 to 15 mins
1-15 mins 16-30 mins 31-45 mins 46-60 mins 61-90 mins 91-179 mins
[image:14.439.50.392.61.281.2]Table
6
Main models: cor
related r
andom effects model coefficients f
or commuting v
ar iables Sour ce : U nders tanding Socie ty , w av
es 1–6, P
ooled sam ple Contr ol v ar iables: c hang
ed commute des
tination, c
hang
ed commute or
igin, ag e, g ender , e thnicity , liv e wit h par tner , liv e wit
h a c
hild as par
ent, belong t
o r
eligion, education
lev
el, long s
tanding healt
h condition, se
ttlement type, tenur
e, em
plo
yment hours, tem
por ar y em plo yment, em plo
yment type, log g
ross mont
hl
y personal income, log eq
uiv
-alised ne
t mont
hl
y household income, e
thnic minor ity boos t sam ple member , sur ve y w av e
a Self-r
epor
ted healt
h based on w
av
es 1–5 (as no
t a
vailable in w
av
e 6)
b The R
-sq me
trics ar
e similar t
o t
hose r
epor
ted in o
ther S
WB s
tudies, e.g. Lor
enz ( 2018 ), Mar tin e t al. ( 2014 )
***99%, **95%, *90%
Job satisf
action
Leisur
e time satisf
action Self r epor ted healt h a Str ain GHQ12 Lif e satisf action W ithin-individual v ar iation
Commute time (mins)
− 0.0011*** − 0.0030*** − 0.0004 0.0004** − 0.0028** − 0.0001
Commute mode [R
ef: dr iv e] Bus 0.0249 0.0407 0.0162 − 0.0148 − 0.0035 − 0.0101 R ail/me tro − 0.0032 − 0.0074 − 0.0046 − 0.0157 0.0010 − 0.0632* Cy cle − 0.0239 0.0690 0.0331 − 0.0146 0.0321 0.0636 W alk − 0.0100 0.0792*** 0.0117 − 0.0467*** 0.0487 − 0.0105 Ot her 0.0044 − 0.0002 0.0008 − 0.0162 − 0.0179 − 0.0380 Be tw een-individual v ar iation
Commute time (mins)
− 0.0018*** − 0.0015** 0.0002 0.0005 − 0.0039* − 0.0014**
Commute mode [R
ef: dr iv e] Bus − 0.0196 0.0508 − 0.0785*** − 0.0570** 0.3861** − 0.0006 R ail/me tro 0.0752 0.1318** 0.0457 − 0.0018 0.0484 0.1074** Cy cle 0.0733 0.0503 0.1589*** 0.0229 − 0.0035 0.0288 W alk 0.0980** 0.0256 − 0.0153 0.0394** 0.0316 0.0545 Ot her 0.0714 0.1139** − 0.0553** − 0.0177 0.2454 0.0761* N
o. of obser
vations 79,577 79,577 68,306 79,577 79,577 79,577 N
o. of individuals
26,498 26,498 25,242 26,498 26,498 26,498 R− sq (be tw
een and wit
Table 7 W or king fr
om home models: cor
related r
andom effects model coefficients f
or commuting v
ar iables Sour ce : U nders tanding Socie ty , w av
es 1–6, P
ooled sam ple Contr ol v ar iables: c hang
ed commute des
tination, c
hang
ed commute or
igin, ag e, g ender , e thnicity , liv e wit h par tner , liv e wit
h a c
hild as par
ent, belong t
o r
eligion, education
lev
el, long s
tanding healt
h condition, se
ttlement type, tenur
e, em
plo
yment hours, tem
por ar y em plo yment, em plo
yment type, log g
ross mont
hl
y personal income, log eq
uiv
-alised ne
t mont
hl
y household income, e
thnic minor ity boos t sam ple member , sur ve y w av e
a Self-r
epor
ted healt
h based on w
av
es 1–5 (as no
t a
vailable in w
av
e 6)
b The R
-sq me
trics ar
e similar t
o t
hose r
epor
ted in o
ther S
WB s
tudies, e.g. Lor
enz ( 2018 ), Mar tin e t al. ( 2014 ) ***99%,**95%, *90% Job satisf action Leisur
e time satisf
action Self r epor ted healt h a Str ain GHQ12 Lif e satisf action W ithin-individual v ar iation
Commute time (mins)
− 0.0011*** − 0.0027*** − 0.0003 0.0003 − 0.0021 0.0002
Commute mode [R
ef: dr iv e] Bus 0.0178 0.0368 0.0163 − 0.0063 − 0.0203 − 0.0230 R ail/me tro − 0.0095 0.0011 0.0008 − 0.0050 − 0.0355 − 0.0786** Cy cle − 0.0101 0.0696 0.0426* − 0.0029 0.0153 0.0474 W alk 0.0020 0.0837*** 0.0167 − 0.0403*** 0.0548 − 0.0205 W or k fr om home 0.0847** 0.1004*** − 0.0209 0.0051 − 0.1804 0.0162 Ot her 0.0084 0.0075 0.0000 − 0.0149 − 0.0099 − 0.0438 Be tw een-individual v ar iation
Commute time (mins)
− 0.0020*** − 0.0021*** 0.0001 0.0007** − 0.0051** − 0.0018***
Commute mode [R
ef: dr iv e] Bus − 0.0167 0.0567 − 0.0789*** − 0.0703*** 0.4126*** 0.0172 R ail/me tro 0.0760 0.1317** 0.0416 − 0.0160 0.1160 0.1411*** Cy cle 0.0445 0.0446 0.1462*** 0.0082 0.0161 0.0499 W alk 0.0709* 0.0121 − 0.0253 0.0333* 0.0014 0.0647* W or k fr om home − 0.0020*** − 0.0021*** 0.0001 0.0007** − 0.0051** − 0.0018*** Ot her 0.0522 0.1035** − 0.0570** − 0.0188 0.2202 0.0813* N
o. of obser
vations 86,088 86,088 73,837 86,088 86,088 86,088 N
o. of individuals
27,975 27,975 26,739 27,975 27,975 27,975 R -sq (be tw
een and wit
increases with personal income and with certain job roles (self-employed and manager) and decreases when working long hours (over 40 h per week). We examined the magnitude of effect of commute time by comparing it against the effect of personal income on job sat-isfaction (see Appendix A for details). This suggested that an additional 10 min (each way) of commuting time is associated with the equivalent effect on job satisfaction as a 19% reduction in gross personal income, i.e. a £4080 reduction in gross annual personal income for a worker earning the sample median annual gross income of £21,600.
With respect to differences in the population (Table 8), the job satisfaction of females is more sensitive to longer commute times (although this is not significant at the 95% con-fidence level, p value of the interaction term is 0.12), as is the job satisfaction of workers with higher incomes (noting that job satisfaction increases with income). By contrast, the job satisfaction of young workers aged 16–29 (who tend to have lower job satisfaction than older workers) is not sensitive to commute time.
The commute mode is also shown to moderate the commute time relationship. Job sat-isfaction is higher for short bus journeys (compared to short journeys by other modes) but decreases by more for every additional minute of commute time by bus compared against other modes (Table 8). Beyond the commute time effect, walking to work is associated with higher job satisfaction on average by 0.10 points (on the 7-point scale, see Table 6, between-individual variation) compared to driving (after accounting for journey time dif-ferences and other personal difdif-ferences such as income and occupation type), but for the same individuals we do not see walking to work associated with higher job satisfaction on occasions when they walk to work compared to driving.
Working from home is associated with 0.08 points higher job satisfaction compared to driving (on the 7-point scale-Table 7, within-individual variation).
Leisure time satisfaction
The regression models indicated that lifestyle factors that intensify personal time con-straints are associated with lower leisure time satisfaction. This included longer commute times, as well as working long hours and having children (these all have negative and sta-tistically significant coefficients). Every extra 10 min of commute time (each way) is asso-ciated with a reduction in satisfaction with leisure time availability by 0.030 points (on the 7-point scale-Table 6, within-individual variation). The between-individual coefficient is consistent with the within-individual coefficient, providing confidence in the result.
With respect to differences in the population (Table 8), we find that people in the mid-dle income quintile are less sensitive to longer commute times with respect to their leisure time satisfaction than people with lower and higher incomes (although the confidence level is 90%). The association with commute time is the same for females and males, although it should be noted that females have substantially lower leisure time satisfaction scores than males. There are no differences in commute time associations by age group.
Table
8
Fix
ed effects model coefficients f
or commuting v
ar
iables and inter
action ter
ms
Job satisf
action
Leisur
e time satisf
action Self r epor ted healt h a Str ain GHQ12 Lif e satisf action
(1) Commute mode [R
ef: dr iv e] Bus 0.1099* − 0.0084 − 0.0037 − 0.0406 0.2564 0.0256 R ail/me tro 0.0164 − 0.0049 − 0.0686* 0.0338 0.0583 − 0.0480 Cy cle − 0.0723 0.0598 0.0437 − 0.0404 0.0888 0.1100* W alk − 0.0153 0.0659 − 0.0005 − 0.0536** 0.0417 0.0125 Ot her 0.0345 0.1122** 0.0058 − 0.0169 0.0288 0.0382
Commute time (mins)
− 0.0007 − 0.0030*** − 0.0008** 0.0005 − 0.0015 0.0005 Commute time × Bus − 0.0022* 0.0013 0.0006 0.0007 − 0.0070* − 0.0012 Commute time × R ail/me tro − 0.0005 − 0.0001 0.0013** − 0.0008 − 0.0018 − 0.0007 Commute time × Cy cle 0.0026 0.0006 − 0.0006 0.0014 − 0.0026 − 0.0022 Commute time × W alk 0.0005 0.0010 0.0006 0.0004 0.0011 − 0.0010 Commute time × Ot her − 0.0013 − 0.0049*** − 0.0002 0.0001 − 0.0019 − 0.0034** N
o. of obser
vations 79,577 79,577 68,306 79,577 79,577 79,577 N
o. of individuals
26,498 26,498 25,242 26,498 26,498 26,498 R -sq c 0.0041 0.03 0.096 0.0167 0.0092 0.0097
(2) Gender [R
ef: male]
Commute time (mins)
− 0.0005 − 0.0031*** − 0.0006* 0.0007** − 0.0026 0.0002 Commute tme × Female − 0.0012 0.0001 0.0005 − 0.0005 − 0.0004 − 0.0006 N
o. of obser
vations 79,577 79,577 68,306 79,577 79,577 79,577 N
o. of individuals
26,498 26,498 25,242 26,498 26,498 26,498 R -sq c 0.0039 0.03 0.0968 0.0152 0.0093 0.0096 (3) A ge [R ef: 30–45]
Commute time (mins)
Table 8 (continued) Job satisf action Leisur
e time satisf
action Self r epor ted healt h a Str ain GHQ12 Lif e satisf action Commute time × ag e 45–59 − 0.0007 0.0011 0.0002 0.0004 0.0002 0.0002 Commute time × ag e 60+ − 0.0025 − 0.0013 0.0005 0.0012 − 0.0035 0.0009 N
o. of obser
vations 79,577 79,577 68,306 79,577 79,577 79,577 N
o. of individuals
26,498 26,498 25,242 26,498 26,498 26,498 R -sq c 0.0047 0.0301 0.0966 0.0165 0.0092 0.0096 (4) P
ersonal income [R
ef: q
uint
5]
b
Commute time (mins)
− 0.0018*** − 0.0034*** − 0.0002 0.0003 − 0.0027 0.0000 Inc q uint 1 − 0.2456*** 0.1066** − 0.0083 − 0.0383 − 0.1300 − 0.0677 Inc q uint 2 − 0.2121*** − 0.0142 0.0346 − 0.0464** 0.1083 − 0.0895** Inc q uint 3 − 0.1759*** − 0.0173 0.0203 − 0.0483*** 0.0920 − 0.0605* Inc q uint 4 − 0.0581** 0.0274 0.0165 − 0.0268* 0.0601 − 0.0623** Commute time × inc q uint 1 0.0029** 0.0009 0.0001 0.0000 0.0049 − 0.0006 Commute time × inc q uint 2 0.0013 0.0013 − 0.0004 0.0007 − 0.0059 − 0.0003 Commute time × inc q uint 3 0.0019** 0.0017* − 0.0004 0.0001 0.0008 − 0.0009 Commute time × inc q uint 4 0.0002 − 0.0001 − 0.0003 0.0001 − 0.0002 0.0002 N
o. of obser
vations 79,643 79,643 68,333 79,643 26,514 79,643 N
o. of individuals
26,514 26,514 25,250 26,514 26,514 26,514 R -sq c 0.004 0.0292 0.0954 0.0168 0.0081 0.0092 Sour ce : U nders tanding Socie ty , w av
es 1–6, pooled sam
ple
Inc. r
ef
ers t
o personal mont
hl
y income (g
ross mont hl y) Coefficients com par able t o wit
hin individual coefficients sho
wn in T
able
6
a Self-r
epor
ted healt
h based on w
av
es 1–5 (as no
t a
vailable in w
av
e 6)
b 1 is lo
wes
t income q
uintile and 5 is highes
t income q
uintile
c The R
-sq me
trics ar
e similar t
o t
hose r
epor
ted in o
ther S
WB s
tudies, e.g. Lor
enz ( 2018 ), Mar tin e t al. ( 2014 )
***99%, **95%, *90% Contr
ol v
ar
iables: c
hang
ed commute des
tination, c
hang
ed commute or
igin, ag e, liv e wit h par tner , liv e wit
h a c
hild as par
ent, belong t
o r
eligion, education le
vel, long s
tand
-ing healt
h condition, se
ttlement type, tenur
e, em
plo
yment hours, tem
por ar y em plo yment, em plo
yment type, log g
ross mont
hl
y personal income, log eq
uiv
alised ne
t mont
hl
y
household income, sur
ve
y w
av
Working from home is associated with 0.10 points higher leisure time satisfaction (on the 7-point scale-Table 7, within-individual variation).
Self‑reported health
Longer commute times were not found to be associated with a difference in self-reported health, although Fig. 2 indicates that people that undertake longer commutes report good health. This suggests that those people in good health are more likely to take on a longer duration commute.
We found that cycling to work is associated with higher self-reported health compared to driving (after accounting for differences between individuals, including commute time-Table 6, between-individual variation), but for the same individuals we do not see cycling to work associated with higher self-reported health on occasions when they cycle com-pared to driving. In a similar way, commuting by bus is associated with lower self-reported health compared to driving.
Strain
Longer commute times are associated with increased strain (by 0.004 points on the 4-point scale for every extra 10 min each way-Table 6, within-individual variation) with higher strain also associated with working long hours (over 40 h per week), a management job, a higher personal income, having children and having a longstanding health condition (based on coefficients for control variables which are not shown in Table 6).
With respect to differences in the population (Table 8), females are associated with higher levels of strain than males (by 0.12 points on the 4-point scale, not shown in Table 6), but the positive association of strain with commute time applies more strongly to males (increasing strain by 0.007 points for every extra 10 min (each way)). There are no differences in associations of strain with commute time by age or income quintile.
Walking to work is associated with lower strain compared to driving (by 0.047 points on the 4-point scale-Table 6, within-individual variation) and this is equivalent to the increased strain (of 0.041 points) associated with having a management role. The posi-tive association between strain and walking to work found for between-individual variation contradicts this result and suggests the need to examine the within-individual relationship further in future when more waves of data are available. Commuting by bus is associated with lower strain compared to driving based on between-individual variation (Table 6), but no statistically significant association is found for within-individual variation.
Mental health
earlier time period) indicated that longer commutes were more detrimental to the mental health of women than men.
The commute mode was shown to moderate the commute time relationship. Every addi-tional minute of commute time is associated with a greater decrease in mental health when people use the bus compared to driving. On the other hand, commuting by bus is associ-ated with higher mental health scores compared to driving (Table 6—between-individual variation) for which reasons are unclear.
Life satisfaction
Our models confirmed that living with a partner, being in good health, financial security, and not being in middle age are associated with higher life satisfaction (as has been shown by previous studies). The fixed effects coefficient is not significant for commute time, i.e. for the same individuals we did not find that longer duration commutes are associated with lower life satisfaction (and no differences were identified by population sub-group-Table 8). The between-individual coefficient is negative and statistically significant, indicating that longer duration commutes are associated with lower life satisfaction after accounting for other differences between individuals (by 0.014 points on the 7-point scale for every extra 10 min each way—Table 6).
The finding of a statistically significant between-individual association but not within-individual association merited further investigation. It implies within-individuals with varying commute times over the six observations did not tend to have lower life satisfaction when their commutes were longer. They might have been compensated by better jobs or housing when this was the case. A separate analysis we conducted comparing those who persisted with long commutes (over 45 min) for the six observations with those who persisted with short commutes (45 min or less) showed that the former had consistently lower life satis-faction. This indicates there is a group of commuters who accept unfavourable commutes and are unable or unwilling to change them despite adverse impacts on their life satisfac-tion (for further details see Chatterjee et al. (2017)).
Commuting by rail is associated with higher life satisfaction compared to driving (Table 6) in terms of between-individual variation but the opposite association is shown for within-individual variation. This implies that rail users tend to have higher life satisfaction (for reasons not captured by our control variables) but switching to rail by individuals is not associated with an improvement in life satisfaction.
Working from home is not associated with any difference in life satisfaction (Table 7) in terms of within-individual variation, although the between-individual association indicates working from home is associated with lower life satisfaction, potentially due to characteris-tics of this group that were not captured by our control variables.
There are no notable differences in associations of life satisfaction with commute time by commute mode, gender, age or income quintile.
Life satisfaction mediation analysis
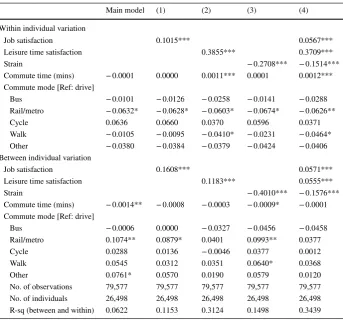
Table 9 shows the results of model variants estimated on life satisfaction, in which the SWB sub-domains that are negatively associated with commute time have been included as additional controls. In models (1)–(3) the three SWB sub-domains are included individu-ally, while all three sub-domains are included together in model (4).7
The results indicate that the relationship between commute time and life satisfaction is mediated through leisure time satisfaction. When leisure time satisfaction is included, the commute time coefficient switches from negative (and non-significant) to positive (and significant), i.e. longer commute times are associated with reduced leisure time satisfaction which in turn is associated with reduced life satisfaction (since leisure time satisfaction is positively correlated with life satisfaction). After accounting for this mediation pathway, the residual effect of longer commute times is found to be positive. This implies that there are unobserved compensatory factors associated with longer commutes—such as improved residential and/or employment situations which are not captured in the control variables we had available.
Discussion
In this section we (1) compare the results across the six dimensions of SWB examined; (2) discuss potential mechanisms to explain the relationships between commuting and dif-ferent aspects of SWB; (3) examine implications for policy and practice; and (4) consider limitations and areas for further research.
Commute time
The strongest relationship we identified is between commute time and leisure time satis-faction and there is a direct mechanism to explain it—the more time an individual spends commuting, the less time is available for other activities. The association is smaller in mag-nitude for those in the middle-income quintile, suggesting they are more willing to sacrifice leisure time to access employment.
The results also indicate that when commute time increases, job satisfaction reduces. The coefficient representing within-individual variation is significant at the 99% confi-dence level, indicating a robust relationship and the magnitude of effect is also quite large, at least when compared against the effect of income on job satisfaction—a 10-min increase in commute time (one-way) is equivalent to a 19% reduction in monthly income in terms of the effect on job satisfaction (on average). This finding implies that the journey to work has a bearing on how workers evaluate their jobs. Hence it is important for employers to recognise that the commute has a direct impact on employee satisfaction. This observation provides added justification for initiatives such as employer-based measures to improve commuting options and incentives for (new) employees to live within easy reach of the workplace. It also suggests potential to integrate employer-based initiatives for mobility management with wider ‘wellbeing at work’ policies.
The job satisfaction of women is more sensitive to longer commute times than men. This is likely to be a consequence of their greater household and family responsibilities, as
suggested by Roberts et al. (2011). It is important for employers to recognise how the com-mute affects staff differently according to their life situation. It is notable that the comcom-mute time association with job satisfaction was not found to apply to young adults and those in the bottom two income quintiles. These groups appear willing to accept longer commutes for their job. For young adults, this could be because it is easier and more acceptable to perform longer commutes at this life stage, which may be seen as beneficial and neces-sary in terms of achieving future career goals. It may also be that expectations concerning commuting change as people get older. In later life, people may expect to achieve a more comfortable daily routine and may also have greater demands on their time such as those associated with looking after family. Alternatively, it could indicate that young adults and lower income workers have less choice over where they live and work.
The results indicate that when commute time increases, strain increases and mental health worsens. These relationships are not as strong as those for leisure time and job sat-isfaction (and we found no association between commute time and self-reported health). Nevertheless, they are based on within individual variation, providing robust evidence of a direct relationship, i.e. that longer commute times introduce greater stress into daily life. It is notable that the association with mental health was found to be stronger for women than men in a previous study covering the period 1991–2004 (Roberts et al. 2011), but this was not found to be the case in our study. It is possible that conditions for coping with long commutes have become more equitable. However, we have seen that job satisfaction of women is more sensitive to longer commutes than men and hence the evidence is inconclu-sive. This is an area that warrants further research.
The coefficient representing within-individual variation in commute time is not signifi-cant for life satisfaction. This is consistent with the findings of Dickerson et al. (2014), who used older panel data for Great Britain, indicating that there is no direct association between commute time and life satisfaction for workers in England. Longer commutes are taken on to accommodate family, housing, career and income preferences. On the other hand, longer commute journeys have been shown to be associated with negative impacts on the sub-domains of SWB described above. The mediation analysis indicated that longer commute times reduce satisfaction with leisure time which in turn reduces life satisfaction. Our overall interpretation for commuters in England is that they are generally successful in trading off the drawbacks of a longer commute journey against the benefits they bring in relation to overall life satisfaction (at least in the short-term as we found evidence that per-sisting with long commutes over the long-term was associated with lower life satisfaction).
Commute mode and working from home
Our results indicate that longer commute times by bus are associated with reductions in job satisfaction and mental health compared to driving and other modes. This indicates that commuting by bus is unsatisfactory for many and implies a policy need to improve the journey experience by bus between residential areas and employment centres in England.
Changes to the commute situation
It is important to recognise that significant changes in the commuting situation (time and/ or mode) are most likely to occur in conjunction with a change in the home or employment location (as highlighted in the “Descriptive analyses” section). It is at these ‘moments of change’ that people have opportunities to reduce the burden of the commute and hence to achieve SWB benefits. Influencing the decisions of individuals is clearly challenging. The degree to which commute time can be reduced may be constrained by a number of factors including lack of (affordable/desirable) housing in closer proximity to work, and the spatial distribution of employment opportunities. This may have a disproportionate effect on lower socio-economic groups who may have less choice over housing and employment locations, be more likely to live in housing areas that are poorly connected to employment and hence
Table 9 Life satisfaction mediation models: correlated random effects model coefficients
Source: Understanding Society, waves 1–6, Pooled sample
Control variables: changed commute destination, changed commute origin, age, gender, ethnicity, live with partner, live with a child as parent, belong to religion, education level, long standing health condition, set-tlement type, tenure, employment hours, temporary employment, employment type, log gross monthly per-sonal income, log equivalised net monthly household income, ethnic minority boost sample member, sur-vey wave
***99%, **95%, *90%
Main model (1) (2) (3) (4)
Within individual variation
Job satisfaction 0.1015*** 0.0567***
Leisure time satisfaction 0.3855*** 0.3709***
Strain − 0.2708*** − 0.1514***
Commute time (mins) − 0.0001 0.0000 0.0011*** 0.0001 0.0012***
Commute mode [Ref: drive]
Bus − 0.0101 − 0.0126 − 0.0258 − 0.0141 − 0.0288
Rail/metro − 0.0632* − 0.0628* − 0.0603* − 0.0674* − 0.0626**
Cycle 0.0636 0.0660 0.0370 0.0596 0.0371
Walk − 0.0105 − 0.0095 − 0.0410* − 0.0231 − 0.0464*
Other − 0.0380 − 0.0384 − 0.0379 − 0.0424 − 0.0406
Between individual variation
Job satisfaction 0.1608*** 0.0571***
Leisure time satisfaction 0.1183*** 0.0555***
Strain − 0.4010*** − 0.1576***
Commute time (mins) − 0.0014** − 0.0008 − 0.0003 − 0.0009* − 0.0001
Commute mode [Ref: drive]
Bus − 0.0006 0.0000 − 0.0327 − 0.0456 − 0.0458
Rail/metro 0.1074** 0.0879* 0.0401 0.0993** 0.0377
Cycle 0.0288 0.0136 − 0.0046 0.0377 0.0012
Walk 0.0545 0.0312 0.0351 0.0640* 0.0368
Other 0.0761* 0.0570 0.0190 0.0579 0.0120
No. of observations 79,577 79,577 79,577 79,577 79,577
No. of individuals 26,498 26,498 26,498 26,498 26,498
[image:24.439.48.392.67.388.2]be more willing to accept arduous commutes (as is indicated by our results). Nevertheless, the findings imply that: (1) it is useful to remind people of the wellbeing benefits of shorter commutes during employment and residential relocations; and (2) that macro-level land use, housing and employment policies should be designed over the longer term to enable people to live within easy reach of employment opportunities.
Limitations and opportunities for further research
This study draws on a large panel data set which supports examination of multiple aspects of commuting on individual-level SWB, including for selected population sub-groups. There are a number of limitations of the study.
Firstly, the study relies on basic measures of commuting. In common with other large-scale social surveys, no information was available on whether (1) people vary the mode used to get to work across the week/month/year; (2) whether people use more than one mode for their journey to work; (3) the extent to which people have any choice over when and how to travel to work; and (4) how many days a week the commute is undertaken. It was only possible to consider a very coarse measure of working from home in our models (whether workers usually work from home or not), and it was not possible to distinguish between those with fixed and flexible working schedules. People with the longest dura-tion commutes may combine commuting with working from home and it is not known to what extent such lifestyle choices impact on SWB. It is also plausible that multi-modal commutes are more stressful than single mode commutes, as a consequence of interchange penalties or increased likelihood of unreliable journeys. Further research is warranted to investigate how variability/flexibility in commuting behaviour influences SWB.
Secondly, the study is based on up to six waves of data per individual and with more waves of data it will be possible to obtain more robust estimates of within-individual coefficients.
Thirdly, the effect sizes (implied by the coefficients) in most cases are small.8 The SWB benefits of commuting alone may not justify investment in the transport system to improve commuting, but there are likely to be many other justifications for such investment. It would be valuable to build up the evidence base by starting to evaluate the impact of trans-port interventions on SWB and other outcomes. Furthermore, whilst a strength of the data-set we have used is that it enabled us to examine multiple aspects of SWB and commuting, we have included a multitude of statistical analyses, with multiple comparisons. Thus sta-tistical significance levels that are close to the standard thresholds used in stasta-tistical tests (e.g. p < 0.05) should be treated with due caution.
Fourthly, it is also necessary to recognise that there is a great deal of heterogeneity in both employment situations and the nature and experience of commuting. For example, shift work in a factory presents a very different employment context compared to work-ing in an office—active commutwork-ing may have particular benefits for those with sedentary desk jobs which do not apply to those with more physical roles. This study was limited to evaluating differences in the relationship between commute time and SWB for four broad population groups (defined by commuting mode, gender, age and income quintile). Hence further research, including the application of qualitative methods, would be valuable to