Environmental Sensor Networks
Kirk Martinez, Member, IEEE, Jane K. Hart, Royan Ong
Abstract— Sensor networks for the natural environment require an understanding of earth science, combined with sensor, communications and computer technology. We discuss the evolution from data logging to sensor networks, describe our research from a glacial environment and highlight future challenges in this field.
Index Terms— (wireless sensor networks, radio communications, environmental monitoring, low power design).
—————————— ——————————
ECENT developments in wireless network technology
and miniaturisation mean that for the first time, the natural environment can be realistically monitored. These systems can potentially provide new data for environ-mental science (e.g. climate models) as well as vital hazard warnings (e.g. flood alerts). This is particularly important in remote or dangerous environments where many fundamen-tal processes have rarely been studied due to their inacces-sibly.
Chong and Kumar [1] suggest that the development of sensor networks requires technologies from three different research areas: sensing, communication and computing. Within the field of environmental sensor networks, an es-sential fourth component is the application of domain knowledge. Before any system is designed and installed, a detailed understanding of its physical environment and deployment is required. The systems must be designed to withstand specific conditions, such as temperature, pres-sure or vibration. The importance of the data collected, as well as their interpretation also needs to be understood. This will dramatically affect the design of the communica-tions and data protection. There are many general surveys on sensor networks [2], so in this article we discuss the spe-cific issues of an environmental sensor network. We show the evolution from environmental logging to a pervasive sensor network, illustrate the effects of domain knowledge on the three elements of sensor networks from a glacial en-vironment and discuss the challenges associated with envi-ronmental sensor networks.
WHAT IS AN ENVIRONMENTAL SENSOR NETWORK
?
Environmental monitoring has a long history, including analogue loggers such as early paper plotters measuring barometric pressure and the recording of specific environ-mental parameters. Loggers record data at specific intervals and require manual downloading by a maintenance team.
A sensor network is designed to transmit the data from an array of sensors to a data repository on a server. They do
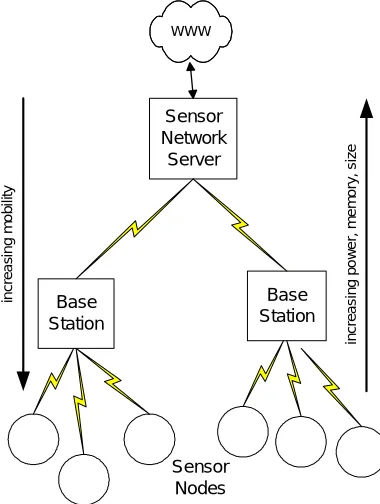
[image:1.612.327.517.295.547.2]not necessarily use a simple one-way data stream over a communications network. Elements of the system will make decisions about what data to pass on, such as local-area summaries and filtering in order to minimise power use while maximising information content.
Fig. 1. Generic sensor network architecture.
Figure 1 shows a simple sensor network. The sensor nodes gather data autonomously and a network is used to pass the data to one or more base stations, which forward the data to a Sensor Network Server (SNS). We envisage a wide range of data from different networks being made available on such servers. A satellite image or map may be required together with some raw data to aid in interpreta-tion or visualisainterpreta-tion. Web publishing through interfaces such as Web Services, give researchers seamless access to information.
Moving from sensor nodes through to the data server the systems generally increase in compute power, data storage and power availability. Sensor nodes may only have power
xxxx-xxxx/0x/$xx.00 © 2004 IEEE ————————————————
• K.Martinez and R.Ong are members of the School of Electronics and Com-puter Science, University of Southampton, SO17 1BJ UK. Phone +44 (0)2380594491, email: [email protected].
• J.K.Hart is a member of the School of Geography, email: [email protected]
Manuscript received (insert date of submission if desired).
R
Sensor Network
Server
Base Station
Base Station
WWW
Sensor Nodes
in
c
rea
si
n
g
m
o
bi
lit
y
in
c
rea
s
ing
po
we
r,
m
e
m
o
ry
, s
iz
to survive a few months or years but even base stations will have a limited life due to their power supply and harsh conditions. The mobility of sensor nodes or base stations may be high and require location systems. If a large number of sensor nodes is possible for one base station then they would typically be organised as an ad-hoc set of clusters with representative nodes communicating a group’s data to the base.
The evolution from logging to a pervasive sensor net-work can be illustrated by the Argus video system for near-shore monitoring [3] which has evolved from passive video recording in 1992 to the active intelligent processing of im-ages. This is a good example of where data reduction is necessary within the sensor network because otherwise video data would overload the communications infrastruc-ture.
Another example is the automated monitoring of soil wa-ter sensors in 1992 [4], which could be seen as a forerunner of the current small-scale habitat modelling sensors. These include systems made by the Center for Embedded Net-work Sensing, which use an array of sensors to measure the population of birds and other species [5], NASA’s Hunting-ton Gardens project [6] and the Berkeley’s habitat model-ling at Great Duck Island [7].
On a much larger scale, the development of Environ-mental Observations and Forecasting System (EOFS) which combine real time in-situ monitoring with distribution net-works that carry data to centralised processing sites. One example of this is the CORIE project which studies the Co-lumbia river estuary [8]. Similarly the FLOODNET project [9] plans to provide a flood warning in the UK and SE-COAS [10] will monitor coastal erosion around small is-lands intended as wind-farms.
The next step must be to monitor in more remote or hos-tile environments. These include projects NASA’s project in Antarctica [11], and further plans to use sensor networks on Mars [12] and Europa [13]. GLACSWEB is a preliminary step in the monitoring of a hostile environment, and many of the problems encountered in developing a system to work in a glacial environment, will be transferable to these remote environments both on earth and elsewhere.
GLACSWEB
Monitoring the behaviour of ice caps and glaciers is an important part of our understanding of the Earth’s climate. Understanding the subglacial environment is an ongoing research area which is addressed in this project [14, 15]. To accurately study this environment the system must autono-mously record glaciers over a reasonable geographic area and over a relatively long time. It also needs to be as non-invasive as possible to allow the sensor nodes (probes) to mimic the movement of stones and sediment (till) under the ice.
The system described here consists of: probes inserted in the glacier, a Base Station on the glacier surface and a Ref-erence Station that relays data to the SNS in Southampton, as shown in figure 2. Nine probes were deployed in 2003; a majority at the ice-till boundary (between 50m to 80m
deep). Each probe is equipped with pressure, temperature and orientation (tilt in three dimensions) sensors. The probes are not recoverable.
Base Station
Ice
Sediment
Reference Station
[image:2.612.316.575.110.183.2]SNS
Fig. 2. GLACSWEB System overview
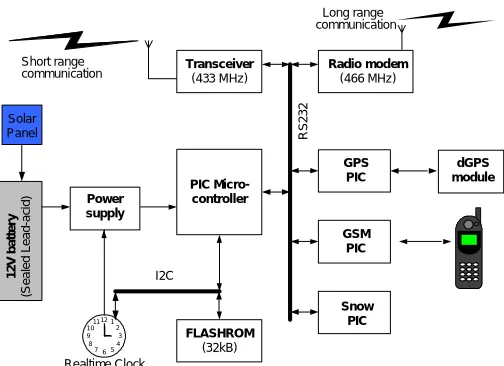
The Base Station (Figure 3) doubles as a communication relay between the Probes and the Reference Station, and as the controller for autonomous operation that orchestrates the entire system. It has a differential GPS (dGPS) to allow ice movement to be followed. It also has temperature and tilt sensors, a snow meter and camera. It is controlled by a PIC and uses PICs to interface to some modules. A real-time-clock is used to wake the system up.
Transceiver
(433 MHz)
PIC Micro-controller
12V
b
a
tt
e
ry
(S
eal
ed
Lead-ac
id
)
I2C
765
12 11 10
8 4
2 1
9 3
Realtime Clock
Power supply
FLASHROM
(32kB)
GPS PIC
GSM PIC Radio modem
(466 MHz) Short range
communication
Long range communication
dGPS module
Snow PIC
RS
2
3
2
[image:2.612.310.562.324.507.2]Solar Panel
Fig. 3. System diagram of the Base Station
The Reference Station is a mains-powered Linux-based gateway for transferring data. It is the position reference point and records a dGPS file daily. This PC relays the data from the probes, base station and dGPS to the data server in Southampton on a daily basis (via ISDN).
In order to survive for one year most of the system is powered-off between readings and controlled by a real-time clock (RTC). The power-budget allows the probes to wake-up every 4 hours to take readings. However the communi-cation channel is only opened once a day during a system-wide window. The daily sequence of events is shown in Table I. At the end of each period, the probe and base sta-tion configure their RTCs to the next “wake-up” time before shutting down.
Time Probe Base Station Ref. Station
0000 Data log
0300 GPS log GPS log
0400 Data log
0800 Data log
1200 Data log
1600 Comms Comms Comms
1900
Transfer to SNS
2000 Data log
Sensor Nodes
Sensor nodes have the following requirements: • Low-cost – so many units can be produced. • Low power – for long-term operation. • Automated – maintenance free
• Robust – withstand errors and failures.
• Non-intrusive – low environmental disturbance. • Low pollution
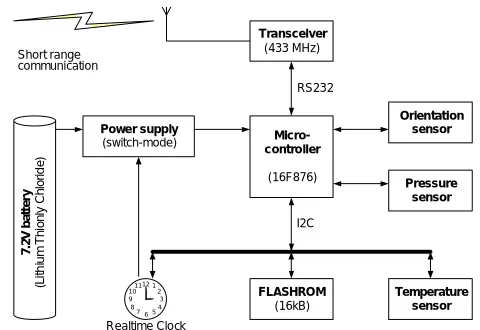
[image:3.612.331.571.57.222.2]The electronics and sensors are enclosed in a sealed plas-tic cylindrical capsule (Figure 4). Each has one 100psi pres-sure sensor, two dual-axis micro-electromechanical system (MEMS) tilt sensors and a temperature sensor. The sensor readings are read and stored (in FlashROM) by the PIC mi-crocontroller. Two PICs were used to enable failsafe control and remote reprogramming. Communication with the base station is via a transceiver with an omnidirectional antenna (Figure 5).
Fig. 4. an open probe (10 cm long) showing its PCB
As communication problems can be expected (especially during the wet summer and deployment period) the data is stored in a 16k ring-buffer so it can tolerate a 6 month isola-tion. The PIC can receive and interpret commands which include reprogramming and time schedule changes.
The power source had to survive in cold conditions (es-timated around 0˚C) so four Lithium Thionyl Chloride AA batteries were used (3.6V, 2 AH). The efficient switch-mode regulator is controlled by the real-time clock and tolerates a voltage drop from the batteries.
I2C
765
12 11 10
8 4
2 1
9 3
Realtime Clock
Power supply
(switch-mode)
Micro-controller
(16F876)
Temperature sensor Pressure
sensor Orientation
sensor
FLASHROM
(16kB)
Transceiver
(433 MHz)
RS232 Short range
communication
7.
2V
b
a
tt
er
y
(L
it
hi
u
m
T
h
io
n
ly
C
h
lo
ri
de
)
Fig. 5. Simplified system diagram of a Probe
Communications
The nature of the environment meant the communications must meet the following requirements:
• High-power omnidirectional for probes • long-range for base to reference • Low data-rate
• Error-detection and correction • Backup channels are needed
Because any part of the communication chain can be faulty we use a store-and-forward mechanism for data transfer. The ring-buffer technique in the probes is also used in the base station so that data flows when communi-cation channels are available. A long-range (2.5km) hop between the base and reference stations is linked with a 500mW 466MHz radio-modem with built-in error-handling (9.6kbit/s suffices). If this fails a backup GSM phone is used by the base to send data directly to the server in Southamp-ton. This actually occurred when one radio modem failed in the reference station.
One consequence of using PIC microcontrollers is that the use of TCP/ip was ruled out. A custom protocol allowed a lower overhead and a greater degree of experimentation. A packet-based protocol with error detection was devised which also allowed a multi-master bus-like network topol-ogy could be employed. An extensive use of store-and-forward, time-outs, checksums and retries allows the sys-tem to tolerate communication errors. Broadcast packets allow system time synchronisation for example.
Computing
A range of different computer systems and software are required to build a sensor network:
• Microcontrollers – for sensor nodes • Small OS – for nodes
• Low-power systems – for base stations • Routing and message-passing
• Server – for the sensor network server
[image:3.612.50.284.59.191.2]difficult to implement complex algorithms.
Base stations need to communicate with many systems using both custom and standard devices. It is beneficial to use a low power board with a low-power suspend mode with a real OS for easy development. Our initial use of PIC rulled out the use of standard WiFi networking for exam-ple, but meant that some hardware could replace software (e.g. RS232 routing). We are currently investigating the use of a low power StrongARM based board running Linux.
A Xeon based Linux server is used as the final destina-tion for the data and all web publicadestina-tion. A key element of our development is to publish web services and data de-scriptions so that future search engines can gather the data.
P
RELIMINARY RESULTS [image:4.612.317.558.162.268.2]The prototype system was installed at Briksdalsbreen, Norway, in August 2003. Holes were drilled with a modi-fied high pressure hot jet-wash after a ground-penetrating radar survey to map out rivers in and under the ice. The base station (Fig. 6) used a tripod sitting on the ice to hold the antennas, in case snow built up during the winter.
Fig. 6. Base station and antenna tripod at Briksdalsbreen.
Temperature and pressure (Figure 7) readings were re-ceived from one Probe (No. 8) for nine days after deploy-ment within the glacier. The temperature was a constant 0.8˚C, the tilt readings were constant throughout this period and are not shown.
8 10 12 14 16 18 20
31 1 2 3 4 5 6 7
Day
Pr
essu
re
(
p
si
)
Fig. 7. Probe 8 Pressure Readings (from July 31, 2003)
Probe 8 was tightly wedged approximately 20m into the glacier. The cessation of data after the 7th
of August is
at-tributed to the loss of communications when the Probe slipped into the water-filled zone at the bottom of the hole. Under such circumstances, communication is impossible until the water freezes in the winter, when we expect each probe to transmit their back-log of data.
Results from the Base Station show battery voltage (Fig-ure 8), tilt and temperat(Fig-ure (Fig(Fig-ure 9).
12.00 12.50 13.00 13.50 14.00 14.50
4 6 8 10 12 14 16 18 20 22 24 26 28 30 1 3 5 7 9 11 13 15 17 19 21 23 25 27 29 1 3 5
day
Vo
lt
[image:4.612.53.225.315.489.2]s
Fig. 8. Base station battery Voltage (from August to October 2003).
The base station battery level fluctuated between 12.5V and roughly 13.5V over the course of 65 days (Figure 8). The overall trend shows that battery charge actually in-creases during the summer due to the 10W solar panel mounted on top of the box.
The Base Station’s tilt sensors indicate reasonably stable on a 15˚ slope and that it moves during warm periods. The temperature on the glacier (Figure 9) is slowly decreasing due to the onset on winter and is within the operating range of the components. The equipment itself remained stable for two sunny/rainy months and is anchored using rocks and a backup anchor to a submerged pole. The dGPS readings indicate that the ice surface melted down around 2m over the summer, which confirmed that drilled poles can not be used as anchors.
-25 -20 -15 -10 -5 0 5 10 15
11 18 25 1 5 8 12 15 19 22 26 29 3 6 10 13 17 20 24 27 31 3 7 10 14 17 21 24 28 31
day (from Sept to Dec 2003)
Tem
p
er
a
tur
e and Ti
lt
Fig. 9. Base Station temperature/˚C (black) and tilt/degrees (white) showing winter cooling and occasional box movements.
These preliminary results show that the system architec-ture is sound. The probe communication links were ham-pered by water in the holes, which tended to sink surface streams. So no data was received for the first few months. It is expected that the holes will close with ice deformation and freezing during the winter.
[image:4.612.318.557.484.624.2] [image:4.612.52.289.587.705.2]system to locate the probes and further miniaturising of their electronics. Inter-probe communications and extra sensors are also planned for the second system to be in-stalled in 2004.
C
HALLENGES FOR ENVIRONMENTAL SENSORNETWORKS
Extracting data gathered by the sensor nodes in remote locations involves some unique challenges. GLACSWEB has tackled many of these issues and led to a greater under-standing of the solutions.
Miniaturisation
Miniaturisation is essential as many systems are de-ployed in confined spaces and may have to be unobtrusive. For low frequency radio the antenna size can be a limita-tion. Dielectric antennas measuring only 5x7x0.5mm were used to save space as well as for their properties. Surface mount components were used together with double-sided boards but some some further integration could be achieved through the use of programmable logic for exam-ple. The miniaturisation of subsystems has to be balanced: the limiting factors are still battery size and radio power requirements.
Power Management
Power management is essential for long-term operation. In common with other projects we used a time schedule in order to manage power and employed high-efficiency regu-lated switch-mode power supplies. We felt it was risky to use an extremely adaptive scheme from the start, due to the unknown communication losses and reliability issues. However a rate of change driven data capture system and inter-probe ad-hoc communications would theoretically reduce power use further. Systems requiring a long boot or resume time have to be avoided as this can become the dominant factor.
Radio Communication
Radio communications success is unpredictable in wet and windy locations. We found that theoretical calculations of radio losses in glacier ice were a poor guide to reality and this will be common in other environments, e.g. leaf cover changes in forest habitats. The ability to alter trans-ceiver power and the use of lower frequency or acoustic fall-back systems will be commonly used in the future. Communications between the sensor nodes is useful where some may be out of the base station’s range. However the energy used to set up ad-hoc networks and clusters has to be minimised.
Scalability
Not only do groups of sensors need to be added regu-larly to environmental systems, but potentially large num-bers need to be managed.
Our initial network topology allowed up to 256 unique devices to be connected to one base station. The use of a
communications window could reduce the scalability be-cause if many probes had to send a back-log of data the time could be insufficient. However in our case they would simply send more data the next day or commands can be sent to probes to keep them awake for longer. Arrays of base stations or gateways will typically be needed in order to increase scalability.
Remote Management
Systems in isolated locations can not be visited regularly so remote access is essential. Bugs need fixes, subsystems might need shutting down and schedules changed. In our case we found that a camera on the base station would be needed in order to monitor the physical status of the site and systems. Power control to completely isolate subsys-tems was found to be essential not only for power man-agement but for workarounds (the Duck Island project found that their sensors could short circuit their power when wet). Custom communications make remote access more complex because normal logins and routing are not available. More software development and failure scenario testing is required in order to achieve good remote man-agement.
Usability
If sensor networks are to be deployed by teams who buy them off the shelf they need to become easier to install, maintain and understand. In the GLACSWEB prototype an earth-scientist could not install the system because of the range of computer and electronics technologies exposed without simple interfaces. This can be compared to install-ing a scanner, printer and network at home. Plug-and-play style developments will help in this area [16].
As more data becomes available a major issue is how re-searchers actually access effectively. The BeanWatcher [17] addresses semi-automatic monitoring and management.
Standardisation
Compatibility between off-the-shelf modules such as dGPS units or weather stations is very low and in practice separate code needs to be written for every module that is integrated. In some cases drivers are available, for a web-cam for example, but without the correct operating system this is unusable. A future challenge will be to standardise the interface and even some radio networking to allow in-teroperability between different sensor network vendors [18].
Standardising the publication of the final data is essen-tial and can be done using semantic web technologies. This would essentially join sensor networks into the semantic web [19], but will be complex unless the community can agree on some common ontologies to describe the domains. The Generic Exchange Models [20] and IRISnet [21] are a move in this direction.
Security
less problematic in remote areas. Some systems can cope with the loss of one or more nodes due to failure or dam-age. Data may need to be protected against deliberate and accidental alteration. However security should not be used to hamper public access to information. A balance between security and information needs to be reached so that all parties can trust the systems, this will dramatically affect their development and implementation.
CONCLUSIONS
Environmental sensor networks provide exciting techni-cal challenge. For the first time, data sets of different types and scales can be merged together to enhance our under-standing of the Earth as a whole. Designing sustainable sensor networks for the natural environment is a demand-ing task. Communications engineerdemand-ing, power manage-ment, deploymanage-ment, weather-proofing, stability and remote diagnostics have all provided interesting problems. The convergence of sensor networks with the semantic web will complete the chain from raw data to useful information available globally.
A
CKNOWLEDGMENTSThe authors thank Intellisys, BTExact and Topcon for their support and Sue Way, Daniel Miles, David Robertson and Al Ridoch for field assistance and Inge and Gro Melkevoll for the use of their café to site the Reference Station.
R
EFERENCES[1] C.Y. Chong and S.P. Kumar, “Sensor networks: Evolution, oppor-tunities, and challenges,” Proceedings of the IEEE, vol. 91, n.8, 2003, pp. 1247-1256.
[2] Akyildiz IF, Su WL, Sankarasubramaniam Y, et al. A survey on sensor networks IEEE COMMUN MAG 40 (8): 102-114 AUG 2002 [3] R. Holman, J. Stanley and T. Ozkan-Haller T, “Applying video
sensor networks to nearshore environment monitoring,” IEEE Pervasive Computing, vol 2, no. 4, 2003, pp. 14-21.
[4] M. E. Grismer, “Field sensor networks and automated monitoring of soil-water sensors,” Soil Science, vol. 154, no. 6, 1992, pp. 482-489.
[5] B. Charny, “Wireless research senses the future ZDNat News [Online]”, http//zdnet.com.com/2100-1105-976377.html, 2002, Dec.
[6] http://sensorwebs.jpl.nasa.gov/resources/huntington_sw31.shtml [7] R. Szewczyk, et al., “Lessons from a Sensor Network Expedition,”
In the 1st European Workshop on Wireless Sensor Networks (EWSN '04), January 2004, Berlin, Germany, pp 307-322. [8] D.C. Steere, et al., “Research Challenges in Environmental
Obser-vations and Forecasting Systems,” Proc. ACM/IEEE Int. Conf. Mo-bile Computing and Networking (MOBICOMM), 2000, pp. 292-299. [9] http://envisense.org/floodnet.htm
[10] http://envisense.org/secoas.htm
[11] K.A. Delin, et al., “Sensor Web in Antarctica: Developing an Intel-ligent, Autonomous Platform for Locating Biological Flourishes in Cryogenic Environments,” 34th Lunar and Planetary Science Confer-ence, 2003.
[12] http://sensorwebs.jpl.nasa.gov/
[13] http://fuego.jpl.nasa.gov/uvvm/baseline.htm
[14] R.B. Alley, “Continuity comes first: recent progress in under-standing subglacial deformation,” In: Maltman, A. J., Hubbard, B., and Hambrey, M. J. (Eds.). Deformation of Glacial Materials, Geological Society Special Publication, Vol. 176, 2000, pp.171-180. [15] J.K. Hart and J. Rose, “Approaches to the study of glacier bed
deformation,” Quaternary International, vol. 86, 2001, pp. 45-58. [16] Y. Gsottberger, et al., “Embedding Low-Cost Wireless Sensors
into Universal Plug and Play Environments,” EWSN, 2004, pp. 291-306.
[17] A. Lins, et al., “BeanWatcher: A tool to generate multimedia monitoring applications for wireless sensor networks,” Manage-ment of Multimedia Networks and Services, Proceedings , Lecture Notes in Computer Science, vol.2839, 2003, pp. 128-141.
[18] F.C. Delicato, et al., “A flexible middleware system for wireless sensor networks,” Middleware 2003, Proceedings Lecture Notes in Computer Science, vol. 2672, 2003, pp.474-492.
[19] http://www.semanticweb.org
[20] D. Seber, Doganet al., “GEON: Cyberinfrastructure for the Geo-sciences” Abstract submitted to American Geophysical Union, Fall Meeting, 2003, San Francisco, CA.
[21] P.B. Gibbons et al., “IrisNet: An architecture for a worldwide sensor web,” IEEE Pervasive Computing, vol. 2, no 4, 2003, pp. 22-33.
Kirk Martinez is a Senior Lecturer in the School of Electronics and Computer Science at the University of Southampton, UK. His research interests include sensor networks, image processing and the semantic web. He has a PhD in Electronics Systems Engineering from the Uni-versity of Essex. He is a member of the IEEE and the IEEE Computer
Society. Contact him on [email protected].
http://www.ecs.soton.ac.uk/~km
Jane Hart is a Reader in the School of Geography at the University of Southampton, UK. Her research interests include glaciology, glacial sedimentology and climate change. She has a PhD in Environmental Science from the University of East Anglia.