David Duffy
Kieran McQuinn
Ciara Morley
Daniel Foley
Winter 201
5
The Economic Research Institute was founded in Dublin in 1960, with the
assistance of a grant from the Ford Foundation of New York. In 1966 the remit
of the Institute was expanded to include social research, resulting in the
Institute being renamed The Economic and Social Research Institute (ESRI). In
2010 the Institute entered into a strategic research alliance with Trinity
College Dublin, while retaining its status as an independent research institute.
The ESRI is governed by an independent Council which acts as the board of the
Institute with responsibility for guaranteeing its independence and integrity.
The Institute’s research strategy is determined by the Council in association
with the Director and staff. The research agenda seeks to contribute to three
overarching and interconnected goals, namely, economic growth, social
progress and environmental sustainability. The Institute’s research is
disseminated through international and national peer reviewed journals and
books, in reports and books published directly by the Institute itself and in the
Institute’s working paper series. Researchers are responsible for the accuracy
of their research. All ESRI books and reports are peer reviewed and these
publications and the ESRI’s working papers can be downloaded from the ESRI
website at
www.esri.ie
The Institute’s research is funded from a variety of sources including: an
annual grant-in-aid from the Irish Government; competitive research grants
(both Irish and international); support for agreed programmes from
government departments / agencies and commissioned research projects
from public sector bodies. Sponsorship of the Institute’s activities by Irish
business and membership subscriptions provide a minor source of additional
income.
Quarterly Economic Commentary
The Quarterly Economic Commentary analyses current economic trends and
provides macro-economic forecasts for the current and following year. It
assesses international economic prospects and provides short-term forecasts
in the framework of a consistent set of national accounts for Ireland. Its wide
range of users includes government departments, policymakers, social
partners, international organisations, academics and the national and
international financial sectors.
Quarterly Economic
Commentary
David Duffy Kieran McQuinn Ciara Morley Daniel Foley
Winter 2015
The forecasts in this Commentary are based on data available by 11 December 2015. Draft completed 11 December 2015.
Special Articles
The Commentary is edited by Kieran McQuinn and David Duffy. Kieran McQuinn is an Associate Research Professor, David Duffy is a Senior Research Officer, and Ciara Morley and Daniel Foley are Research Assistants at the Economic and Social Research Institute (ESRI).
The Quarterly Economic Commentary has been accepted for publication by the Institute, which does not itself take institutional policy positions. It has been peer reviewed by ESRI research colleagues prior to publication. The authors are solely responsible for the content and the views expressed.
Special Articles are published in the QEC in order to foster high-quality debate on various aspects of the Irish economy and Irish economic policy. They are subject to refereeing prior to publication.
Table of Contents
Summary Table ... ii
National Accounts 2014, 2015, 2016 ... iii
CHAPTERS The Irish Economy - Forecast Overview and Summary ... 1
The International Economy ... 3
The Domestic Economy ... 14
General Assessment ... 38
Detailed Forecast Tables ... 43
APPENDIX Nowcasting Appendix ... 49
SPECIAL ARTICLES Distributional Impact of Tax, Welfare and Public Service Pay Policies: Budget 2016 and Budgets 2009-2016 ... 53
Summary Table
2012 2013 2014 2015 2016 Output (Real Annual Growth %)
Private Consumer Expenditure -0.8 -0.3 2.0 3.6 3.4
Public Net Current Expenditure -2.2 1.4 4.6 1.3 1.0
Investment 8.6 -6.6 14.3 27.2 19.2
Exports 2.1 2.5 12.1 13.1 7.6
Imports 2.9 0.0 14.7 15.7 10.1
Gross Domestic Product (GDP) 0.2 1.4 5.2 6.7 4.8
Gross National Product (GNP) 1.6 4.6 6.9 5.2 5.3
Prices (Annual Growth %)
Consumer Price Index (CPI) 1.7 0.5 0.2 -0.1 1.0
Growth in Average Hourly Earnings 0.2 -0.4 1.7 2.0 2.3
Labour Market
Employment Levels (ILO basis (000s)) 1,842 1,880 1,914 1,967 2,018
Unemployment Levels (ILO basis (000s)) 316 282 243 200 173
Unemployment Rate (as % of Labour Force) 14.7 13.0 11.3 9.3 7.9
Public Finance
General Government Balance (€ bn) -14.1 -10.2 -7.3 -2.3 -1.2 General Government Balance (% of GDP) -8.0 -5.7 -3.9 -1.1 -0.5 General Government Debt (% of GDP) 120.2 120.0 107.5 94.9 86.7
External Trade
Balance of Payments Current Account (€ bn) -2.7 5.6 6.8 11.6 14.5
Current Account (% of GNP) -1.5 3.1 3.6 5.4 6.2
Demand
Final Demand 1.5 0.9 9.4 11.1 7.5
Domestic Demand 0.7 -1.2 5.7 8.4 7.4
National Accounts 2014
A: Expenditure on Gross National Product
2013 2014 Change in 2014 € bn € bn Value Price Volume
Private Consumer Expenditure 85.7 89.0 3.8 1.7 2.0
Public Net Current Expenditure 26.1 27.2 4.3 -0.2 4.6
Gross Fixed Capital Formation 31.7 36.5 15.3 0.8 14.3
Exports of Goods and Services 191.4 215.0 12.3 0.2 12.1
Physical Changes in Stocks 0.8 1.9
Final Demand 335.7 369.6 10.1 0.7 9.4
less:
Imports of Goods and Services 156.8 180.3 15.0 0.3 14.7
Statistical Discrepancy 0.5 -0.2
GDP at Market Prices 179.4 189.0 5.3 0.1 5.2
Net Factor Payments -27.4 -26.2
GNP at Market Prices 152.0 162.9 7.1 0.2 6.9
B: Gross National Product by Origin
2013 2014 Change in 2014
€ bn € bn € bn %
Agriculture 3.2 3.4 0.2 6.4
Non-Agriculture: Wages, etc. 67.7 70.0 2.4 3.5
Other 64.0 68.4 4.4 6.9
Adjustments: Stock Appreciation 0.6 -0.3
Statistical Discrepancy -0.5 0.2
Net Domestic Product 135.0 141.9 6.8 5.0
Net Factor Payments -27.4 -26.2 1.2 -4.5
National Income 107.6 115.7 8.0 7.5
Depreciation 28.4 29.3 0.9 3.3
GNP at Factor Cost 136.0 145.0 9.0 6.6
Taxes less Subsidies 16.0 17.9 1.9 11.6
GNP at Market Prices 152.0 162.9 10.8 7.1
C: Balance of Payments on Current Account
2013 2014 Change in 2014
€ bn € bn € bn
X – M 34.6 34.9 0.2
F -27.4 -26.2 1.2
Net Transfers -2.9 -2.7 0.2
Balance on Current Account 4.3 6.0 1.6
National Accounts 2015
A: Expenditure on Gross National Product
2014 2015 Change in 2015 € bn € bn Value Price Volume
Private Consumer Expenditure 89.0 92.6 4.1 0.5 3.6
Public Net Current Expenditure 27.2 28.2 3.4 2.0 1.3
Gross Fixed Capital Formation 36.5 46.9 28.5 1.0 27.2
Exports of Goods and Services 215.0 259.0 20.5 6.6 13.1
Physical Changes in Stocks 1.9 1.0
Final Demand 369.6 427.6 15.7 4.1 11.1
less:
Imports of Goods and Services 180.3 214.4 18.9 2.8 15.7
Statistical Discrepancy -0.2 -0.2
GDP at Market Prices 189.3 213.2 12.6 5.5 6.7
Net Factor Payments -26.2 -30.5
GNP at Market Prices 162.9 182.0 11.7 6.2 5.2
B: Gross National Product by Origin
2014 2015 Change in 2015
€ bn € bn € bn %
Agriculture 3.4 3.4 0.0 1.0
Non-Agriculture: Wages, etc. 70.0 73.5 3.4 4.9
Other 68.4 92.0 23.6 34.5
Adjustments: Stock Appreciation -0.3 -0.3
Statistical Discrepancy 0.2 0.2
Net Domestic Product 141.9 168.9 27.1 19.1
Net Factor Payments -26.2 -31.0 -4.8 18.5
National Income 115.7 137.9 22.2 19.2
Depreciation 29.3 25.0 -4.3 -14.7
GNP at Factor Cost 145.0 162.9 17.9 12.3
Taxes less Subsidies 17.9 19.1 1.2 6.7
GNP at Market Prices 162.9 182.0 19.1 11.7
C: Balance of Payments on Current Account
2014 2015 Change in 2015
€ bn € bn € bn
X – M 34.9 44.5 9.7
F -26.2 -31.0 -4.8
Net Transfers -2.7 -2.7 0.0
Balance on Current Account 6.0 10.8 4.8
National Accounts 2016
A: Expenditure on Gross National Product
2015 2016 Change in 2016 € bn € bn Value Price Volume
Private Consumer Expenditure 92.6 96.7 4.4 1.0 3.4
Public Net Current Expenditure 28.2 28.9 2.8 1.8 1.0
Gross Fixed Capital Formation 46.9 57.4 22.3 2.6 19.2
Exports of Goods and Services 259.0 290.9 12.3 4.4 7.6
Physical Changes in Stocks 1.0 1.0
Final Demand 427.6 474.9 11.1 3.3 7.5
less:
Imports of Goods and Services 214.4 242.4 13.0 2.7 10.1
Statistical Discrepancy -0.2 -0.2
GDP at Market Prices 213.2 232.5 9.1 4.0 4.8
Net Factor Payments -31.0 -32.0
GNP at Market Prices 182.0 200.3 10.1 4.5 5.3
B: Gross National Product by Origin
2015 2016 Change in 2016
€ bn € bn € bn %
Agriculture 3.4 3.5 0.1 2.5
Non-Agriculture: Wages, etc. 73.5 77.1 3.7 5.0
Other 92.0 104.7 12.7 13.8
Adjustments: Stock Appreciation -0.3 -0.3
Statistical Discrepancy 0.2 0.2 0.0 0.0
Net Domestic Product 168.9 185.3 16.4 9.7
Net Factor Payments -31.0 -32.0 -1.0 3.2
National Income 137.9 153.3 15.4 11.2
Depreciation 25.0 26.5 1.5 6.0
GNP at Factor Cost 162.9 179.8 16.9 10.4
Taxes less Subsidies 19.1 20.4 1.4 7.3
GNP at Market Prices 182.0 200.3 18.3 10.1
C: Balance of Payments on Current Account
2015 2016 Change in 2016
€ bn € bn € bn
X – M 44.5 48.5 3.9
F -31.0 -32.0 -1.0
Net Transfers -2.7 -2.7 0.0
Balance on Current Account 10.8 13.7 2.9
The Irish Economy - Forecast Overview and Summary
The Irish economy is set to register a substantial growth performance in 2015 with the expected 6.7 per cent year-on-year increase in output unsurpassed since 2005. While the Irish recovery has benefitted from a weak Euro and strong economic performance amongst key trading partners, it is noteworthy, particularly given a variety of countervailing factors; the ongoing difficulties in the Irish financial sector, the related low levels of credit extended, the persistent high levels of private sector debt and the anaemic performance of many European economies since 2010.
The Nowcasting model (summarised in the Appendix) indicates that the economy grew by 6.8 per cent during 2015 with the highest rates of growth occurring in Q2 and Q3. Based on the strong performance through the year, we also revise upwards our outlook for 2016 with an expected output growth rate now of 4.8 per cent.
While investment began to contribute to the Irish recovery in 2014, private consumption saw a significant increase in 2015 with expenditure on items such as motor cars, retail sales and household goods registering the largest year-on-year growth. This increase in expenditure occurred as the overall burden of household debt in the Irish economy fell back to 2006 levels. Notwithstanding this increase, the level of consumption in real terms in 2015 is still set to be less than that which prevailed in 2008.
External trade is likely to continue as a significant source of growth in 2016, however we note a number of potential downside risks in that regard. The OECD, amongst others, is concerned about the performance of key emerging economies in 2016, while any unwinding of the ongoing vulnerabilities in the Chinese economy could have serious implications for key Irish trading partners such as the United States, the United Kingdom and Europe. Next year may also see a referendum in the UK on its membership of the European Union. The recent report by the ESRI,1 which teases out some of the likely implications of a British withdrawal, illustrates the negative trade implications for the Irish economy of such a development.
1 Barret, A., A. Bergin, J. FitzGerald, D. Lambert, D. McCoy, E. Morgenroth, I. Siedschlag and Z. Studnika (2015). Scoping
In the Autumn Commentary we outlined our view that a neutral budgetary strategy was the optimal policy to follow, especially given the strong growth rates evident in the economy. This was framed against the official position announced in the Stability Programme Update (SPU) in May that there would be a €1.5 billion stimulatory package split evenly between expenditure and taxation. However, it was particularly disappointing that the degree of the expansionary package was compounded by the greater than expected current Government expenditure in 2015 announced just prior to the budget. This suggests that the Government is putting almost €2.8 billion into the Irish economy at a time of already significant growth.
In light of the remarkable growth rates for 2014 and 2015, in the domestic section of the Commentary, we tease out the actual output levels vis-à-vis potential in the Irish economy at present. While unemployment at 9 per cent would suggest that there is still a large degree of spare capacity, current rates of productivity (both total factor and labour) are particularly high. Were these rates to converge back to long-run trends, as is likely, particularly as greater factor inputs are employed in the economy, then the degree of spare capacity would not be as large as previously thought. Consequently, in 2015, we believe a negative output gap of 1 per cent exists.
Finally, as with a number of recent Commentaries, we devote some attention to the housing market. Recent research2 suggests that it may take up to three years for supply in the Irish market to reach the underlying structural demand of approximately 25,000 units per annum. However, it is also clear that the targets for social housing set out in Social Housing 2020 (2014)3 for the period 2015-2018 are also unlikely to be met. One possible way of achieving a significant increase in social housing provision is for the State to provide this through local authority schemes as it used to prior to 2009.
2 Duffy D., D. Foley and K. McQuinn (2015). ‘Cross-country residential investment rates and the implications for supply
response in Ireland’, Paper to the joint EU Commission / ESRI Seminar: Housing Ireland’s Recovery: Policy perspectives, Dublin, November.
3 Social housing 2020 (2014). ‘Support, supply and reform’, Department of Environment, Community and Local
The International Economy
The economic performance of Ireland’s main trading partners remains positive with GDP in each of the UK, US and Euro Area increasing in the final quarters of 2015. Significant downside risks remain, particularly those associated with a downturn in the Chinese economy, which threaten future growth prospects for many developed economies. Figure 1 shows forecast GDP growth in Ireland’s three main trading partners. Since the Spring Commentary growth forecasts for the Euro Area for 2015 have been revised upwards from 1.3 per cent to 1.5 per cent. Real GDP in 2016 is forecast to grow by 1.7 per cent, relatively unchanged from the beginning of the year. While the 2015 and 2016 growth forecasts for the UK remain unchanged, growth forecasts for the US have been revised downwards since the Autumn Commentary. The US is now forecast to grow by 2.2 per cent in 2015 and 2.6 per cent in 2016, while the UK is forecast to grow by 2.4 per cent in each year.
FIGURE 1 Real GDP Growth (% change, year-on-year)
Euro Area United States United Kingdom
Sources: FocusEconomics, IMF, OECD, HM Treasury and Federal Reserve.
The Euro Area Economy
Compared with the second quarter of 2015, seasonally-adjusted GDP rose by 0.3 per cent in the Euro Area and by 0.4 per cent in the European Union during the third quarter of the year. When compared to the same period of 2014, seasonally-adjusted GDP rose by 1.6 per cent in the Euro Area and by 1.9 per cent in the European Union. Among the Member States for which data are available, -2
-1 0 1 2 3 4
2012 2013 2014 2015 2016 -2 -1 0 1 2 3 4
2012 2013 2014 2015 2016 -2 -1 0 1 2 3 4
2012 2013 2014 2015 2016
Estonia, Greece and Finland recorded negative growth in Q3 2015 while Romania, Slovakia and Poland recorded the highest growth rates.
Euro Area annual inflation was 0.1 per cent in October 2015, up from -0.1 per cent in the previous month and compares with a rate of 0.4 per cent for the same period last year. The latest figures from Eurostat also indicate that annual inflation in the European Union was 0 per cent in October 2015 compared to a rate of 0.5 per cent 12 months previous. When compared to the rates recorded in September 2015, annual inflation fell in four Member States, remained stable in seven and rose in 16. However, when energy prices – believed to be the main driver of falling inflation – are excluded, annual inflation was 1.2 per cent in October 2015. As noted in previous Commentaries, despite its drag on annual inflation, lower oil prices should continue to support consumption growth through the positive impact on household personal disposable income.
In September 2015 the seasonally-adjusted unemployment rate in the Euro Area was 10.8 per cent, down from 11.5 per cent in the same period last year. This is the lowest rate recorded in the Euro Area since January 2012 and compares to the 7.5 per cent recorded on the eve of the financial crisis in 2007. Among the Member States large differences remain in the level of unemployment. For example, the lowest unemployment rate for 2015, 4.5 per cent, was recorded in Germany in September. While the largest decrease in unemployment in the 12 months to September 2015 was registered in Spain – a fall of some 2.4 per cent – its unemployment rate remains amongst the highest recorded in the Euro Area at 21.6 per cent.
In response to persistent low inflation in the Euro Area, the European Central Bank (ECB) decided in the December governing council meeting to cut its deposit facility to -0.3 per cent from -0.2 per cent. The main refinancing rate remains unchanged at 0.05 per cent. In advance of the December governing council meeting, Mario Draghi, President of the ECB, indicated that all instruments available within their mandate would be used if it is concluded that the balance of risks to the medium-term price stability objectives are skewed to the downside. In addition, chief economist Peter Praet also cited mounting risks that inflation will remain below the ECB target of just below 2 per cent for longer than previously anticipated. In addition, the monthly asset purchases of €60 billion, as part of the non-standard monetary policy measures, have been extended to run until September 2017 or beyond if necessary.
concerns about growth prospects in emerging markets and unfavourable developments in financial and commodity markets, all of which signal downside risks to the outlook for growth and inflation. While he echoed Mario Draghi’s sentiment that monetary policy has been and will continue to be accommodative, he also highlighted the fact that without a common European fiscal policy, monetary policy alone cannot respond to all the existing challenges.
A recent report from the Association of European Conjuncture Institutes (AIECE)4 indicated that the Euro Area’s fiscal position has significantly improved since the difficulties of 2009. However, attention is drawn to the evolution of public debt levels, with consideration given to the growing heterogeneity in the fiscal positions of different countries. Compared to the situation in 2007 when the standard deviation of debt-to-GDP ratios across Euro Area countries was 29.7, current estimates suggest this had reached 40.3 in 2014. For example, public debt in Germany is expected to fall below the 70 percent of GDP threshold in 2016, while the rate in France is expected to exceed 100 percent of GDP.
While the weak Euro and low oil prices continue to support growth, downside risks from within the Euro Area continue to exist. Following difficult negotiations at the end of November, Greece succeeded in securing a deal with the Eurozone to unlock the latest tranche of financial aid. Although the fiscal situation in Greece remains problematic any spillover risk is nevertheless considered to be contained. The slowdown in China is also creating much uncertainty which is discussed in greater detail in The World Economy subsection.
The US Economy
Real GDP increased at an annual rate of 2.1 per cent in the third quarter of 2015 according to the Bureau of Economic Analysis. In the second quarter, real GDP increased by 3.9 per cent. The increase in real GDP in the third quarter (compared to an initial estimate of 1.5 per cent) primarily reflects upward revisions to business spending on equipment. Consumer spending also remains strong despite slight downward revisions this month. Growth in exports was also revised down in the third quarter reflecting a persistently strong Dollar and sluggish global demand.
Following the decision by the Federal Open Market Committee in October to leave interest rates unchanged, it is anticipated that strong figures recorded in the third quarter of the year will result in the first rate hike in nine years in mid-December. Since December 2008 the Federal Reserve has kept its benchmark
interest rate at a range between zero and one-quarter per cent. However, with the unemployment rate now at 5 per cent – what the Federal Reserve regards as ‘full employment’ – speculation has heightened that interest rates will be increased in December.
The unemployment rate is now at its lowest level since April 2008. Over the past 12 months, the unemployment rate and the number of unemployed persons were down by 0.7 percentage points and 1.1 million, respectively. The labour force participation rate was unchanged at a new 32-year low of 62.4 per cent in October, following a decline of 0.2 percentage points in September. The employment-population ratio, at 59.3 per cent, changed little in October and has hardly moved over the past year.
The UK Economy
The most recent data from the Office of National Statistics (ONS) indicate that UK GDP increased by 0.5 per cent in the third quarter of 2015. This compares to growth of 0.7 per cent reported in the second quarter of the year. As a result of these growth rates, GDP is 2.3 per cent higher in Q3 2015 compared to the same quarter one year ago. The apparent easing of austerity measures in the recent half-year budget update should go some way to reinforcing the positive growth outlook for 2016.
Despite the relative strength of the recovery and continued reduction in the unemployment rate, price pressure in the UK economy remains weak. The Consumer Price Index (CPI) fell by 0.1 per cent in the year to October 2015, the same fall as in the year to September 2015. Recent data from the ONS suggest that annual inflation has been at or around 0 per cent since February of this year. Much of the recent downward pressure on CPI inflation has reflected the fall in oil prices, the appreciation of Sterling and strong competition among retailers. Historically, price movements in these groups have been the main causes of inflation.
The unemployment rate fell to 5.3 per cent in the third quarter of 2015. This compares to a rate of 5.6 per cent in Q2 and 6 per cent a year previous. The rate recorded in Q3 2015 is also the lowest unemployment rate in the UK since April 2008. In the third quarter of the year the employment rate was at its highest since comparable records began in 1971, at 73.7 per cent. Despite the strong employment figures, pay inflation remains subdued. Excluding bonuses, regular earnings in the three months to September were 2.5 per cent higher than in the same three months of 2014. This is down from 2.8 per cent which was recorded for Q3 August 2015. Interest rate hikes are likely to remain unchanged while wage growth remains weak.
A British exit from the European Union remains one of the most prevalent risks to the Irish economy. A recent study by the ESRI5 determined the potential economic consequences of a ‘Brexit’ for Ireland. Focusing on four key areas – trade, foreign direct investment, energy and migration – the evidence suggests that Ireland’s interests are best served by the UK remaining within the EU. Research6 from the National Institute of Economic and Social Research (NIESR) highlighted the difficulty with quantifying the impact on the UK of a withdrawal from the EU given the range of factors that need to be considered. While the research does not anticipate significant disruption to employment levels in the UK, the analysis does suggest that a withdrawal could mean that the level of output in the UK economy would be lowered permanently. Other research on the topic has drawn similar conclusions.7
The World Economy
Weakening growth and financial vulnerabilities in China continue to be the main sources of downside risk. Despite repeated interest rate cuts, amongst other stimulus measures, China’s economic growth slowed to a six-year low of 6.9 per cent in the third quarter of 2015.
The ECB8 recently highlighted the main risk to the Euro Area of an economic slowdown in China; falling exports, capital outflows and exchange rate fluctuations. They maintain that an economic ‘confidence shock’ could lead to a tightening of financial conditions in emerging markets and a further slowdown of
5 Barret, A., A. Bergin, J. FitzGerald, D. Lambert, D. McCoy, E. Morgenroth, I. Siedschlag and Z. Studnika (2015). Scoping
the Possible Economic Implications of Brexit on Ireland. ESRI, www.esri.ie.
6 Pain, N. and G. Young (2004). ‘The macroeconomic impact of UK withdrawal from the EU’. Economic Modelling Vol.
21(3), pp 387-408. National Institute of Economic and Social Research, London.
7 Ottaviano, G., J.P. Pessoa, T. Sampson and J. Van Reenen (2014). Brexit or Fixit? The Trade and Welfare Effects of
Leaving the European Union. The Centre of Economic Performance (CEP)
http://cep.lse.ac.uk/pubs/download/pa016.pdf.
Euro Area foreign demand. In particular, it is feared that the health of the Chinese stock market could impact markets in the Euro Area through the effects on global confidence.
A recent paper from Buiter (2015)9 notes the reasons behind China’s downturn and likely recession. As with business cycles everywhere, rising excess capacity in a growing number of sectors, excessive leverage in the private sector as well as irrational exuberance in asset markets are cited as three of the main reasons. The paper concludes that while policy options exist they are unlikely to be implemented in time to prevent a recession. The OECD, amongst others, has noted the challenge for the Chinese economy is to rebalance activity towards consumption and services while maintaining GDP growth and financial stability.
In seeking to quantify the potential impact of any global shock on the Irish economy it is useful to examine results in Bergin et al. (2013).10 The analysis examines a 1 percentage point increase in world output; however, the effects are symmetric and therefore we can also interpret the results from the point of view of a growth shock which reduces world output by 1 percentage point. If this were to occur, Irish GDP in the first year of the shock would fall by 0.8 per cent. In addition to this, exports of goods and services would also fall by 3.2 per cent in the same year as the shock. As in previous Commentaries, it is worth highlighting the fact that any downside risk associated with the Chinese downturn would affect Ireland primarily through secondary markets such as the US, UK and the Euro Area.
Following a meeting of OPEC in early December, which resulted in no change made to the over-supply of oil, Brent crude oil prices fell a further 5 per cent to US$41. As recently as summer 2014, Brent stood at US$110 a barrel but in 16 months its price has been more than halved in response to a slowdown in China and other emerging market economies.
Implications for Irish Exports, Imports and the Balance of Payments
The Quarterly National Accounts (QNA) figures for Q3 2015 show that seasonally adjusted, the total volume of imports are up 18 per cent over Q3 2014. This consisted of increases in both goods and services imports of 5 per cent and 28 per cent respectively. The strong growth in service imports, in part, reflects patent purchases. Seasonally-adjusted total exports also show strong growth with an
9 Buiter W. (2015). ‘Is China Leading the World into Recession?’ Global Economic View, Citibank. Available online at:
http://willembuiter.com/China2015.pdf.
10 Bergin A., T. Conefrey, J. Fitzgerald, I. Kearney and N. Znuderl (2013). ‘The HERMES-13 macroeconomic model of the
increase of 12 per cent. Goods exports increased by 16 per cent and services exports grew 8 per cent in the year to Q2 2015.
The Balance of Payments release for Q3 2015 shows strong growth in both services imports and exports. Total services exports, as recorded by the Balance of Payments, increased 15 per cent in value from Q3 2014 to Q3 2015, primarily driven by an increase in computer services exports of 22 per cent. The figures also reveal an increase of service imports of 32 per cent. The main driver of this was an increase in royalties and licences. The figure for the current account surplus for Q3 2015 is €2.4 billion or 4.5 per cent of GDP. This compares to a surplus of €3.12 billion for Q3 2014. This figure is somewhat less than would have been the case under the previous treatment of aircraft leasing in the National Accounts. This figure can also be affected by redomiciled PLCs which tend to inflate the balance on the current account.
FIGURE 2 Goods Exports and Imports
Source: Central Statistics Office.
Looking at more recent data, the monthly release of goods exports and imports by the CSO shows that seasonally-adjusted goods exports fell by 4.0 per cent from the August 2015 figure. The equivalent figure for goods imports fell by 3 per cent over the same period. The overall effect was to decrease the trade surplus by €252 million or 7 per cent in September. A noticeable downward trend has emerged in the trade statistics in recent months as is evident from Figure 2.
The unadjusted value of goods exports increased by 5 per cent or €420 million in the year to September. Some of the components that experienced strong growth 0
2,000 4,000 6,000 8,000 10,000 12,000
compared to last year include medical and pharmaceutical products of 14 per cent or €278 million. Essential oils increased by 17 per cent or €88 million and electrical machinery, apparatus and appliances and parts increased by 24 per cent or €48 million.
Overall the unadjusted value of goods imports decreased in September 2015 by 5 per cent or €284 million when compared to September 2014. The decrease consisted of falls in imports of petroleum of 47 per cent or €245 million. Imports of other transport equipment (including aircraft) fell by 82 per cent or €642 million. This particular component is highly volatile and so it is not too surprising to see movements of this scale from the series. There was also growth in some goods including organic chemicals of 86 per cent or €148 million and medical and pharmaceutical products of 37 per cent or €130 million. Once again it appears that goods imports and exports growth is dominated by a relatively small number of sectors and the volatility of these sectors increase the difficulty in forecasting these series.
Figure 3 provides the share of goods imports and exports by country. The UK remains Ireland’s single biggest trading partner with approximately 28 per cent of imports and 14 per cent of exports. This reliance on the UK means there could potentially be significant implications if Britain leaves the EU (Brexit). A recent publication from the ESRI,11 discussed previously, indicated that if Brexit were to occur, the bilateral trade flows between Ireland and the UK could decrease by as much as 20 per cent. This would obviously have negative implications for Ireland’s economic growth. Our other main trading partner, the US, accounts for approximately 22 per cent of exports and 12 per cent of imports. Figure 4 highlights the level of service exports and imports by geographical location. The graph shows that the majority of services exports are going to the European Union while the majority of services imports are coming from outside the European Union.
11 See Barrett A., A. Bergin, J. Fitzgerald, D. Lambert, D. McCoy, E. Morgenroth, I. Siedschlag and Z. Studnicka (2015).
FIGURE 3 Goods Exports and Imports by Destination
Source: Central Statistics Office.
As well as the potential threat of Brexit, the situation in China, as mentioned in the World Economy subsection, also provides a source of uncertainty for Ireland. Although Ireland’s share of goods exports to China is relatively small at 2 per cent and so the direct impact on exports would be limited, a slowdown in China leading to a drag on growth in our major trading partners could negatively impact Ireland’s growth.
FIGURE 4 Services Exports and Imports by Geographical Detail (Q3 2015, € million)12
Source: Central Statistics Office.
12 Data for services exports and imports are only available for EMU18, EU28 and All Countries.
22%
14%
2% 44%
18%
Total Goods Exports
US
UK
China
Europe (ex UK)
Other
12%
28%
8%
32% 20%
Total Goods Imports
US
UK
China
Europe (ex UK)
Other
0 5000 10000 15000 20000 25000
Euro Area European Union (excl.
Euro Area) All countries (excl. EU28)
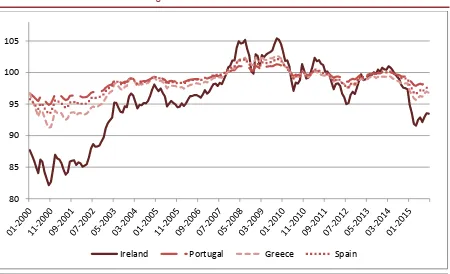
Central to Ireland’s recent strong export performance has been the improvement in the economy’s competitiveness and the robust growth of our main trading partners. The depreciation of the Euro against the US Dollar and the UK Pound as a result of the ECB’s accommodative monetary policy and lower unit labour costs have both led to a significant improvement in Ireland’s international competitiveness which boosts export growth. If we compare Ireland’s nominal effective exchange rate with countries such as Greece, Portugal and Spain as in Figure 5, it becomes clear why Ireland’s exports have grown so robustly. Ireland’s nominal effective exchange rate since 2014 has depreciated to a significantly greater extent than these countries which also experienced large recessions. This pattern is also observed in the real effective exchange rate when inflation is taken into account.
FIGURE 5 Nominal Effective Exchange Rate Index = 2010
Source: Bank of International Settlements.
As well as a fall in the effective exchange rate, Ireland has regained its export market share, driven in part by increased cost competitiveness. Figure 6 shows relative unit labour costs (labour costs adjusted for productivity and compared with Ireland’s trading partners).13 It is clear that a reduction in unit labour costs has also been helpful in improving Ireland’s export performance in recent years. It is important to note that some of the fall has been a result of compositional effects, i.e. a move away from the labour intensive construction sector.14
13 OECD Economic Surveys: Ireland 2015.
14 O’Farrell, R. (2015). ‘Wages and Ireland’s International Competitiveness’. The Economic and Social Review, 46(3),
pp.429-458. 80
85 90 95 100 105
[image:22.595.75.525.303.577.2]FIGURE 6 Relative Unit Labour Costs and Export Market Performance
Source: OECD economic outlook database.
Taking these factors into account, we forecast exports to remain relatively robust in 2015, growing by 13.1 per cent before returning to more moderate levels of 7.6 per cent in 2016. Given the strong economic performance domestically, the increase in consumers’ disposable income and the associated pickup in domestic consumption, we forecast imports to grow by 15.7 per cent in 2015 and 10.1 per cent in 2016.
70.0 75.0 80.0 85.0 90.0 95.0 100.0 105.0 110.0 115.0 120.0
2000 2001 2002 2003 2004 2005 2006 2007 2008 2009 2010 2011 2012 2013 2014
The Domestic Economy
Output
The domestic section of the Commentary is organised as follows; we initially review the outlook for output growth before discussing developments in the Irish monetary and financial sectors. Prices and earnings in the economy are then discussed, followed by a review of demand-side factors such as consumption and housing market issues. On the supply side, we then examine developments in investment and the labour market before concluding with an analysis of the public finances.
The Irish economy is set to grow by a significant 6.7 per cent in 2015. This constitutes a remarkable recovery given the scale of difficulties which have afflicted the domestic economy over the past six or seven years and it is also the largest rate of growth experienced by the Irish economy since 2005.
The growth performance in the current year has changed somewhat in composition, in that the initial wave of the recovery, which had been export driven in nature, is now increasingly being complemented by strong increases in both investment and consumption. In the initial Commentary of 2015 we had suggested that consumption would become an increasingly relevant source of growth in 2015 and this has now clearly transpired, indicating that while hangovers from the financial crisis are still prescient in the Irish economy they are no longer restricting growth.
The Nowcasting model (summarised in the Appendix) indicates that the Irish economy grew by nearly 1.4 per cent for Q4 2015 following an increase of 1.7 per cent in Q3 2015. Based on these improving trends, we have revised upwards our growth forecast for 2015; we now envisage 2015 output growth in GDP of 6.7 per cent. We also revise upwards our outlook for 2016 with output growth of 4.8 per cent now expected.
Potential Output and the Output Gap
Byrne and McQuinn (2014)15 and McQuinn and Whelan (2008)16 where the following production system is assumed to capture the underlying dynamics of the Irish economy:
𝑌𝑡 = 𝐴𝑡𝐾𝑡𝛼𝐿1−𝛼𝑡
𝐾𝑡 = (1 − 𝛿)𝐾𝑡−1+ 𝐼𝑡−1
𝐼𝑡 = 𝑠𝑡𝑌𝑡
𝐿𝑡 = (1 − 𝑢𝑢𝑢𝑡) ∗ 𝑃𝑡∗ 𝑃𝑃𝑃𝑡
∆𝑙𝑙𝑙𝐴𝑡 = 𝑙𝑡
where 𝑌𝑡, 𝐾𝑡, 𝐼𝑡, and 𝐿𝑡 are output, capital, investment and employment
respectively. 𝑃𝑃𝑃𝑡 is population levels and 𝑃𝑡 is the labour force participation
rate. Many studies have highlighted the difficulty in interpreting productivity estimates for the Irish economy mainly due to the significant presence of the multinational sector (see Honohan and Walsh, 200217 for example). Therefore we use GNP as the relevant output series for the empirical exercise.18
In generating estimates of potential output, steady-state assumptions for the following key parameters are required; the investment rate 𝑠𝑡, the growth rate of
total factor productivity (TFP) 𝑙𝑡 and the unemployment rate 𝑢𝑢𝑢𝑡.
As noted by Byrne and McQuinn (2014) a historical review of the Irish labour market would suggest that the long-run or median unemployment rate is approximately 6.5 per cent. At present, given that the actual unemployment rate in the economy is over 9 per cent, this suggests the existence of a significant, negative output gap in the Irish case meaning that a considerable amount of spare capacity exists in the domestic economy. Indeed if we simulate the system above taking both the investment rate and the rate of TFP growth as being at their current rates, then the output gap at the end of 2015 is approximately minus 2.6 per cent.
However, such an assumption in the case of TFP growth is somewhat problematic. Consider the graph of Irish productivity rates below along with the
15 Byrne D. and K. McQuinn (2014). ‘Irish Economic Performance 1987-2013: A Growth Accounting Assessment.’, QEC
Research Note, Winter.
16 McQuinn K. and K. Whelan (2008). ‘Prospects for growth in the Euro Area’, CESifo Economic Studies, Vol. 54(4),
pp.642-680, 2008.
17 Honohan P. and B. Walsh (2002). ‘Catching up with the leaders: the Irish hare’, Brookings Papers on Economic
Activity, No. 1, pp.1-57.
18 Note in calculating potential output estimates, we use data up to 2016 where the data for 2015 and 2016 are the
filtered value.19 The filtered value is typically taken to represent the long-run or steady-state trend for the variable in question. The filtered estimate suggests that in 2015 the long-run estimate of Irish TFP growth is approximately 1.6 per cent.
As noted by McQuinn and Whelan (2015)20 most European economies and indeed the United States have experienced a consistent decline in both labour and total factor productivity rates since the 1990s. The Irish economy also appears to have registered a relatively stagnant rate of productivity growth over the same period. However since 2010, a clear increase in TFP is apparent. The crucial issue, therefore, in assessing potential output growth, is whether this recent increase in productivity should be treated as a temporary issue or more reflective of an underlying structural improvement in productivity in the Irish economy. For a number of reasons we believe a more accurate approximation of the underlying rate of TFP growth in Irish economy at the present time is given by its filtered rate of 1.6 per cent. This results in a (negative) output gap of -0.9 per cent.
FIGURE 7 Actual and Filtered TFP Growth Rates (%) for the Irish Economy: 1990-2015
Source: QEC estimates.
Given the significant fall-off in economic activity after 2007/2008, and the collapse in the housing market in particular,21 there has been some suggestion of an investment deficit in the Irish economy at present. This would suggest that the
19 The filtered value is given by a Hodrick-Prescott filter with lambda, the smoothing parameter = 100.
20 McQuinn K. and K. Whelan (2015). ‘Europe’s Long-Term Growth Prospects: With and Without Structural Reforms’,
ESRI Working Paper No. 501, May.
21 See the Autumn Commentary 2015 for a comparison of Irish residential investment rates with other leading European
investment rate is currently somewhat below its long-run rate. In Figure 8 we plot both the investment rate and its filtered estimate over the long run (from 1961 to 2015), where investment is taken as a percentage of GNP.
From the graph it can be seen that the actual and filtered investment rate in 2015 are almost identical, reflecting the steep recovery in investment over the last couple of years. Over the period 1960-2015 the median investment rate is 23 per cent with the actual 2015 estimate 23.8 per cent. Therefore, whilst there are shortages in certain types of investment in the domestic economy, overall, the present investment rate would appear to be in line with its long-run steady state rate.
FIGURE 8 Actual and Filtered Investment Rate for the Irish Economy: 1961-2015
Source: QEC data and estimates.
Monetary and Financial Conditions
The most recent financial statistics release from the Central Bank reveals a modest improvement in household circumstances. Figure 9 shows both the total level of household debt in the economy and the ratio of debt to income. It is clear that there has been a continuing decline in the level of debt since its peak in 2008. The current level marks the lowest level reached since Q1 2006. Although this is a positive development it is worth noting that this is still relatively high compared to other countries. In fact, in the EU, only Denmark and Holland have higher debt-to-income ratios.
10.0 15.0 20.0 25.0 30.0 35.0
1960 1962 1964 1966 1968 1970 1972 1974 1976 1978 1980 1982 1984 1986 1988 1990 1992 1994 1996 1998 2000 2002 2004 2006 2008 2010 2012 2014
%
Household net worth22 rose to reach €600.1 billion or €129,454 per capita during Q2 2015. This represents growth of 0.6 per cent over the previous quarter. This is largely due to increases in housing asset values as well as declines in household liabilities. Overall household net worth has increased by 36 per cent since its lowest level of €441.2 billion in Q2 2012.
Household debt continued to decline in Q2 2015, falling to €153.2 billion or €33,056 per capita. Overall the level of debt has decreased by 24.8 per cent since its peak of €203.7 billion at Q3 2008, which leads to a significant improvement in household debt sustainability in Q2 2015. More specifically the ratio of debt to disposable income fell by 4.3 percentage points during the quarter.
FIGURE 9 Irish Household Debt 2003-2015
Source: Central Bank of Ireland.
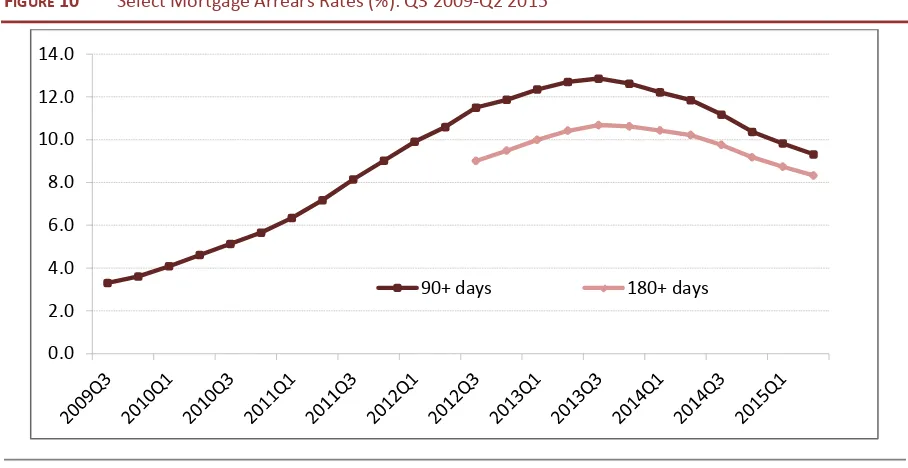
The number of mortgage accounts in arrears of over 90 days increased significantly in recent years, from 3.3 per cent of all outstanding mortgages on principal dwelling (PDH) properties at the end of Q3 2009 to a peak of 12.9 per cent by the end of Q3 2013. Figure 10 shows the number of mortgages in arrears over 90 days and 180 days as a percentage of outstanding PDH mortgages.
There is now a clear downward trend emerging as the number of accounts in arrears over 90 days continues to decline in Q3 2015. The number of accounts in arrears over 90 days at the end of June was 65,584 or 8.7 per cent of outstanding
22 Household net worth is calculated as the sum of household housing and financial assets minus their liabilities. The
Central Bank of Ireland estimate of housing assets is based on the size and value of housing stock. Data on the value of housing are obtained from the CSO’s ‘Residential Property Price Index’ (RPPI).
100.0 120.0 140.0 160.0 180.0 200.0 220.0 240.0
60.0 80.0 100.0 120.0 140.0 160.0 180.0 200.0 220.0
PDH mortgages. This represents a quarterly fall of 6.7 per cent and is the seventh consecutive quarter of decline. As noted in the Labour Market section, the decline in the unemployment rate and the improvement generally in labour market conditions are likely to be the main reasons for the improvement in the arrears rate.23 However, the number of arrears over 180 days has remained relatively stable at around 8.5 per cent over the past four years. The total number of buy-to-let (BTL) mortgages in arrears of 90 days and over at the end of Q2 2015 was 19 per cent; this represented a marginal decline from the peak of 22 per cent registered in Q3 2014.
FIGURE 10 Select Mortgage Arrears Rates (%): Q3 2009-Q2 2015
Source: Central Bank of Ireland.
Most recent Central Bank data show that the growth rate of credit extended to households remains negative. This change in credit levels has remained negative since late 2008 and reflects the significant deleveraging being undertaken by Irish households in the aftermath of the credit boom and subsequent bust. From Figure 11 we can see a precipitous decline in lending for consumption purposes from 2008 onward. Although households continue to pay down their debt levels, in the last year the rate of decline has decreased significantly. Clearly the changes within this figure signify that some households are borrowing to fund the increased consumption observed in 2015. This trend correlates with the pick-up in consumer sentiment reflected in the KBC/ESRI Consumer Sentiment Index. As we expect consumption to continue to increase in 2016, it is highly likely that changes in credit for consumption purposes will register positive growth next year for the first time since early 2009.
23 See Mc Carthy, Y. (2014). ‘Disentangling the mortgage arrears crisis: The role of the labour market, income volatility
and housing equity’ Research Technical Papers, 02/RT/14, Central Bank of Ireland. 0.0
2.0 4.0 6.0 8.0 10.0 12.0 14.0
[image:29.595.70.524.251.485.2]FIGURE 11 Growth in Lending to Irish Households
Source: Central Bank of Ireland.
It is interesting to observe that the cost of finance to households has drifted upwards since the start of 2015. In Figure 12 interest rates on overdraft facilities and consumer loans are plotted from 2013 onwards. With the exception of loans for greater than five years, all rates have steadily increased during the course of the present year. As noted in McQuinn and Morley (2015)24 in the case of mortgage interest rates, this occurs at a time when the ECB policy rate has been at a record low for some time.
FIGURE 12 Interest Rates (%) on Loans to Irish Households
Source: Central Bank of Ireland.
24 McQuinn K. and C. Morley (2015). ‘Standard variable rate (SVR) pass-through in the Irish mortgage market: An
updated assessment’, QEC Research Note, June. - 30.0
- 20.0 - 10.0 10.0 20.0 30.0
Total Lending House Consumption
3.50 4.50 5.50 6.50 7.50 8.50 9.50 10.50
Overdrafts Consumer loans less than 1 year
Net lending to Irish non-financial corporations (NFCs) fell in September by 6.2 per cent. From Figure 13 it appears both longer- and short-term NFC lending has been declining since Q3 2013. This fall in longer-term credit is of some concern as it indicates a declining investment focus in the NFC sector. On the other hand, loans for medium-term durations (between one and five years), have recently showed strong positive growth, increasing by 12.9 per cent over September 2014.
FIGURE 13 Year-on-Year Growth Rate (%) of Lending to Irish Resident Non-Financial Corporations:
Q1 2007-Q2 2015
Source: Central Bank of Ireland.
Given the importance of small and medium enterprises in Ireland,25 it is useful to look at recent trends in credit extended to them. Although deleveraging continues, there have been increases in year-over-year growth rates in credit extended to certain sectors. In particular, two of the largest percentage increases occurred in the information and communication sector while growth was also observed in other real estate activities. Credit extended to small and medium enterprises (SMEs) is expected to improve and become more broad based as SMEs further pay down debt and as the current economic environment provides favourable conditions for banks to increase profitability and increase credit availability.
In terms of funding of the sovereign, the overall picture in 2015 continues to improve. A total of €18 billion worth of loans was re-financed between Q4 2014 and Q2 2015. It is estimated that the total interest cost savings could exceed €1.5 billion over five years. In 2015, the NTMA issued its first ever 30-year bond which raised €4 billion; the yield on the bond was 2.088 per cent. The yield on the €1
25 See Lawless, M., C. O’Toole and D. Lambert (2014). Financing SMEs in Recovery: Evidence for Irish Policy Options, ESRI
Research Series. - 30.0
- 20.0 - 10.0 10.0 20.0 30.0 40.0 50.0
billion 2045 bond issued in March dropped to 1.31 per cent. Seven-year bonds were also sold in May with two 15-year bonds issued in September. As of November, €13 billion of sovereign funding has been issued so far this year, while the Exchequer had €15 billion of cash and other liquid assets at the end of September 2015.
Prices and Earnings
The monthly change in the Consumer Price Index (CPI) in November was -0.3 per cent. This compares to a growth rate of -0.2 per cent in October. The most significant factors that contributed to the decrease included a fall in transport prices of -1.6 per cent and a reduction in restaurants and hotels prices of -0.6 per cent.
More importantly the latest CPI release from the CSO shows that annual growth in average prices is -0.2 per cent in November. This is the same as the growth rate observed in October. Given the strength of underlying economic activity, the deflation reflects the importance of external international factors such as falling energy prices. Figure 14 shows the annual growth rate in CPI with and without energy prices; excluding energy products results in an annual inflation rate of 0.8 per cent, therefore the collapse in oil prices (Figure 15) earlier in the year is still exerting a significant drag on annual inflation. As a net importer of oil, the ongoing low price is acting as a significant stimulant to economic activity where businesses and consumers are the beneficiaries of lower than expected fuel costs.
FIGURE 14 Inflation Rates Annual % Change 2012 M01-2015 M11
Sources: Central Statistics Office and European Central Bank.
-1 -0.5 0 0.5 1 1.5 2 2.5 3
Some of the notable annual changes in the components of the CPI include decreases in transport of -5.3 per cent, clothing and footwear of -3.6 per cent and food and non-alcoholic beverages of -1.3 per cent. There were also positive growth rates observed in components such as education of 3.8 per cent, miscellaneous goods and services of 2.3 per cent and restaurants and hotels of 1.4 per cent.
FIGURE 15 Oil Price US$ per Barrel
Source: Federal Reserve of St. Louis.
A detailed breakdown of the percentage contribution to the annual fall in inflation reveals that transport, food and non-alcoholic beverages and clothing and footwear had the most significant effect, accounting for -0.71, -0.14 and -0.15 per cent respectively. It would appear that overall average prices in the service sector are growing with an increase of 2.4 per cent year-on-year while average prices for goods fell by 3.6 per cent.
The Harmonised Index of Consumer Prices (HICP), which allows for cross country comparisons of inflation within the EU, reveals that average annual prices are down 0.1 per cent from a year earlier. According to the HICP, some of the most notable changes in the year include increases in housing, water, electricity, gas and other fuels of 4.9 per cent, education of 3.8 per cent and restaurants and hotels of 1.4 per cent. Similar to the CPI, there were significant decreases in transport of 5.7 per cent and clothing and footwear of 3.4 per cent.
Preliminary estimates for earnings growth in Q3 2015 suggest an annual increase in Average Hourly Earnings of 2.1 per cent, or from €21.02 to €21.46. This compares to an annual increase of 1.4 per cent for the previous quarter. The results suggest a broad-based increase with ten of the 13 sectors seeing growth 0.00
20.00 40.00 60.00 80.00 100.00 120.00 140.00
in Average Hourly Earnings. Of these, the largest increase was recorded in the administrative and support services sector, rising 10.6 per cent. The largest fall was recorded in the human health and social work sector, decreasing 0.7 per cent.
Broadly similar earnings growth was observed in small, medium and large companies. In particular, annual Average Hourly Earnings in companies with less than 50 employees increased by 2.3 per cent while companies with employees between 50 and 250 grew by 2 per cent and companies with more than 250 employees experienced the largest growth at 2.6 per cent.
Earnings results by sector were mixed with private sector growth in annual Average Hourly Earnings of 2.8 per cent while the public sector experienced albeit marginal but negative growth of -0.2 per cent. The latter result could reflect an increase of employment in the public service at lower wage levels resulting in reduced overall Average Hourly Earnings.
Our inflation forecasts for 2015 and 2016 are presented in Table 1. We expect annual inflation as measured by the CPI to fall marginally by 0.1 per cent in 2015. We then expect inflation to rise to 1 per cent in 2016 as the ECB continues monetary easing to support Euro Area inflation, and as domestic activity – and in particular greater levels of consumption – increase aggregate demand. On the basis of increased labour demand and some tightening in the labour market, we expect average growth in earnings to reach 2 per cent in 2015 and to grow by a further 2.3 per cent in 2016. As well as growth in earnings, the expected deflation means that households will experience an increase in real disposable income.
TABLE 1 Inflation Measures
2013 2014 2015 2016
Annual Change
% % % %
CPI 0.5 0.2 -0.1 1.0
Personal Consumption Deflator 1.7 1.7 1.0 1.5
HICP 0.5 0.3 0.1 1.2
Sources: Central Statistics Office and ESRI forecasts.
Demand
Household Sector Consumption
with the volume of sales in July being the highest since July 2008. Exchequer Returns, VAT receipts and the continuing improvement in the labour market, coupled with rising consumer sentiment suggest that the growth in personal consumption will be higher this year than had been previously anticipated. Thus, we are now forecasting that growth in the volume of personal consumption will be 3.6 per cent this year, with value growth of 4.1 per cent. This implies a personal consumption deflator of 0.51 per cent, indicating that inflationary pressures in the economy remain low.
Many of the same factors are likely to underpin personal consumption growth in 2016. Interest rates are likely to remain low and some stimulus can be expected as the taxation changes announced in Budget 2016 come into force. As shown in the Monetary and Financial Conditions section, household debt levels remain high and deleveraging will have to continue. However, the data also show that the contraction in lending for consumption purposes has reduced substantially. Thus, we are forecasting that growth in personal consumption in 2016 will be broadly in line with this year. With the expected deflator on personal consumption increasing to 1 per cent, the value of personal consumption growth in 2016 is forecast to be 4.4 per cent.
Property Market Developments
FIGURE 16 Growth in Residential Property Prices, Monthly and Annual Percentage Change
Source: Central Statistics Office.
Data from the Private Residential Tenancies Board (PRTB) show that the growth in private rents has continued with national rents increasing by 8.6 per cent in the year to the third quarter of 2015. Dublin rents increased by 8.7 per cent while outside Dublin rents rose by 8.5 per cent in the year. Given the strong growth rates shown by private rents over the past couple of years a series of measures aimed at stabilising rents have been announced.26 The main measure announced is the extension of the period for rent reviews from 12 to 24 months.
Other measures announced include a longer notice period of new rent, the provision of comparable rents in the area, and notification of rent increases to the PRTB. Measures are also being introduced to improve legal protection for tenants and to increase tenants’ awareness of their rights.
A number of factors may be influencing the residential market at present. The introduction of the macro-prudential rules could be impacting on demand levels, particularly in urban areas. It may also reflect the impact of house price growth outstripping any growth in incomes resulting in a negative impact on affordability.Asking prices on daft.ie show strong price growth in the commuter counties at present, indicating that demand may have shifted to some locations with better availability and affordability. In particular, the down payment requirement under the new macro-prudential regulations is likely to have adversely impacted on affordability amongst first-time buyers in Dublin especially.
26 Department of Environment, Community and Local Government (2015). ‘Stabilising Rents, Boosting Supply’,
November. -25 -20 -15 -10 -5 0 5 10 15 20 -3 -2 -1 0 1 2 3 4
Feb-05 Aug-06 Feb-08 Aug-09 Feb-11 Aug-12 Feb-14 Aug-15
An nu al % ch an ge M on th ly % ch an ge
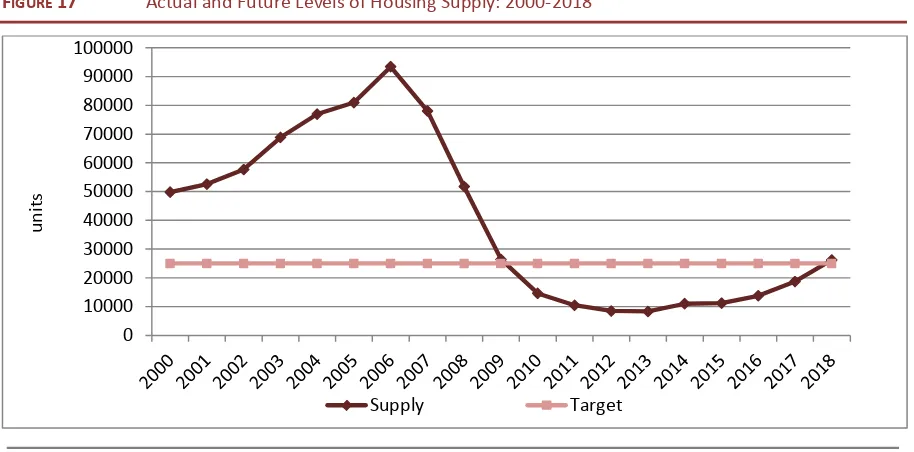
To get an idea of future housing supply levels we build on existing research on the housing market; Byrne et al. (2014)27 estimate a structural level of housing demand, where they assume that this structural level is a function of the number of independent households in the State. The number of households is a product of population estimates and headship rates, all of which are derived from micro-level data sources. At present, Byrne et al. (2014) estimate that, based on this approach, 25,000 housing units per annum are required in the Irish market. In a recent application Addison-Smyth and McQuinn (2015)28 use this structural level of housing demand as an indicator of fundamental supply in the market arguing that, in the long run, this structural level of demand is supplied to the market.
We now examine the relationship between this long-run level of supply and actual supply through a standard error correction model; i.e. we assume that the actual level of supply is related to the long-run level, and where a divergence occurs, that the actual level converges back to the long-run level over time. Forecasts of the actual supply level can then be obtained using forecasts of the independent households from Byrne et al. (2014). The results can be seen in Figure 17 where both the actual and future level of supply and the 25,000 unit ‘target’ are plotted.
FIGURE 17 Actual and Future Levels of Housing Supply: 2000-2018
Source: QEC estimates.
27 Byrne, D. D. Duffy and J. FitzGerald (2014). Household Formation and Tenure Choice, Quarterly Economic
Commentary Research Note, Summer.
28 Addison-Smyth D. and K. McQuinn (2015). ‘Assessing the Sustainable Nature of Housing-Related Taxation Receipts:
The Case of Ireland’, ESRI Working Paper No. 503. 0
10000 20000 30000 40000 50000 60000 70000 80000 90000 100000
uni
ts
[image:37.595.71.528.446.672.2]Results from the exercise suggest that, if the historical relationship between the long-run fundamental price and the change in actual price holds into the future, then it will be 2018 at the earliest before the underlying demand in the market is met.
Given the shortages of supply in the Irish housing market and the ongoing policy debate concerning this issue, it is interesting to examine the provision of social housing through time. In Figure 18 we plot the total number of both local authority and voluntary non-profit housing provided in the Irish State since 1970. This is complemented with the percentage of the total number of houses constructed due to social housing over the same period.29
FIGURE 18 Local Authority and Voluntary Non-Profit Houses: 1970-2015
Source: Department of the Environment, Community and Local Government and QEC estimates.
Also included are the targets specified in the Government’s Social Housing Strategy 2020 (2014). It is clear that there has been a significant decline in the provision of social and voluntary housing since 2009 with just over 5,500 units built since then.30 This is true both in the case of the actual units built and the percentage of the total number of housing units accounted for by social housing. Interestingly, at times during the 1970s and 1980s, social housing accounted for nearly one-third of the total stock of housing built in the economy for a given year.
29 Note: Care should be exercised in comparing data for this series between pre-2009 and post-2010. Up to 2010,
completions relating to long term voids and demountables were included as new build completions.
30 The Government commits to the provision of 35,000 social housing units over the six-year period 2015-2020 and the
provision of 18,000 units over the period 2015-2018.
0.0 5.0 10.0 15.0 20.0 25.0 30.0 35.0 0 1000 2000 3000 4000 5000 6000 7000 8000 9000 10000
1970 1972 1974 1976 1978 1980 1982 1984 1986 1988 1990 1992 1994 1996 1998 2000 2002 2004 2006 2008 2010 2012 2014 2016 2018 2020
uni
ts
Social + Voluntary Target Percent (RHS)
Furthermore, the targets outlined in the Government’s official response to the social housing issue indicate that over 5,800 units will have to be built per annum over the six-year period 2015-2020. Given the relatively low level of social housing units constructed in 2015, this suggests that this target is already under pressure.
Having peaked at close to 24 per cent in 2010, the vacancy rate for office property in the Dublin market is now estimated to be below 8 per cent. With no construction taking place for a number of years as a result of the financial crisis, activity levels have picked up and it is estimated that there is currently 2.1 million square feet of office space under construction in the Dublin market. 31 However, it is unlikely that substantial new office space will be supplied before 2017, with concerns that this could limit expansion of existing firms or the ability to attract new FDI.32
FIGURE 19 Dublin Office Market Statistics
Source: Jones Lang LaSalle.
31 Jones Lang LaSalle, Dublin Office Market report Q3 2015.
32 Duffy, D. and H. Dwyer (2015). ‘FDI and the availability of Dublin Office Space’ Quarterly Economic Commentary
Research Note, Autumn.
500,000 1,000,000 1,500,000 2,000,000 2,500,000 3,000,000 3,500,000 4,000,000 4,500,000 5,000,000 10,000,000 15,000,000 20,000,000 25,000,000 30,000,000 35,000,000 40,000,000 St oc k U nd er C on st ru ct io n ( sq .ft .) To ta l S to ck a nd V ac an t S to ck (s q. ft .)
Occupied Stock, Vacant Stock and Stock Under Construction
Supply
Investment
The third quarter National Accounts show that gross domestic fixed capital formation, investment, grew by over 35 per cent compared to the third quarter of 2014. However, this is due to the purchases of patents, and underlying growth is not as strong as suggested by the headline numbers. As highlighted in previous Commentaries investment in building and construction has grown strongly in 2015. Indicators suggest that the level of house completions in 2015 will be only marginally higher than that achieved in 2014. Based on completions data and the CSO Index of Building and Construction, the volume of new residential investment is forecast to grow by over 14 per cent this year. However, as we have previously pointed out, this growth rate is from a very low base and so the increase in the level of completions will be moderate. We expect that, following completions of 11,016 last year, completions will reach 12,500 in 2015.