IEEE--ICET 2006
2nd International Conference on Emerging Technologies
Peshawar, Pakistan, 13-14 November 2006
On The Error Vector Magnitude As A Performance
Metric And Comparative Analysis
Rishad Ahmed Shafik, Md. Shahriar Rahman, AHM Razibul Islam* and Nabil Shovon Ashraf Department of Electrical and Electronic Engineering, Islamic University of Technology, Dhaka, Bangladesh
*Department of Radio Communication Engineering, Kyung-Hee University, South Korea. Email: [email protected]
Abstract: In this paper, we present the error vector magnitude (EVM) as a figure of merit for assessing the quality of digitally modulated telecommunication signals. We define EVM for a common industry standard and derive the relationships among EVM, signal to noise ratio (SNR) and bit error rate (BER). We also compare among the different performance metrics and show that EVM can be equivalently useful as signal to noise ratio and bit error rate. A few simulation results are presented to illustrate the performance of EVM based on these relationships. Keywords: Error Vector Magnitude, Bit Error Rate, Signal to Noise Ratio.
1. INTRODUCTION
Error Vector Magnitude (EVM) is a performance metric for assessing the quality of communication. EVM expresses the difference between the expected complex voltage of a demodulated symbol and the value of the actual received symbol. Compared to the bit error rate (BER), which gives a simple one-to-one binary decision as to whether a bit is erroneous or not, EVM is more of a measure of errors between the measured symbols and expected symbols. Due to the simplicity of comparison, BER has been a major choice to engineers, industries and researchers [6, 5, and 7]. Often BER is synonymous as the other performance metrics, such as signal to noise ratio (SNR), since direct relationship exists between them. However, for BER measurement, it is incumbent that signal must be demodulated first at the receiver side. For many of today’s adaptive systems, viz. minimum bit error rate (MBER) based adaptive modulation systems etc., this means that for every update in the adaptive algorithm, it has to receive feedback from the receiver end [8]. In this paper, we show that for such systems, it is not always necessary to gather feedback from received end; rather EVM can give the desired performance metric before the demodulation can actually takes place. This can be done without
any major change of algorithm in adaptive systems, since BER is a direct consequence of EVM. The novelty in this paper lies in that the BER can be shown as a direct function of the EVM and as such in order to find equivalent performance metric, EVM can be often more useful. With the insurgence of high speed communication requirements, highly efficient multiplexing systems like orthogonal frequency division multiplexing (OFDM) as specified in [6] is becoming the hinge of future communication systems. OFDM is now being used in different carrier standards in Wireless Local Area Networks (WLANs) and also being considered as a potential fourth generation communication system. The IEEE802.11a-1999 specification describes a set of different schemes that are used in adaptive fashion: binary phase shift keying (BPSK), 4 quadrature amplitude modulation (4-QAM), 16 quadrature amplitude modulation (16-QAM), and 64 quadrature amplitude modulation (64-QAM) etc. The fact that pilots and training bits are always BPSK modulated, it is also possible to have more than one modulation scheme within a burst [7]. This requires that these modulation schemes are normalized to facilitate the calculation of EVM. In Section 2, BER and EVM will be separately derived from SNR and later EVM definition would be presented in terms of BER. In 3, theoretical and empirical observations would be shown through simulations showing the relation of EVM with BER. Finally, in Section 4, we extend discussions on these results and show future directions for such performance metric.
2.PERFORMANCEMETRIC:
BERANDEVM
A. Bit Error Rate
erroneous bits per bit transmitted. BER is a direct effect of channel noise for Gaussian noise channel models. For fading channels, BER performance of any communication system is worse and can be directly related to that of the Gaussian noise channel performance [4]. Considering M-ary modulation with coherent detection in Gaussian noise channel and perfect recovery of the carrier frequency and phase, it can be shown that [4]
− − = 0 2 2 2 2 1 log 3 log 1 1 2 N E L L Q L L P b
b , (2.1)
where L is the number of levels in each dimension of the M-ary modulation system, Eb
is the energy per bit and N0/2 is the noise power spectral density. Q [.] is the Gaussian co-error function and is given by [3]
( )
x e dyQ y x 2 2 2 1 −
∫
=απ
, (2.2)Assuming raised cosine pulses with sampling at data rate, Equation 2.1 also gives the bit error rate in terms of signal to noise ratio as
− − = M N E L L Q L L P s b 2 0 2 2 2 log 2 1 log 3 log 1 1 2 , (2.3)
where Es/N0 is the signal to noise ratio for the M-ary modulation system and raised cosine pulse shaping at data rate. Equation 2.3 defines the BER performance in terms on SNR and quite often used as main tool for many adaptive systems. For diversity and MBER systems, this equation essentially means that the choice is made in favour of bit error rate.
B. Error vector Magnitude
Error Vector Magnitude (EVM) measurements are often performed on vector signal analyzers (VSAs), real-time analyzers or other instruments that capture a time record and internally perform a Fast Fourier Transform
(FFT) to enable frequency domain analysis. Signals are down converted before EVM calculations are made [2]. Since different modulation systems viz. BPSK, 4-QAM, 16-QAM etc. have different amplitude levels, to calculated and compare EVM measurements effectively some normalization is typically carried out [7]. The normalization is derived such that the mean square amplitude of all possible symbols in the constellation of any modulation scheme is one. Thus, EVM is defined as the root-mean-square (RMS) value of the difference between a collection of measured symbols and ideal symbols. These differences are averaged over a given, typically large number of symbols and are often shown as a percent of the average power per symbols of the constellation. As such EVM can be mathematically given as [1]
∑
∑
= = − = N n n Nn n n
RMS S N S S N EVM 1 2 , 0 1 2 , 0 | | 1 | | 1
, (2.4)
where Sn is the normalized nth symbol in the
stream of measured symbols, S0,n is the ideal normalized constellation point of the nth symbol and N is the number of unique symbols in the constellation. The expression in Equation 2.4 cannot be replaced by their unnormalized value since the normalization constant for the measured constellation and the ideal constellation are not the same. The normalization scaling factor for ideal symbols is given by [7]
v
v P
T
T P A|= 1 =
| , (2.5)
where Pv is the total power of the measured
constellation of T symbols. For RMS voltage levels of inphase and quadrature components, VI
and VQ and for T >> N, it can be shown that Pv
can be expressed as
( )
( )
[
V V]
( )
WP T t t Q t I v
∑
= + = 1 2 , 2, , (2.6)
( )
( )
[
]
∑
= += N
n VI n VQ n N A 1 2 , 0 2 , 0 0 |
| , (2.7)
Hence Equation 2.4 can be further extended using normalization factors in Equations 2.5 and 2.7 as + − + − =
∑
∑
= = Tt t t
T
t t t t t
RMS Q I T Q Q I I T EVM 1 2 , 0 2 , 0 1 2 , 0 2 , 0 | | | | 1 | | | | 1 , (2.8)
where It = (VIt)|A| is the normalized in-phase voltage for measured symbols and I0,t = (VI0,t)|A0| is the normalized in-phase voltage for ideal symbols in the constellation, Qt = (VQt) |A| is the normalized quadrature voltage for measured symbols and Q0,t = (VQ0,t) |A0| is the normalized quadrature voltage for ideal symbols in the constellation. This is the definition which is now being used as the standard definition of the EVM in IEEE 802.11a − 1999TM [6, 5].
C. Relationship between EVM and BER
From Equation 2.8, it is evident that EVM is essentially the normalized error magnitude between the easured constellation and the ideal constellation. For Gaussian noise model, Equation 2.8 can be simplified in terms of noise in-phase component, nI,t and quadrature component, nQ,t as
+ =
∑
= 0 1 2 , 2 , | | | | 1 P n n T EVM Tt It Qt
RMS , (2.9)
where P0 is the power of the normalized ideal constellation or the transmitted constellation. The numerator of Equation 2.9 sets up the normalized noise power. However, for T >> N, the ratio of normalized noise power to the normalized power of ideal constellation can be replaced by their unnormalized quantities, i.e. the Equation 2.9 rewritten as
2 1 0 2 1 1 = ≈ S RMS E N SNR
EVM , (2.10)
In order to establish relationship between BER and EVM, SNR in Equation 2.10 can be expressed in terms of EVM as
2 1 EVM
SNR≈ , (2.11)
Combining Equations 2.11 and 2.3, we can now relate the bit error rate directly with the error vector magnitude as follows
− − ≈ M EVM L L Q L L P RMS b 2 2 2 2 2 log 2 1 log 3 log 1 1 2 (2.12) 3.SIMULATIONS
In this section, few simulations have been carried out to illustrate the relation established in Equation 2.12. For simulation purposes, the bits are gray coded and then M-ary modulated. Since, throughout this paper, we have assumed Gaussian noise model, no fading has been considered in the simulations. All simulations are carried out in Monte Carlo method with 106 packets each of the size of 1024 bits each. This stems from the fact that since 1024 >> M for any
0 5 10 15 20 25 30 10−4
10−3 10−2 10−1 100
SNR in dB
Bit Error Rate
Bit Error Rate Vs Signal to Noise Ratio
[image:4.612.104.288.71.248.2]BPSK 4−QAM 16−QAM 64−QAM BPSK(Theoritical) 4−QAM(Theoritical) 16−QAM(Theoritical) 64−QAM(Theoritical)
Fig. 1: Stylized BER versus SNR Performance Curves
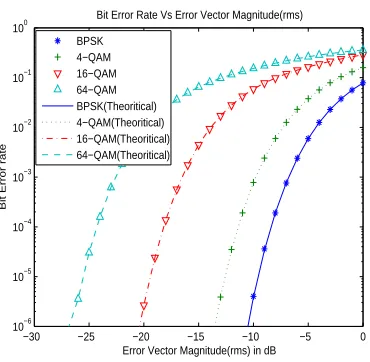
−30 −25 −20 −15 −10 −5 0
10−6 10−5 10−4 10−3 10−2 10−1 100
Bit Error Rate Vs Error Vector Magnitude(rms)
Error Vector Magnitude(rms) in dB
Bit Error rate
BPSK 4−QAM 16−QAM 64−QAM BPSK(Theoritical) 4−QAM(Theoritical) 16−QAM(Theoritical) 64−QAM(Theoritical)
Fig. 2: Stylized BER versus EVM Performance Curves
4.CONCLUSIONS
The relationship between the bit error rate and the rms value of the error vector magnitude found in Sec. I and the results from simulations in Sec. III illustrate the fact that RMS value of error vector magnitude is also a direct function of the bit error rate. Since error vector magnitude can be directly measured from the down converted signals using vector signal analyzers, it can save the extra calculations that may be required to find out the bit error rates. In many adaptive systems, this can also simplify the cost function calculation greatly. The authors are considering different fading environments and forward error correction coding systems, for
0 5 10 15 20 25 30 35 40
−45 −40 −35 −30 −25 −20 −15 −10 −5 0 5
SNR in dB
Error Vector Magnitude(rms) in dB
Error Vector Magnitude(rms) Vs Signal to Noise Ratio
[image:4.612.322.510.71.251.2]BPSK 4−QAM 16−QAM 64−QAM
Fig. 3: Stylized EVM versus BER Performance Curves
which a generalized function between error vector magnitude and bit error rate could be found out as an extension of present work.
REFERENCES
[1] S. Forestier, P. Bouysse, R. Quere, A. Mallet, J.M. Nebus, and L. Lapierre. “Joint optimization of the power-aided efficiency and error vector measurement of 20-GHz pHEMT amplifier through a new dynamic bias-control method”. IEEE Transactions on Microwave Theory and Techniques, vol.52(no.4):pp.1132–1140, Apr. 2004.
[2] K.M. Ghairabeh, K.G. Gard, and M.B. Steer. “Accurate Estimation of Digital Communication System Metrices - SNR, EVM and _ in a Nonlinear Amplifier Environment”. IEEE Transactions on Communications, pages pp.734–739, Sept. 2005. [3] Andrea Goldsmith. Wireless Communications.
Cambridge University Press, Stanford University, 1st edition edition, 2005.
[4] Lajos Hanzo, William Webb, and Thomas Keller.
Single- and Multi-Carrier Quadrature Amplitude Modulation. Wiley, Chichester, 2nd edition, 2000. [5] IEEE, IEEE Standard 802.11b-1999. IEEE Standard
for Wireless LAN Medium Access Control (MAC) and Physical Layer (PHY) Specifications: High Speed Physical Layer Extension in the 2.4GHz Band. [6] IEEE, IEEE Standard 802.11a-1999. IEEE Standard
for Wireless LAN Medium Access Control (MAC) and Physical Layer (PHY) Specifications: High Speed Physical Layer in the 5GHz Band.
[image:4.612.104.289.280.461.2][8] S.J. Yi, C.C. Tsimenidis, O.R. Hinton, and B.S. Sharif. “Adaptive minimum bit error rate multi-user detection for asynchronous MC-CDMA systems frequency selective Rayleigh fading channels”. 14th
IEEE 2003 International Symposium on Personal, Indoor and Mobile Radio Communications. Proceedings (IEEE Cat. No.03TH8677), vol.2:pp.902–906, Apr. 2004.