AUTUMN STATEMENT 2014
AUTUMN STATEMENT 2014
Presented to Parliament by
the Chancellor of the Exchequer
by Command of Her Majesty
December 2014
© Crown copyright 2014
You may re-use this information (excluding logos) free of charge in any format or medium, under the terms of the Open Government Licence v.2. To view this licence visit www.nationalarchives.gov.uk/doc/open-government-licence/version/2/ or email [email protected] Where third party material has been identified, permission from the respective copyright holder must be sought.
This publication is available at www.gov.uk/government/publications Any enquiries regarding this publication should be sent to us at [email protected]
Print ISBN 9781474112055 Web ISBN 9781474112062 PU1702
Printed in the UK by the Williams Lea Group on behalf of the Controller of Her Majesty’s Stationery Office
ID 07111411 12/14
Contents
Page
Executive Summary 5
Chapter 1 Autumn Statement
The UK economy and public finances 11
Growth 35
Fairness 52
Chapter 2 Autumn Statement policy decisions 63
Annex A Financing 93
Annex B Office for Budget Responsibility’s Economic and fiscal outlook:
selected tables 97
List of abbreviations 105
List of charts 108
Executive Summary
This Autumn Statement sets out the next stage of the government’s long-term economic plan. The government is continuing to take difficult decisions to put the public finances on a sustainable path. The Autumn Statement seeks to improve the UK’s productivity with further measures to drive efficiency and reform in the public sector, to back business and enterprise, to invest in infrastructure, and to build a northern powerhouse. The Autumn Statement sets out a radical reform of stamp duty land tax (SDLT) to improve the functioning of the housing market, a further increase in the Income Tax personal allowance to support working families, and further steps to reduce tax evasion and avoidance.
The UK entered the Great Recession with the largest structural deficit of any major economy, and the government inherited the largest deficit in post-war history. Unchecked, the historically high level of borrowing could have undermined fairness, growth and economic stability in the UK. Through this period of uncertainty, the government’s long-term economic plan has delivered stability and security. The result is that the UK currently has the fastest growth among G7
economies, there are more people in work than ever before, and the deficit is forecast to have fallen by a half by the end of 2014-15.
However the job is not yet done. The deficit remains high and productivity is too low. External risks have increased, and the UK is not immune from the problems being experienced in Europe and other parts of the global economy. The government will continue to take the difficult decisions needed to secure a responsible recovery and to stay on course to prosperity. The government’s goal is a stronger economy in a fairer society.
This Autumn Statement sets out further details on how the government will continue to repair the public finances and improve productivity growth:
The UK economy and public finances:
UK GDP exceeded its pre-crisis peak in the third quarter of 2013, and the UK economic recovery is now well established. The deficit is forecast to have fallen by a half by the end of 2014-15, and to reach a small surplus in 2018-19. The government is forecast to meet its fiscal mandate two years early in 2017-18. The Office for Budget Responsibility (OBR) has confirmed that the government is meeting the welfare cap. Autumn Statement 2014 announces further detail on the difficult decisions needed to reduce the deficit and debt beyond this Parliament.Fairness:
This Autumn Statement includes a radical reform to residential SDLT that will reduce distortions to the housing market and improve the fairness of the tax system. The personal allowance will be increased by another £100 to £10,600 in 2015-16, so that it pays to work, with full gains for higher rate taxpayers. The measures taken so far this Parliament to tackle aggressive tax planning, avoidance and evasion add up to £7.6 billion in additional revenues in 2015-16. The government is also announcing further action to tackle tax avoidance, and to ensure that all businesses and individuals pay their fair share.The UK economy and public finances
The government’s long‑term economic plan has restored fiscal credibility, allowing activist monetary policy to support the economy. This has been supported by far‑reaching reform of the financial system and a comprehensive package of structural reforms. As the recovery has become established, growth has been broadly balanced across sectors, and early indicators suggest that it is also becoming more balanced across the UK. However, external risks facing the UK have increased since Budget 2014, and the largest external risk to the UK is the deteriorating outlook in the euro area. The OBR has revised down its forecast for world GDP growth in all years of the forecast.
Employment is at a record high of 30.8 million, up 1.7 million since the government came into office, and more than 1 million above its pre-recession peak. Since 2010, employment has increased faster in the UK than in any other G7 country, and the working-age labour market participation rate has risen to levels last seen over 20 years ago.
Latest earnings figures show the first signs that pay growth is strengthening: regular pay for the 3 months to September grew at 1.3%, with regular pay for September itself 1.8% higher than a year ago, above the rate of inflation over this period. Downward pressure on inflation in the last year has been driven by falling prices of food and fuels, with global oil prices having fallen to less than $80 a barrel. Lower food and fuel prices are good news for households, reducing the cost of living and helping to make families feel more financially secure. Real household disposable income per capita grew by 2% over the last quarter, and the OBR forecasts that it will continue to strengthen in every year of the forecast. The average rate of GDP per capita growth per quarter since the beginning of this Parliament has been higher than the period covering the previous two Parliaments. The only sustainable way to raise living standards is to continue to support employment, to increase productivity, and to keep inflation under control.
Tax receipts have not grown as strongly as the economy in recent months. This reflects a number of factors, including slower than expected growth in Income Tax receipts, and carried-forward financial sector losses and declining North Sea oil revenues lowering Corporation Tax receipts. The impact on the public finances has largely been offset by lower than expected spending, including lower debt interest payments, and as a result of lower unemployment over the period.
Economic forecast
UK GDP grew 3.0% in the third quarter of 2014 compared to a year ago. The OBR has revised up its forecast for UK growth in 2014 from 2.7% to 3.0% and in 2015 from 2.3% to 2.4%. The OBR forecasts growth of 2.2% in 2016, 2.4% in 2017, 2.3% in 2018 and 2.3% in 2019.
The OBR has revised down its forecast for unemployment in all years to 2018, and expects a rate of 6.2% in 2014, falling to 5.3% at the end of the forecast period.
Fiscal forecast
The OBR forecasts that the government remains on course to meet the fiscal mandate 2 years early. The deficit continues to fall each year. From its post-war peak of 10.2% of GDP in 2009-10, public sector net borrowing is forecast to be halved this year to 5.0%; to fall to 4.0% of GDP in 2015-16, the final year for which the government has set departmental spending plans; and to reach a small surplus of 0.2% of GDP in 2018-19 and 1.0% of GDP in 2019-20. Government borrowing from 2016-17 onwards is lower than forecast at Budget 2014 on a like-for-like basis, and the structural deficit is broadly unchanged.
Public sector net debt is forecast to peak at 81.1% of GDP in 2015-16, lower than forecast at Budget 2014 on a like-for-like basis, before falling each year and reaching 72.8% of GDP in 2019-20.
The government’s response
While the strengthening economy and the positive steps towards full employment are welcome signs of progress, the continuing structural deficit confirms the government’s view that the UK is not immune from the problems being experienced in the Eurozone and other parts of the global economy. Abandoning the government’s long-term economic plan and the path of fiscal credibility would represent the most significant risk to the recovery.
Reflecting this ongoing commitment to responsible fiscal policy and returning the public finances to a sustainable position, the government is delivering a small fiscal tightening at the Autumn Statement and reaffirming its commitment to its path of fiscal consolidation. The government is:
•
committing to a further £10 billion of efficiency savings•
revising the Charter for Budget Responsibility, which will be laid before Parliament the week after Autumn Statement 2014 with a motion for approval•
taking further action to ensure that the full costs of providing pensions for public service workers are met by employers•
strengthening the Scottish Government’s existing powers to deliver jobs, growth and fairness by devolving further powers over tax and welfare, as set out by Lord Smith•
prioritising investment in the future of the NHS through a multi-year £3.1 billion UK-wide investment, including funding for frontline patient care, advanced care in GP-led services, and mental health servicesThe first section of Chapter 1 sets out the government’s economic and fiscal plans in more detail.
Growth
Autumn Statement 2014 sets out a comprehensive package to address historically weak UK productivity and to create the right conditions for continued, balanced growth across all sectors and regions. This is part of the government’s long-term economic plan to secure a sustained recovery and a more resilient economy.
•
setting out long-term public and private sector investment plans for infrastructure, including £15 billion investment in the road network and a programme of 1,400 flood defence schemes•
committing to the largest sustained investment in Britain’s science base, including establishing a £2.9 billion Grand Challenges fund to enable the UK to invest in major research facilities•
rebalancing the economy and ensuring strong regional growth by building a northern powerhouse, with major investment in the roads of northern England, new rail franchises, and the Sir Henry Royce Institute for advanced materials research and innovation; and by taking forward city deals and local growth deals, with support from the Regional Growth Fund•
making progress towards full employment, including by abolishing employer National Insurance contributions on earnings up to the upper earnings limit for apprentices aged under 25•
creating a more highly-skilled labour market, including through a new offer of loans for those wishing to undertake postgraduate study – building on the government’s lifting of the cap on undergraduate student numbersThe second section of Chapter 1 sets out further detail on these and other announcements.
Fairness
The government’s long-term economic plan is underpinned by a firm commitment to support those who want to work hard and get on. The government is:
•
introducing a radical reform of SDLT to reduce distortions and improve the functioning of the housing market, which increases the fairness of the tax system by ensuring SDLT will be cut for 98% of people who pay it•
boosting incomes through a further £100 increase to the Income Tax personal allowance in 2015-16, with full gains passed on to higher rate taxpayers so that the higher rate threshold for 2015-16 increases in line with inflation for the first time in 5 years; this means that the personal allowance will now rise by £600 in April 2015 to £10,600•
allowing the tax advantages of married ISA savers to be inherited by a surviving spouse or civil partner on the death of the ISA holder•
reducing travel costs for families by exempting children flying economy from Air Passenger Duty: under-12s from 1 May 2015, and under-16s from 1 March 2016•
taking further action to tackle tax avoidance, and to ensure that all businesses andindividuals pay their fair share, including by restricting the amount of banks’ profits that can be offset by carried-forward losses
The third section of Chapter 1 sets out further information on these and other announcements. Further information on the distributional impact of this Autumn Statement is available in ‘Impact on households: distributional analysis to accompany Autumn Statement 2014’.
Chapter 2 sets out all measures announced in this Autumn Statement.
Annex A presents financing information.
Autumn Statement decisions
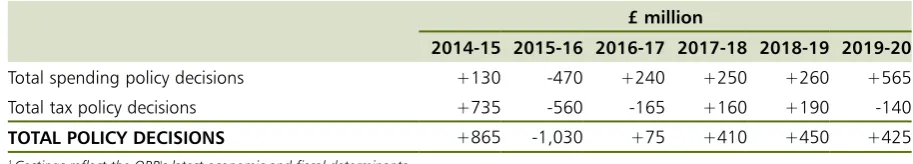
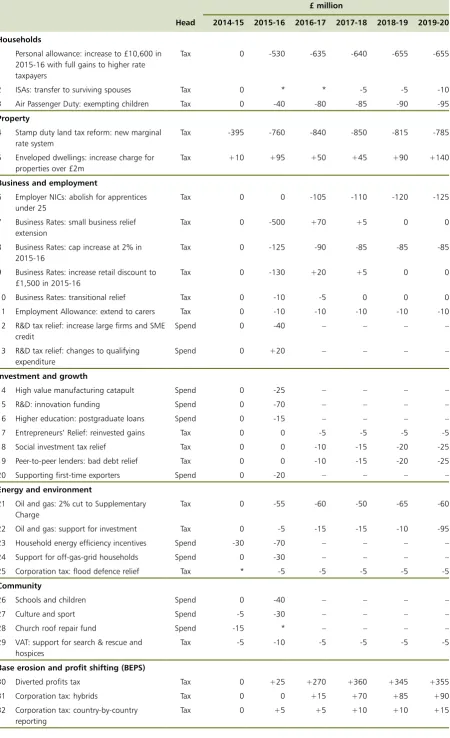
[image:9.595.67.524.121.203.2]A summary of the fiscal impact of Autumn Statement policy decisions is set out in Table 1. Chapter 2 provides further information on the fiscal impact of the Autumn Statement.
Table 1: Summary of Autumn Statement policy decisions1
£ million
2014-15 2015-16 2016-17 2017-18 2018-19 2019-20
Total spending policy decisions +130 -470 +240 +250 +260 +565 Total tax policy decisions +735 -560 -165 +160 +190 -140
TOTAL POLICY DECISIONS +865 -1,030 +75 +410 +450 +425
1
Autumn Statement
The UK economy and public finances
1.1 In 2008 the UK entered the Great Recession with the largest structural deficit of any major economy. In 2010 the government inherited the largest deficit since the Second World War. Through this period of uncertainty, the government’s long-term economic plan has laid the foundations for the UK’s economic recovery and delivered stability and security. The UK currently has the fastest growth among the G7 economies, there are more people in work than ever before and the deficit is forecast to fall by a half in 2014-15. However, the job is not yet done. The deficit remains high and productivity too low. In addition external risks have increased and the UK is not immune to the problems being experienced in Europe and other parts of the world economy. The government will go on taking the difficult decisions needed to secure a responsible recovery and stay on course to prosperity. The government’s goal is to build a stronger economy in a fairer society that provides opportunity for all. This Autumn Statement sets out further details on how the government will repair the public finances and improve productivity growth.
UK economy since 2010
1.2 The government’s long‑term economic plan has restored fiscal credibility, allowing activist monetary policy and the automatic fiscal stabilisers to support the economy. This has been supported by far‑reaching reform of the financial system and a comprehensive package of structural reforms.
1.3 The UK economic recovery is now well established and growth is broadly based across sectors. UK GDP grew by 3.0% in the third quarter of 2014 compared to the same quarter a year earlier.1 All 4 major sectors of the economy grew in the third quarter of 2014 and services,
manufacturing and construction each grew by 3.0% or more. Historical revisions to the National Accounts show UK GDP exceeded its pre-crisis peak in the third quarter of 2013, 9 months earlier than previously estimated.2 Box 1.A explains the impact of revisions to the National
Accounts.
1.4 As a result of these revisions, UK GDP growth since the financial crisis now looks stronger compared to other advanced economies with the third fastest growth in the G7 since 2010.3 The
UK is currently the fastest growing economy in the G7 and, in the International Monetary Fund’s (IMF) latest ‘World Economic Outlook’, the UK is forecast to have the fastest growth among advanced economies over 2014 as a whole.4
1 All UK economy data from Office for National Statistics (ONS) unless otherwise stated. Further detail can be found in ‘Autumn Statement 2014 Data Sources’.
2 More detail on revisions to the National Accounts can be found in ‘Quarterly National Accounts, Q2 2014’, ONS, September 2014.
3 ‘Quarterly National Accounts: Quarterly Growth Rates of Real GDP, change over previous quarter’, Organisation for Economic Co-operation and Development (OECD), November 2014.
Box 1.A: 2014 Blue Book changes
The Office for National Statistics (ONS) published revised National Accounts statistics in September in the 2014 Blue Book.3 There have been a large number of changes to
the National Accounts, including updates to align UK economic statistics with the latest international guidelines, the European System of Accounts 2010 (ESA10). There were also changes to ensure that estimates were consistent with previous international best practices (ESA95), as well as improvements to ensure the data are in line with the Balance of Payments and International Investment Positions Manual 6.
The changes introduced a measurement of illegal activities in data for GDP to ensure greater consistency across European member states, ensured research and development is now counted as investment rather than intermediate consumption, and included changes to measures of gross fixed capital formation. The changes also included improvements to the measurement of the non-profit institutions serving households sector, which incorporates charities.
The latest data show GDP growth has been more robust over this Parliament than previously thought, expanding by 8.1% between Q1 2010 and Q2 2014, compared to 7.0% over the same period under the previous approach.
The historical revisions have also had an effect on the balance of the recovery. Under previous data the level of business investment and dwellings investment in Q1 2014 remained a long way below its pre-crisis level in Q1 2008, at 15.5% and 24.6% below respectively. In the latest data business investment in 2014 Q1 was 4.5% above the pre-crisis level and dwellings investment was also revised upwards. The contribution from government was revised up slightly, but contributions from stock building and net exports were both revised down.
Chart 1.1: International comparison of GDP
Source: Organisation for Economic Co-operation and Development.
GDP, level indexed to 100 at 2010 Q1
Canada France Germany Italy
Japan UK US
85 90 95 100 105 110 115
2014 2013
2012 2011
2010 2009
2008
1.5 In recent years, the effect of the financial crisis, high global commodity prices and euro area economic uncertainty were the main causes of lower than expected economic growth, especially in 2011 and 2012. The Office for Budget Responsibility (OBR) October 2013 ‘Forecast evaluation report’ confirmed its previous conclusion that fiscal policy “does not look the most obvious explanation for the bulk of the shortfall” in growth compared to their 2010 forecast.6
Employment, earnings and productivity
1.6 Employment is at a record high of 30.8 million, up 1.7 million since the government came into office and more than 1 million above its pre-recession peak. The employment rate (73.0%) has returned to its pre-recession level and since Q1 2010 employment has increased faster in the UK than in any other country in the G7.7
Chart 1.2: International comparison of employment
Source: Organisation for Economic Co-operation and Development.
Canada France Germany Italy
Japan UK US
Employment (age 15 and over), level indexed to 100 at 2010 Q1
96 98 100 102 104 106 108
2014 2013
2012 2011
2010 2009
2008
1.7 The overall growth in employment reflects increases in both self-employment and the number of employees. Self-employment has been increasing steadily as a proportion of total employment over the last 14 years, from 11.7% in the 3 months to December 2000 to 14.7% in the 3 months to September 2014. Recent ONS analysis shows the rise in self-employment since 2008 primarily reflects fewer people leaving self-employment, with an increase in those who have been self-employed for 20 years or more.8 This suggests ongoing structural change in the labour
market, rather than people becoming self-employed because they cannot find other work.
6 ‘Forecast evaluation report’, OBR, October 2013.
Chart 1.3: Self-employment as a percentage of total employment
10 11 12 13 14 15 16
2001 2002
2000 2003 2004 2005 2006 2007 2008 2009 2010 2011 2012 2013 2014
Source: Office for National Statistics, Labour Force Survey.
% of total employment
0 200 400 600 800 1,000 1,200
20 years or more 10 years but
less than 20 5 years but
less than 10 2 years but
less than 5 1 year but
less than 2 6 months but
less than 12 3 months but
less than 6 Less than
3 months
Chart 1.4: Self-employed by length of time self-employed
Thousands, data for months January to March
2006 2008 2010 2012 2014
1.8 The composition of the workforce in the UK is changing, with more people continuing to enter the labour force over the last year and a greater proportion of older people staying in employment. 85% of the increase in employment over the last year has been in full-time work and 75% since Q1 2010.
1.9 The latest data for the 3 months to September shows employment for those aged over 50 increased by 300,000 over the past year. Youth unemployment is also falling, with an annual fall of 244,000 in the 3 months to September and falls in recent months the largest on record. A reduction of long-term unemployment, which is down 206,000 over the same period, is also helping to drive recent falls in overall unemployment. As a result, the working-age labour market participation rate has risen to levels last seen in the early 1990s.
Earnings and incomes
1.10 Latest earnings figures are showing the first signs that pay growth is strengthening. Regular pay for the 3 months to September grew at 1.3%, with regular pay for September itself 1.8% higher than a year ago, above the rate of inflation over this period (1.2%). The OBR forecasts real terms growth in average earnings in 2014 and all years of the forecast.9
1.11 Average earnings figures can be affected by changes to the level and composition of employment. As the ONS ‘Annual Survey of Hours and Earnings’ (ASHE) data showed, those in continuous employment for the past year saw wage growth of 4.1%.10 Chart 1.5 shows overall
wage growth for full-time employees and that for those in continuous employment wage growth has exceeded CPI for the last 3 years.
Chart 1.5: Growth in median full-time gross weekly earnings for all employees and those in continuous employment
Source: Office for National Statistics, Annual Survey of Hours and Earnings.
% change on a year earlier
2006 2007 2008 2009 2010 2011 2012 2013 2014
0 1 2 3 4 5 6 7
All employees Continuous employment CPI inflation
1.12 As more people enter employment, the composition of the labour market can change. Many new entrants to the labour market will be young people making their first step onto the career ladder before gaining expertise and earning more as they progress in the workplace. On average weekly earnings for young people working full-time are 56% of the overall average, as
more young people move into employment this will have a dampening effect on the average for overall wage growth, even though their incomes are boosted by moving into work.11
1.13 The National Minimum Wage provides important support to those on lower earnings. The government’s decision to accept the Low Pay Commission’s recommendation of an above inflation increase means that over a million people saw their pay rise from 1 October 2014.12
This was the first real-terms rise since 2007, with the largest cash increase in the adult National Minimum Wage since 2008 to £6.50 per hour.
1.14 CPI inflation was 1.3% in October, its tenth consecutive month below the Bank of England’s 2.0% target. Downward pressure on inflation over the past year has been driven by falling prices of food and fuels. Food prices have fallen by 1.6% in the last year, while motor fuel prices fell to their lowest level since December 2010. This benefits households, reducing the cost of living and helping to make families feel more financially secure.
1.15 Real household disposable income (RHDI) per capita is the most comprehensive measure of living standards, used by the ONS and others, as it takes into account employment levels, the effects of tax and benefits, as well as inflation measured by CPI. RHDI per capita is increasing, growing by 2.0% over the last quarter and by 0.4% over the past year. The OBR forecasts that RHDI per capita will grow by 1.6% in 2014 and 1.2% in 2015.
1.16 For the latest data in Q2 2014, GDP per capita is now 4.9% higher than it was in Q1 2010. The average rate of GDP per capita growth per quarter since the beginning of this Parliament has been higher than the period covering the previous two Parliaments. The OBR forecast GDP per capita to grow by 2.4% in 2014, and 1.8% in 2015, reflecting the economic recovery.
Productivity
1.17 Productivity growth is the main factor determining average living standards, as it is closely related to the reward that workers receive for the work they provide. Autumn Statement 2013 analysis made clear there has not been a break in the long-run relationship between productivity and total compensation, which takes into account both earnings and employer social contributions such as pensions. Increases in productivity should therefore feed through into higher earnings growth.
1.18 Factors related to the nature of the financial crisis are likely to be having a persistent impact on the level of productivity. Latest data are more positive and imply productivity grew by 0.6% per hour and 0.3% per worker in Q3 2014.13 The OBR forecasts productivity per hour
growth will turn positive this year, strengthening to 2.5% in 2017.
1.19 The UK had a history of poor productivity growth through most of the 20th century, largely
characterised by relative decline, with the US, Germany, France and others improving their productivity faster than the UK. The major supply side reforms of the 1980s and 1990s including strengthened competition, liberalised trade, labour market flexibility, the removal of subsidies for failing companies and privatisation drove improvement in UK productivity. Since the 2008 peak, however, GDP has risen by 3.4% but employment has increased by 3.7% meaning that output per worker is still below the pre-crisis peak. The Bank of England has assessed that there “may be several factors associated with the financial crisis that may have led to the more persistent weakness in productivity, such as lower investment in both physical and intangible capital. Barriers or impediments to the efficient allocation of both capital and labour towards their more productive uses are also likely to have played a role. And it is possible that a number of factors
11 ‘ASHE’, ONS, November 2014. Median gross weekly earnings for 18-21 year olds working full-time compared to the median gross weekly earnings of all full-time employees.
12 ‘National Minimum Wage: Low Pay Commission Report 2014’, March 2014.
have helped less productive firms survive the recession. All of these factors are likely to have dampened aggregate productivity growth in recent years”.14
1.20 A pre-requisite for stronger productivity growth is a comprehensive, credible and flexible economic framework. This provides the right platform for improved productivity. Autumn Statement 2014 sets out a comprehensive package to boost productivity and deliver higher real wages, better living standards and increased tax receipts in the longer term.
UK rebalancing, investment and trade
1.21 During the pre-crisis period weaknesses developed in the UK economy including low levels of investment and regional imbalances. As the recovery has become established, growth has been balanced across all main sectors. Business investment is a significant factor driving the recovery. Business investment in Q3 2014 was 6.1% above the peak in Q2 2008 and has increased by 26.6% since Q1 2010. Chart 1.6 shows business investment over the recession and recovery before and after Blue Book 2014.
Chart 1.6: Revisions to business investment over the recession and the recovery before and after Blue Book 2014
Source: Office for National Statistics.
Business investment, level indexed to 100 at 2008 Q1
2008 2009 2010 2011 2012 2013 2014
60 70 80 90 100 110 120
Before Blue Book 2014 After Blue Book 2014
1.22 There are indications that growth is becoming more balanced across the regions. In the 3 months to September 2014 employment in northern English regions increased 2.6% on the year, compared to a 2.3% rise in the UK as a whole. Autumn Statement 2014 sets out further actions to rebalance the economy and to build a northern powerhouse.
1.23 The UK is one of the most open economies in the world, with significant trade and financial links with other countries. UK exports performance is highly dependent on the economic performance of the euro area, the UK’s largest trading partner, and weak euro area growth has meant goods exports to EU countries have been subdued. However, UK exporters have continued to expand in other markets. Since Q1 2010 the volume of goods exports to non-EU countries has increased by 18.7%.
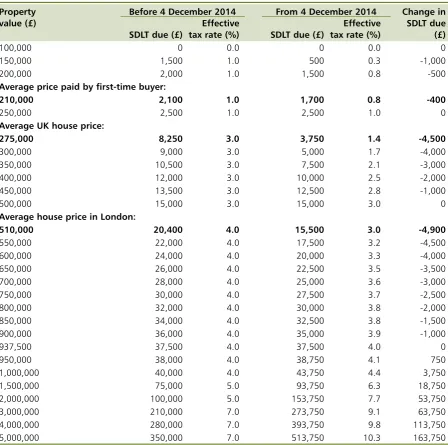
1.24 Having fallen sharply during the crisis, house prices grew at 12.1% in the year to September, but remain below their peak in real terms. House prices have been particularly driven by rises in London. However, excluding London and the South East, prices grew by 9.1% in the year to September. Despite property transactions being almost double their 2009 low, they remain below their long-run average and have slowed to some degree recently. There are further signs of normalisation in the housing market with other indicators suggesting continued increases in house building. Housing starts were up by 16% in the year to September 2014, compared with the previous year, which should support long-term sustainability in the housing market.15 Autumn Statement 2014 announces reforms to Stamp Duty Land Tax (SDLT) which will
reduce distortions in the housing market and ensure that SDLT will be cut for 98% of people who pay it.
Global developments and risks
1.25 A sustained improvement in productivity growth is critical to delivering the OBR’s forecast for the economy. Abandoning the government’s long-term economic plan and the path of fiscal credibility would represent the most significant risk to the recovery. Since Budget 2014 external risks facing the UK have increased and the UK is not immune to the problems being experienced in Europe and other parts of the world economy. As the IMF said in their October ‘World
Economic Outlook’, “world growth is mediocre”.16 The OBR has revised down its forecast for
world GDP growth in all years of the forecast.
1.26 The largest external risk to the UK is the deteriorating outlook in the euro area. Growth in the euro area decreased to 0.1% in Q2 2014 and was 0.2% in Q3 2014, inflation was very low at 0.3% in November 2014, and unemployment remained very high at 11.5% in October 2014. Both the IMF and the European Commission forecast weak but positive growth, but downside risks have increased.17 The IMF has estimated that the probability of recession in the euro area is
almost 40%, and the probability of outright deflation is about 30%.18 As the UK’s largest export
destination, a slowdown in the euro area poses direct risks to the UK via the trade channel and also indirectly through market confidence.
1.27 The US economy has continued to recover and growth was 2.4% in the year to Q3, with unemployment rates continuing to fall and private investment beginning to pick up. Despite the Bank of Japan’s quantitative easing programme beginning to pull Japan out of deflation, it has fallen back into recession. The situation in emerging markets is mixed, with lower rates of potential growth being a key risk. After weakening to 4.7% in 2013 from 5.0% a year earlier, growth in emerging and developing economies is projected, by the IMF, to continue to fall to 4.4% in 2014 before rising to 5.0% in 2015.19 Growth in China continues to moderate but
at a level above 7% on an annual basis. The situation in India is also improving, with growth beginning to pick up. Some other emerging markets with external financing concerns are potentially exposed to an increase in global interest rates.
1.28 Geopolitical risks have increased with the conflicts in the Middle East, the Ukrainian crisis, and the spread of Ebola virus disease in West Africa. The direct economic impact of each one in isolation is uncertain. However, given any significant deterioration the combination of risks has the potential to produce a larger indirect impact via negative market sentiment and confidence.
15 ‘House Building: September Quarter 2014, England’, Department for Communities and Local Government, November 2014.
16 ‘World Economic Outlook’, IMF, October 2014.
17 ‘World Economic Outlook’, IMF, October 2014; ‘Autumn 2014 European Economic Forecast’, European Commission, November 2014.
Economic outlook
Table 1.1: Summary of the OBR’s central economic forecast1
Percentage change on a year earlier, unless otherwise stated Forecast
2013 2014 2015 2016 2017 2018 2019
GDP growth 1.7 3.0 2.4 2.2 2.4 2.3 2.3
Main components of GDP
Household consumption2 1.6 2.3 2.8 2.2 2.4 2.3 2.4
General government consumption 0.7 1.1 -0.4 -0.8 -0.9 -0.3 0.0
Fixed investment 3.2 8.1 8.4 5.9 5.6 5.2 4.8
Business 4.8 7.7 8.4 6.3 6.3 6.3 6.3
General government3 -7.3 2.1 3.3 1.6 2.2 1.6 2.3
Private dwellings3 6.1 13.0 11.0 7.0 5.5 4.0 2.4
Change in inventories4 0.3 0.3 -0.2 0.0 0.0 0.0 0.0
Net trade4 0.0 -0.2 -0.5 -0.1 -0.1 -0.1 -0.2
CPI inflation 2.6 1.5 1.2 1.7 2.0 2.0 2.0
Employment (millions) 30.0 30.7 31.2 31.4 31.5 31.6 31.7
ILO unemployment (% rate)5 7.6 6.2 5.4 5.2 5.3 5.3 5.3
1 All figures in this table are rounded to the nearest decimal place. This is not intended to convey a degree of unwarranted accuracy. Components may
not sum to total due to rounding and statistical discrepancy.
2 Includes households and non-profit institutions serving households. 3 Includes transfer costs of non-produced assets.
4 Contributions to GDP growth, percentage points. 5 International Labour Organization.
Source:Office for Budget Responsibility, Office for National Statistics.
1.29 The OBR has revised up its forecast for UK growth in 2014 from 2.7% to 3.0% and in 2015 from 2.3% to 2.4%. The OBR forecasts growth of 2.2% in 2016, 2.4% in 2017, 2.3% in 2018 and 2.3% in 2019. The OBR has revised down its forecast for unemployment in all years to 2018, and expects a rate of 6.2% in 2014, falling to 5.3% at the end of the forecast period.
1.30 The output gap represents the amount of spare capacity in the economy. Growth in GDP this year has been higher than expected and unemployment and slack in the economy has reduced more quickly than expected, causing the output gap to be narrower at the start of the forecast period than expected at the time of Budget 2014. The OBR expects the output gap to remain broadly stable through 2016, gradually closing from 2017 as growth picks up.
1.31 The OBR forecasts business investment growth of 7.7% in 2014 and 8.4% in 2015. The OBR also expects private dwelling investment to grow strongly at 13.0% in 2014 and 11.0% in 2015. The OBR forecasts exports growth of 2.4% in 2015, 4.7% in 2016 and 4.9% in 2017. The OBR expects export growth from 2016 to be broadly offset by imports growth, with net trade expected to make a small negative contribution to growth through the forecast period.
The government’s plan
1.33 The government’s long-term economic plan builds a stronger, more competitive economy, a fairer society, and secures a better future for Britain by:
•
reducing the deficit to deal with the UK’s debt, safeguard the UK economy for the long term and keep mortgage rates low•
cutting income taxes and freezing fuel duty to help hardworking people be more financially secure•
creating more jobs by backing small business and enterprise with better infrastructure, lower job taxes and a long-term industrial strategy•
capping welfare and controlling immigration so the economy delivers for people who want to work hard and play by the rules•
delivering the best schools, skills and apprenticeships for young people so the next generation can succeed in the global race1.34 In order to safeguard the economy for the long term, the government is continuing to take decisive action through: monetary activism and credit easing, deficit reduction, reform of the financial sector, and a comprehensive package of structural reforms.
Monetary policy
1.35 Monetary policy has a critical role to play in supporting the economy as the government delivers on its commitment for necessary fiscal consolidation. The government has ensured that monetary policy can continue to play that role fully by updating the UK’s monetary policy framework and remit for the Monetary Policy Committee (MPC) at Budget 2013. The MPC has full operational independence to set policy to meet the inflation target – 2% as measured by the 12-month increase in the CPI. CPI inflation has been at or below target since the end of 2013.
1.36 At its November meeting, the MPC voted 7 to 2 in favour of maintaining Bank Rate at 0.5%, and unanimously in favour of maintaining the stock of asset purchases financed by the issuance of central bank reserves at £375 billion.20 The MPC has provided guidance that when
Bank Rate did begin to rise, it was expected to do so only gradually and that Bank Rate was expected to remain below average historical levels for some time to come.21
Credit easing
1.37 The Funding for Lending Scheme (FLS) has played a crucial role in reducing bank funding costs and incentivising lending, in turn easing credit conditions for businesses. Participants in the scheme have drawn £47.6 billion of funding to support new lending.22 During the extension to
the scheme in 2014, which was focused on business lending, FLS participants have generated additional borrowing allowances of £7.5 billion, mainly through increases in net lending to small and medium-sized enterprises (SMEs).23 Against this backdrop, credit conditions continue
to improve for businesses of all sizes, including SMEs. Gross lending to businesses increased by 19% in the 12 months to October 2014 against the previous 12-month period.24 Conditions for
large businesses have particularly improved, with respondents to the Q3 Deloitte CFO survey reporting that credit is cheaper and more available than any time in the last 7 years.25
20 ‘Minutes of the Monetary Policy Committee meeting 5 and 6 November 2014’, Bank of England, November 2014. 21 ‘Minutes of the Monetary Policy Committee meeting 5 and 6 November 2014’, Bank of England, November 2014. 22 ‘Funding for Lending Scheme usage and lending data publication – Q3 2014’, Bank of England, November 2014. 23 ‘Funding for Lending Scheme usage and lending data publication – Q3 2014’, Bank of England, November 2014. 24 ‘Money and Credit – October 2014’, Bank of England, December 2014.
1.38 Given uncertainties in the global economy, and the risk of shocks that might impact on credit conditions and jeopardise the recovery, the Treasury and the Bank of England announced on 2 December that the FLS will be extended for 1 year, until 29 January 2016. Unused borrowing allowances from the scheme as of 31 January 2015 will continue to be available for drawdown in this period.26 The FLS will be further focused on incentivising
lending where it is most required, for SMEs, and is being further tapered to remove lending to large businesses. Additional borrowing allowances in 2015 will be generated through net lending to SMEs, with participants able to draw £5 of funding for each £1 of net lending to SMEs. The FLS will complement various other initiatives in train to support credit to SMEs, including programmes by the British Business Bank to make finance markets work better for SMEs, and the government’s proposals in the Small Business, Enterprise and Employment Bill to improve access to SME credit information. Autumn Statement 2014 announces an extension of the Enterprise Finance Guarantee and an expansion of Enterprise Capital Funds. Funding for these 2 major British Business Bank schemes will unlock up to £1 billion of finance for smaller businesses.
Deficit reduction
Fiscal strategy
1.39 The government inherited the largest deficit in post-war history due to the Great Recession and unsustainable pre-crisis increases in public spending.27 The IMF estimates that the UK
entered the Great Recession with the largest cyclically-adjusted deficit in the G7, at 5.3% of GDP in 2007.28 Unchecked, the historically high level of borrowing could have undermined fairness,
growth and economic stability in the UK. In 2010, the government set out medium-term fiscal consolidation plans to return the public finances to a sustainable path.
1.40 The government is making significant progress in delivering its fiscal consolidation. Public sector net borrowing as a percentage of GDP has fallen by more than a third since 2009-10 and is forecast to have fallen by half by the end of 2014-15.29 Latest IMF outturn data show
that between 2010 and 2013, the government reduced the structural deficit by more than half. The structural deficit fell by 4.6% of GDP over this period, a larger absolute reduction than any other country in the G7.30 The government is forecast to meet its fiscal mandate 2 years early in
2017-18, having reduced the cyclically-adjusted current budget deficit from its peak of 4.7% of GDP in 2009-10 to 2.6% of GDP in 2013-14, and public sector net borrowing reaches a small surplus in 2018-19. On a comparable basis, public sector net debt is forecast to peak in 2015-16 at a lower level than at Budget 2014.
1.41 The OBR forecasts that tax receipts will continue to rise across the forecast period but this year are growing by less than the economy. As the economy has grown, more people are benefitting from the increase in the personal allowance, which is supporting people into work, taking the lowest earners out of tax altogether and reducing the tax paid by millions of taxpayers. Receipts are also growing less quickly than the economy in the near term due to further falls in revenues from North Sea oil and gas, in part reflecting recent declines in global oil and gas prices, and financial institutions carrying forward losses. To address these challenges, the government is announcing a package of further measures at Autumn Statement to maximise the benefit of North Sea oil and gas to the economy and restrict the amount of banks’ annual profits that can be offset by carried-forward losses, increasing their Corporation Tax payments during the period of fiscal consolidation.
26 Unused borrowing allowances under the FLS extension totalled £37.0 billion at the end of Q3 2014. ‘Funding for Lending Usage and Lending Data - Q3 2014’, Bank of England, November 2014.
27 ‘Public Sector Finances’, ONS, October 2014. 28 ‘World Economic Outlook’, IMF, October 2014.
1.42 Despite slower growth in receipts, the overall fiscal position in 2018-19 is forecast to be broadly unchanged from that at Budget 2014 on a comparable basis. Spending this year and next is forecast to be lower than at Budget 2014, primarily due to lower spending on central government debt interest and social security payments. Inflation is also forecast to be lower than at Budget 2014 across the forecast period.
1.43 As a result of classification changes, the measured rate of real spending reductions delivered between 2010-11 and 2014-15 has increased slightly to 1.1%. The government remains committed to its fiscal consolidation plans. The government’s fiscal assumption is that Total Managed Expenditure (TME) in 2016-17 and 2017-18 will fall in real terms at the same rate as between 2010-11 and 2014-15, with the government having demonstrated its ability to deliver this rate of spending reductions. The government’s neutral assumption is that TME will remain flat in real terms in 2018-19 and Autumn Statement extends the same neutral assumption to 2019-20.
Spending consolidation in this Parliament
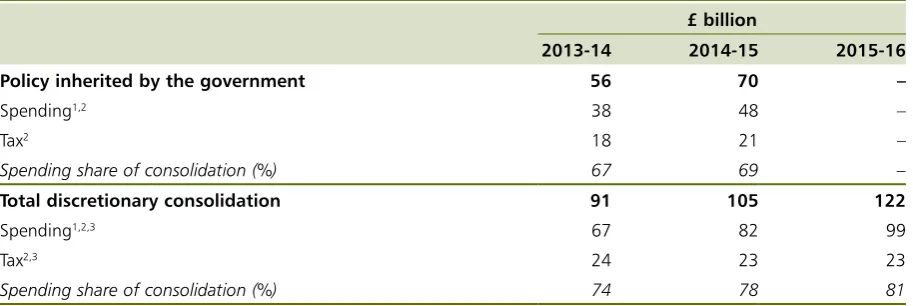
[image:21.595.71.528.310.463.2]1.44 The government has to date delivered £67 billion of the £99 billion planned discretionary reductions in spending by the end of 2015-16, as set out in Table 1.2.
Table 1.2: Total consolidation plans over this Parliament
£ billion
2013-14 2014-15 2015-16
Policy inherited by the government 56 70 –
Spending1,2 38 48 –
Tax2 18 21 –
Spending share of consolidation (%) 67 69 –
Total discretionary consolidation 91 105 122
Spending1,2,3 67 82 99
Tax2,3 24 23 23
Spending share of consolidation (%) 74 78 81
1 Spending consolidation is attributable to 3 factors: (a) reductions in Departmental Expenditure Limits (DEL) are calculated by assessing nominal DEL
totals against a counterfactual of growing DEL from 2010–11 in line with general inflation in the economy, as set out in Table 4.8 of the OBR’s pre-Budget forecast (June 2010); (b) reductions in Annually Managed Expenditure (AME) due to the net effect of policy changes announced since June Budget 2010; and (c) estimated debt interest savings, updated for market interest rates consistent with the OBR’s December 2014 ‘Economic and fiscal outlook’. This calculation excludes the one-off impact of the 4G spectrum asset sale, and financial transactions in Capital DEL.
2 This takes account of the latest costings.
3 Where costings do not extend to 2015-16, they have been grown in line with general inflation in the economy.
Source: Office for Budget Responsibility and HM Treasury.
1.45 TME is forecast to be around £10 billion lower this year than planned at Spending Review 2010, when measured on a comparable basis.31 Departmental spending will continue to fall in
2014-15 and 2015-16. By the end of 2015-16, central government’s Departmental Expenditure Limits (DEL) administration costs will have fallen by over 40% in real terms since 2010-11, or around £7 billion.32
1.46 Public spending control is central to the government’s commitment to reducing the deficit. The OBR forecasts underspends of £2.5 billion in 2014-15, reflecting a continued focus on improved spending control and good financial management across departments. Over the last 4 years, departments have underspent their budgets by an average of £5 billion each year.33
31 HM Treasury calculation based on ‘Economic and Fiscal Outlook’, OBR, December 2014; ‘Spending Review 2010’, HM Treasury, October 2010.
32 Comparison between Spending Review 2010 baselines (inflated to 2015-16 prices) and administration budgets at Spending Round 2013.
1.47 Building on announcements at Budget 2014, the government will take further action to ensure the full costs of providing pensions for public service workers are met by employers. New employer contribution rates arising from valuations of the pension schemes for the Armed Forces, the judiciary and public service workers in Scotland and Northern Irelandwill deliver £335 million of Annually Managed Expenditure (AME) savings in 2015-16, rising to £390 million in 2019-20.
1.48 The government continues to make progress towards removing progression pay in the Civil Service by 2015-16. Proposals have been agreed with departments covering more than two-thirds of the Civil Service workforce with progression pay.
Fiscal forecast
1.49 The ONS implemented significant revisions to public sector net borrowing and public sector net debt in September 2014.34 These revisions followed the introduction of ESA10,
described in further detail in Box 1.A, and implementation of changes from the 2013 ONS ‘Review of Public Sector Finance Statistics’.
1.50 The main changes to the public finances are the reclassification of Network Rail within central government, neutral offsetting movements in current and capital spending and between expenditure and receipts, and the inclusion of the Bank of England’s Asset Purchase Facility in the headline fiscal measures. The OBR has presented its assessment of the public finances on an ESA10 basis.
1.51 As set out in Table 1.3, from its post-war peak of 10.2% of GDP in 2009-10, the OBR forecasts public sector net borrowing will fall to:
•
5.0% of GDP by the end of 2014-15•
4.0% of GDP in 2015-16, the final year for which the government has set departmental spending plans•
a surplus of 0.2% of GDP in 2018-19, increasing to 1.0% of GDP in 2019-201.52 Public sector net debt is forecast to peak at 81.1% of GDP in 2015-16 before falling each year and reaching 72.8% of GDP in 2019-20.
Table 1.3: Overview of the OBR’s central fiscal forecast
% GDP, unless otherwise stated
Outturn Forecast
2013-14 2014-15 2015-16 2016-17 2017-18 2018-19 2019-20 Fiscal mandate
Cyclically-adjusted current budget deficit 2.6 2.7 2.2 0.5 -0.7 -1.5 -2.3
Deficit
Public sector net borrowing 5.6 5.0 4.0 2.1 0.7 -0.2 -1.0 Public sector net borrowing (£ billion) 97.5 91.3 75.9 40.9 14.5 -4.0 -23.1 Cyclically-adjusted net borrowing 4.1 4.2 3.6 1.8 0.5 -0.3 -1.1 Current budget deficit 4.2 3.5 2.6 0.8 -0.5 -1.4 -2.3
Primary balance -3.8 -3.3 -2.2 -0.1 1.4 2.3 3.2
Cyclically-adjusted primary balance -2.3 -2.6 -1.8 0.2 1.6 2.4 3.2
Treaty deficit1 5.8 5.3 4.3 2.3 0.9 0.0 -0.8
Cyclically-adjusted Treaty deficit1 4.2 4.5 3.9 2.0 0.8 -0.1 -0.8 Debt
Public sector net debt2 78.8 80.4 81.1 80.7 78.8 76.2 72.8
Treaty debt3 87.8 88.0 89.9 90.0 88.4 86.1 83.0
Memo: output gap (% GDP) -2.0 -0.7 -0.5 -0.4 -0.2 -0.1 0.0 Memo: total policy decisions4 0.0 0.1 0.0 0.0 0.0 0.0
1. General government net borrowing on a Maastricht basis. 2. Debt at end March; GDP centred on end March. 3. General government gross debt on a Maastricht basis. 4. Equivalent to the ‘total policy decisions’ line in Table 2.1.
Source: Office for National Statistics, Office for Budget Responsibility and HM Treasury.
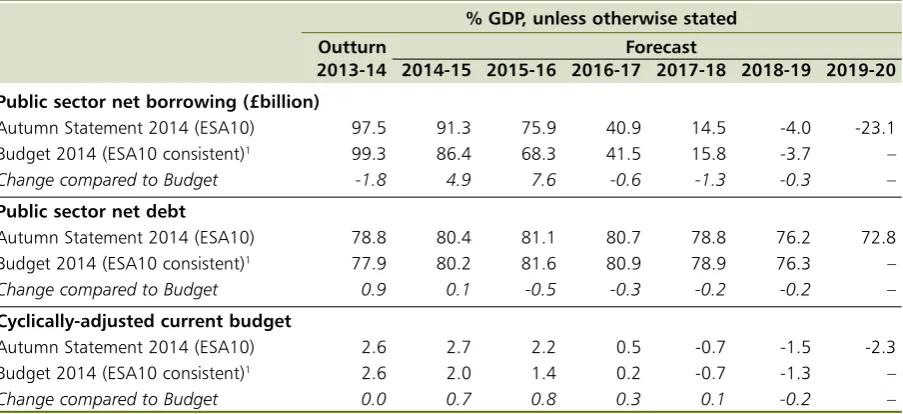
1.53 The OBR’s December 2014 ‘Economic and fiscal outlook’ includes an updated March 2014 fiscal forecast on a comparable ESA10 basis. This forecast is summarised in Table 1.4 and represents the best estimate of a March 2014 forecast against which like-for-like comparisons can be made. On this like-for-like basis, the OBR forecasts that public sector net borrowing will be slightly higher this year and next, but slightly lower in the last 3 years of the forecast period. After this year, public sector net debt as a percentage of GDP is lower in every year of the forecast period and peaks at 81.1% of GDP in 2015-16, 0.5 percentage points lower than at Budget 2014.
Table 1.4: Comparison of key fiscal aggregates to Budget 2014
% GDP, unless otherwise stated
Outturn Forecast
2013-14 2014-15 2015-16 2016-17 2017-18 2018-19 2019-20 Public sector net borrowing (£billion)
Autumn Statement 2014 (ESA10) 97.5 91.3 75.9 40.9 14.5 -4.0 -23.1 Budget 2014 (ESA10 consistent)1 99.3 86.4 68.3 41.5 15.8 -3.7 –
Change compared to Budget -1.8 4.9 7.6 -0.6 -1.3 -0.3 –
Public sector net debt
Autumn Statement 2014 (ESA10) 78.8 80.4 81.1 80.7 78.8 76.2 72.8 Budget 2014 (ESA10 consistent)1 77.9 80.2 81.6 80.9 78.9 76.3 –
Change compared to Budget 0.9 0.1 -0.5 -0.3 -0.2 -0.2 –
Cyclically-adjusted current budget
Autumn Statement 2014 (ESA10) 2.6 2.7 2.2 0.5 -0.7 -1.5 -2.3 Budget 2014 (ESA10 consistent)1 2.6 2.0 1.4 0.2 -0.7 -1.3 –
Change compared to Budget 0.0 0.7 0.8 0.3 0.1 -0.2 –
1 Consistent with the Public Sector Finances and GDP revisions due to ESA10/PSF Review as set out in the OBR’s ‘Economic and fiscal outlook’.
[image:23.595.73.525.550.757.2]Performance against the fiscal mandate
1.54 As set out at June Budget 2010, the government’s fiscal strategy is underpinned by a forward-looking mandate to achieve cyclically-adjusted current balance by the end of the rolling, 5-year forecast period.
1.55 The OBR’s December 2014 ‘Economic and fiscal outlook’ confirms the government remains on course to meet the fiscal mandate. The OBR’s judgement is that the government’s policies are consistent with a roughly 80% chance of achieving the fiscal mandate in 2019-20. The government has reduced the cyclically-adjusted current budget deficit from its peak of 4.7% of GDP in 2009-10 to 2.6% of GDP in 2013-14. The OBR forecasts the fiscal mandate will be achieved 2 years early, in 2017-18. Chart 1.7 shows performance against the government’s fiscal mandate.
Chart 1.7: Consolidation in the cyclically-adjusted current budget deficit
Source: Office for Budget Responsibility and HM Treasury.
% GDP
N/A N/A N/A N/A
Consolidation in the cyclically-adjusted current budget deficit (Autumn Statement 2014 ESA10) Consolidation in the cyclically-adjusted current budget deficit (Budget 2014 ESA10 consistent)
Cyclically-adjusted current budget deficit (Autumn Statement 2014 ESA10) Cyclically-adjusted current budget deficit (Budget 2014 ESA10 consistent)
2009-10 2010-11 2011-12 2012-13 2013-14 2014-15 2015-16 2016-17 2017-18 2018-19 2019-20 -3
-2 -1 0 1 2 3 4 5 6
1.56 The government’s fiscal mandate is supplemented by a target for public sector net debt as a percentage of GDP to be falling at a fixed date of 2015-16. The OBR forecasts that public sector net debt as a percentage of GDP will be falling in 2016-17, a year later than the supplementary target. Public sector net debt peaks in the same year as forecast at Budget 2014, and peaks at a slightly lower level on a comparable basis.
Performance against EU targets
Chart 1.8: Public sector net debt
Source: Office for National Statistics, Office for Budget Responsibility and HM Treasury.
Autumn Statement 2014 (ESA10) Budget 2014 (ESA10 consistent)
% GDP
2009-10 2010-11 2011-12 2012-13 2013-14 2014-15 2015-16 2016-17 2017-18 2018-19 2019-20 50
55 60 65 70 75 80 85
The long-term debt challenge
1.58 As a result of the Great Recession, public sector net debt is forecast to rise by more than 40% of GDP since the financial crisis to a peak of 81.1% of GDP in 2015-16 and will be 72.8% of GDP in 2019-20. The peak in debt will be the highest level of debt since the late 1960s.35
Debt would be even higher if the government had not pursued its plan to reduce the deficit.
1.59 Central government (gross) spending on debt interest is forecast to be £48 billion this year. Reducing debt in future will help control these costs and reduce the burden on future generations. Debt interest would be £5 billion a year lower for every reduction in debt of 10% of GDP, based on the market interest rates used by the OBR in its December 2014 ‘Economic and fiscal outlook’.
1.60 High public debt also increases the UK’s vulnerability to future shocks. It is more likely a new shock would increase debt to potentially unsustainable levels if starting from a higher level of debt, increasing uncertainty, pushing up interest rates and undermining economic stability.
1.61 Chart 1.9 shows projections for the path of public sector net debt as a percentage of GDP, assuming different levels of borrowing from the end of the 5-year forecast horizon. This chart is based on a simple scenario in which there are no shocks to the economy.
1.62 As illustrated by Chart 1.9, sustained action will be needed to bring down debt even in the absence of future shocks. Prudent fiscal policy should, however, take account of future shocks to the economy, even though the scale and timing are inherently unpredictable and any analysis of potential future shocks can only be illustrative. Chart 1.10 shows how the level of public sector net debt in 2035-36 would be affected by a simple scenario in which the economy is hit once every 8 years by a shock that increases public sector net debt by 10% of GDP (less than the peak increase following the recession in the 1990s). This should not be interpreted as a prediction, though increases in debt of this magnitude are consistent with previous impacts of economic downturns on public borrowing.
Chart 1.9: Path of public sector net debt under different policy assumptions
Outturn OBR forecast HM Treasury projection
% GDP
Current budget balance (1.2% overall deficit)
1% surplus Budget balance
Source: Office for National Statistics, Office for Budget Responsibility and HM Treasury.
2007-08 2011-12 2015-16 2019-20 2023-24 2027-28 2031-32 2035-36
0 10 20 30 40 50 60 70 80 90
1.63 In this illustrative scenario, a permanent 1.2% deficit, equivalent to a balanced current budget with investment equal to its 2019-20 forecast level, results in debt falling by only around 5% of GDP by 2035-36 from its 2015-16 peak, still leaving debt at historically high levels. A 1% surplus under the same scenario results in debt falling from its peak by around 30% of GDP by 2035-36. Larger or more frequent shocks in the future would of course result in higher levels of public debt and vice versa.
Chart 1.10: Projections of public sector net debt in 2015-16 and 2035-36 under different policy assumptions with and without illustrative shocks
0 10 20 30 40 50 60 70 80 90
Source: Office for Budget Responsibility and HM Treasury.
Illustrative shock that increases public sector net debt by 10% of GDP every 8 years starting in 2019-20
Projected debt (excluding shocks)
Debt in 2015-16 Debt in 2035-36
(1% surplus) (current budget balance,Debt in 2035-36 1.2% overall deficit)
% GDP
Consolidation in the next Parliament
1.64 The existing fiscal rules, set in 2010, reflected the exceptional fiscal challenge that needed to be addressed. In June Budget 2010, the government said it would revisit the fiscal rules once the public finances were closer to balance. As announced at Autumn Statement 2013, the government has reviewed its fiscal framework and an updated Charter for Budget Responsibility and motion for approval will be laid before Parliament in the week after Autumn Statement 2014.
1.65 The government’s planned consolidation in the next Parliament is reflected in the fiscal assumption that TME will fall in real terms in 2016-17 and 2017-18 at the same rate as between 2010-11 and 2014-15. The government’s neutral assumption is that TME will be held flat in real terms in 2018-19. Autumn Statement extends the neutral fiscal assumption to 2019-20, with TME held flat in real terms for a further year.
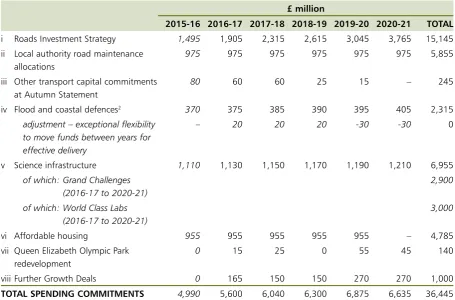
1.66 The government will continue to prioritise capital investment so public sector gross investment will be held constant in real terms in 2016-17 and 2017-18 and increase in line with GDP from 2018-19. At Spending Round 2013, the government set out a long-term pipeline of capital investment worth more than £100 billion over the next Parliament. Autumn Statement sets out in detail how over £30 billion will be invested in Britain’s infrastructure and growth-promoting sectors, including roads, flood and coastal defences and science.
Delivering on future consolidation plans
1.67 Choices will need to be made on the composition of further consolidation in the next Parliament, including funding any new commitments. Autumn Statement provides further detail on some of these choices.
1.68 To deliver the necessary reductions in spending, the government will continue to pursue an ambitious package of efficiency and reform in the next Parliament. By April 2014, departments working with HM Treasury and the Cabinet Office had delivered savings of over £14 billion compared to 2009-10.36
1.69 Building on these achievements, Autumn Statement announces the government will seek a further £10 billion of efficiency savings by 2017-18. This will be led by the Cabinet Office, working closely with HM Treasury and departments.37
1.70 As part of this, the government will take forward a range of digital transformation measures, including increasing the digital uptake of public services among those online by 10 percentage points in 2016 and improving IT procurement to secure savings from contracts due for renewal over the next Parliament, which are worth £4 billion per year.
1.71 At Autumn Statement 2013, the government increased the target for the sale of corporate and financial assets to £20 billion between 2014 and 2020. Since the beginning of 2014, £6.9 billion of assets have already been sold (35% of the target).38 In October 2014, the
government launched the sale of its shareholding in Eurostar. Progress continues towards the sale of the government’s stake in Urenco, the pre-2012 Income Contingent Repayment student loan book and public sector spectrum. The government is also working to bring private capital into the Green Investment Bank through a new fund for private investment in operational offshore wind assets and wider options. The government will report on progress at Budget 2015.
1.72 The government recognises underused public land can play a vital role in delivering new homes. Autumn Statement announces an increased ambition for public sector land and commits to releasing enough land for up to 150,000 homes between 2015 and 2020. 36 ‘Government savings in 2013 to 2014’, Cabinet Office, June 2014.
37 ‘Efficiency and Reform in the Next Parliament’, Cabinet Office, 3 December 2014.
1.73 To deliver reductions to departmental spending, the government has also exercised firm restraint over public sector pay. Public sector pay restraint in this Parliament is expected to save an estimated £12 billion by 2014-15.39 The government will need to continue to reform, and
take tough decisions on, public sector pay while it continues to reduce the current budget deficit until 2017-18, and would expect to deliver commensurate savings.
1.74 Budget 2014 announced the government would pilot pay bill control in 2 departments. This is a new method of pay restraint with control of the overall pay budget rather than limiting headline pay awards. The effectiveness of these pilots will be assessed at the next spending review.
1.75 The government will also continue to implement reforms across the wider public sector, improving public services while reducing costs. The government is exploring a range of further reforms for the next Parliament to drive out waste and inefficiency and improve outcomes.
1.76 The government has encouraged greater integration of public services. In 2011, the government launched 4 Whole Place Community Budget pilots. These pilots have demonstrated the possible savings from more effective delivery, with Tri-borough in London saving £2 million by halving the length of care proceedings in the court system for children at risk, and West Cheshire’s Integrated Early Support contributing to a 13% reduction in the number of children in need locally.40
1.77 The government expanded this kind of approach through the Better Care Fund to integrate health and social care, into which local areas are planning to pool £5.3 billion in 2015-16, and the Troubled Families programme, which has already met the payment-by-results criteria for turning around 70,000 families.41 The government welcomes the contribution of
the Service Transformation Challenge Panel about how to roll out these approaches at pace and scale.42 Further integration of services will be delivered by developing and extending the
principles underpinning the Troubled Families programme approach to other groups of people with multiple needs.
1.78 The government will also look to better integrate benefits and services. Over 40% of unemployed people who claim Employment and Support Allowance report a mental health condition as their primary health condition.43 In response to this, the government is piloting new
ways to help people return to work. The Department for Work and Pensions and the Department of Health have invested £3 million and, through Growth Deals, the Department for Communities and Local Government is funding a further £12 million of pilots to test the provision of joined-up services that better reflect the needs of claimants. Autumn Statement announces a further £3 million of funding to expand these pilots.The government will build on the findings from these pilots in the next spending review and explore how integrated budgets across health and employment could deliver improved and more efficient support to help this group return to work.
1.79 The government has demonstrated the potential efficiencies from properly benchmarking costs and performance. The programme to benchmark public sector prisons and drive down unit costs will deliver annual savings of £300 million by 2015-16. The government will continue
39 HM Treasury calculation. Savings compared to a counterfactual of 2% average pay awards over the Spending Review 2010 period, including savings recycled in ring-fenced budgets.
40 ‘Improving lives, saving money: Practical examples from the first two years since we decided to share major services’, London Borough of Hammersmith and Fulham, Royal Borough of Kensington and Chelsea and London Borough of Westminster, March 2013; Internal performance data from Cheshire West and Chester Integrated Early Support Programme Board.
41 ‘Troubled Families programme: progress information and families turned around’, Department for Communities and Local Government, October 2014. Available at www.gov.uk
42 An independent panel launched by the Chief Secretary to the Treasury and the Secretary of State for Communities and Local Government in April 2014 to advise on what needs to happen nationally and locally to increase the pace and scale of service transformation.
to drive greater efficiency in the wider public sector by ensuring this approach is extended. For example, evidence shows the best performing schools focus their spend on teachers rather than back-office. Many schools have driven down costs but there is significant scope for other schools to make back-office savings. Secondary school spending on back-office costs ranges from £202 to £1,432 per pupil, and between 2003 and 2013, back-office spending per pupil in maintained schools increased by around 60% in real terms.44
1.80 To reduce cost and delay, the government will move towards a digital end-to-end criminal justice system, where information is captured once by a police officer responding to a crime and then flows through the system without duplication or reworking. Harnessing technology more effectively will provide for new ways of working. For example, police should be able to capture evidence digitally at the scene of a crime, uploading case information using mobile devices without needing to return to the police station. Video technology should be the default unless victims and witnesses, suspects, lawyers or police officers are required in the courtroom.
Health
1.81 People are living longer with complex health issues and the NHS needs to evolve to meet new challenges. The NHS ‘Five Year Forward View’ outlines a vision for a more sustainable, more integrated health service that cares for people closer to home. Autumn Statement sets out the government’s support for that vision, providing £2 billion of additional funding for the frontline NHS in England in 2015-16. This is part of a multi-year £3.1 billion UK-wide investment in the future of the NHS.
1.82 In 2015-16, the government will spend an additional £1.5 billion on frontline patient care delivered by the NHS in England. The money will go to improving local NHS services so that every patient will benefit.
1.83 Alongside this, the government is creating a £200 million transformation fund in 2015-16 to deliver the first year of the ‘Five Year Forward View’. The fund will kick-start the work needed to develop new ways of caring for patients to improve the integration of GPs, community services and hospitals.
1.84 Building on this investment, Autumn Statement announces that the fines collected from the banks that broke the foreign exchange market rules will be used to create a £1 billion fund for advanced care in GP practices in England. Bringing together GPs, nurses and specialists, the fund will pay for the modern premises and technology that will give patients access to advanced care, such as chemotherapy and dialysis, in their local communities. These new primary care facilities will also be encouraged to join up closely with local job centres, social services and other community services, in order to ensure that the NHS is also supporting people back into the labour market.
1.85 The additional funding for the NHS in 2015-16 generates £123 million in additional funding for the Scottish Government, £71 million for Wales, and £41 million for Northern Ireland. This will make an additional £237 million available for the devolved administrations in 2015-16, which they can spend next year in line with their own priorities.
1.86 The government is also continuing to invest in mental health services, and the new NHS mandate will commit to parity of esteem between physical and mental health. Eating disorders most commonly begin in adolescence and the government recognises the need to act quickly and early to ensure that young people receive the right tre