■ " I
ISSN 02528266
σι
σι
Oí;
Eurostatistik
Daten zur Konjunkturanalyse
Monatlich
2 5 H
Eurostatistics
Data for shortterm economic analysis
Monthly
Eurostatistiques
Données pour l'analyse de ia conjoncture
Mensuel
···
\3Δ
eurostat
STATISTISCHESAMT DER EUROPAISCHEN GEMEINSCHAFTEN
STATISTICAL OFFICE OF THE EUROPEAN COMMUNITIES
OFFICE STATISTIQUE DES COMMUNAUTÉS EUROPÉENNES
Φ
σι
σι
Eurostatistik
Daten zur Konjunkturanalyse
M o n a t l i c h
Eurostatistics
Data for short-term economic analysis
M o n t h l y
Eurostatistiques
Données pour l'analyse de ia conjoncture
Zahlreiche weitere Informationen zur Europäischen Union sind verfügbar über Internet,
server Europa (http://europa.eu.int).
A great deal of additional information on the European Union is available on the Internet.
It can be accessed through the Europa server (http://europa.eu.int).
De nombreuses autres informations sur l'Union européenne sont disponibles sur Internet
via le serveur Europa (http://europa.eu.int).
Luxembourg: Office des publications officielles des Communautés européennes, 1999
SEITE - PAGE - PAGE
VORWORT
FOREWORD
AVANT-PROPOS
ZEICHEN UND ABKÜRZUNGEN
SYMBOLS AND ABBREVIATIONS
SIGNES ET ABRÉVIATIONS
SCHAUBILDER : siehe ausführliche Aufstellung Seite 1
GRAPHICS : see detailed list on page 1
GRAPHIQUES : voir liste détaillée page I
TABELLEN : siehe ausführliche Aufstellung Seite III
TABLES : see detailed list on page III
TABLEAUX : voir liste détaillée page III
Volkswirtschaftliche Gesamtrechnungen ESVG 95
National accounts ESA 95
Comptes nationaux SEC 95
Beschäftigung
Employment
Emploi
Arbeitslosigkeit
Unemployment
Chômage
Industrie
Industry
Industrie
Energie
Energy
Energie
D i e n s t l e i s t u n g e n
S e r v i c e s
S e r v i c e s
Landwirtschaftliche Erzeugnisse
Agricultural products
Produits agricoles
Außenhandel
External trade
Commerce extérieur
Verbraucherpreise
Consumer prices
Prix à la consommation
Agrarpreisindizes
Indices of agricultural prices
Indices des prix agricoles
Finanzstatistiken
Financial statistics
5
6
7
27
29
43
55
61
85
91
99
105
133
143
VORWORT
FOREWORD
AVANT-PROPOS
Mit der monatlich erscheinenden
Veröffentlichung
Eurostatistik
-Daten zur Konjunkturanalyse
werden innerhalb kürzester Frist
die neuesten statistischen Daten
über die Europäische Union als
Ganzes, über jedes
Mitgliedsland sowie über die
Vereinigten Staaten und Japan
bekanntgegeben.
Eurostatistik - Daten zur
Konjukturanalyse
enthält die
wichtigsten, bei Eurostat
verfügbaren Statistiken zur
konjunkturellen Entwicklung.
Die Publikation wurde im
Umfang bewußt klein gehalten
und enthält keine Anmerkungen
zur Methodik, die im übrigen in
den spezialisierten
Veröffentlichungen von Eurostat
zu finden sind.
Eurostatistk - Daten zur
Konjunkturanalyse
enthält keine
Kommentare. Dafür werden die
wichtigsten Indikatoren in der
monatlichen
Veröffentlichung
Schlüsselzahlen - Bulletin zur
europäischen Konjunktur und
Synthesen
kommentiert.
Die in allen Publikationen
veröffentlichten Daten stammen
aus der Datenbank New
Cronos. New Cronos setzt sich
zusammen aus dem alten
Cronos sowie REGIO und ist
nicht mehr in Form von
Zeitreihen, sondern in Form von
multidimensionalen Tabellen
dargestellt. New Cronos ist
somit eines der Produkte zur
Verbreitung statistischer Daten,
das direkt aus der Eurostat
-Referenzdatenbank gespeist
wird.
Eurostatistics - data for
short-term economic analysis
is a monthly publication aimed
at providing, as rapidly as
possible, the latest statistical
data on the European Union
as a whole, each Member
State, the United States and
Japan.
Eurostatistics - data for short
term economic analysis
presents the most relevant
statistics on the economic
situation held by Eurostat.
The publication is deliberately
streamlined and does not
contain any methodological
notes, which are given in
Eurostat's specialized
publications.
Eurostatistics - Data for
short-term economic analysis
does not include comments.
For this,
Key Figures - bulletin
of economic trends and
summaries
will comment on
the most important indicators.
The data presented in all
publications are taken from
Eurostat's on-line database,
New Cronos. New Cronos
includes old Cronos and
Regio, both represented not
by chronological series but
through multi-dimensional
tables. New Cronos is a
dissemination product directly
from Eurostat's Reference
Environment.
Eurostatistiques - Données
pour l'analyse de la
conjoncture
est une publication
mensuelle qui a pour but de
fournir dans les meilleurs
délais les données statistiques
les plus récentes pour l'Union
européenne en tant
qu'ensemble, pour les pays
membres ainsi que pour leurs
principaux partenaires
extra-communautaires
(États-Unis d'Amérique et
Japon).
Eurostatistiques - Données
pour l'analyse de la
conjoncture
reprend les
statistiques les plus
importantes sur la situation
économique disponibles
auprès d'Eurostat.
Cette publication ne comporte
pas de notes méthodologiques.
Elles sont disponibles dans les
publications spécialisées
d'Eurostat.
Eurostatistiques - Données
pour l'analyse de la
conjoncture
ne comprend pas
de commentaires. Par contre,
les indicateurs les plus
importants sont commentés
dans le mensuel
Chiffres Clés
- Bulletin de la conjoncture
européenne et synthèses.
Les données présentées dans
les publications proviennent de
la base de données New
Cronos. New Cronos se
compose de l'ancien Cronos et
de Regio, représentés non plus
sous forme de séries
%
πτ1 %
ZEICHEN UND
ABKÜRZUNGEN
Weniger als die Hälfte der
verwendeten Einheit
Prozent
Prozentualer Zuwachs
eines Vierteljahres gegenüber
dem vorhergehenden
Vergleichszeitraum
(Monat,Vierteljahr,Jahr)
SYMBOLS AND SIGNES ET
ABBREVIATIONS ABRÉVIATIONS
Data less than the unit used
Per cent
Percentage increase of
one period (month,
quarter, year) on the
corresponding previous
period
Donnée inférieure à la moitié
de l'unité utilisée
Pourcentage
Accroissement en
pourcentage d'une période
(mois, trimestre ou année) sur
la periode précédente
T/T12 %
1990=100
1000
Mio
MrdBnMrd
t
tJ (GCV)
GWh
USD
ECU
SZR - S D R - D T S
SITC-SITC-CTCI
EU-15
Prozentualer Zuwachs
eines Monats gegenüber
dem entsprechenden
Monat des Vorjahres
Basisjahr
in 1000
Million
Milliarde
Metrische Tonne
Terajoule = 10
9kJ
Gigawattstunde = 10
6kWh
USDollar
Europäische Währungseinheit
Sonderziehungsrechte
Standard International Trade
Classification
Mitgliedstaaten insgesamt
Percentage increase on
the corresponding month
of the previous year
Reference year
Thousand
Million
Thousand million
Ton
Terajoule=10
9kJ
Gigawatt hour (= 106kWh)
US dollar
European currency unit
specail drawing rights
Standard international
trade classification
Total of Member States
of the EU
Accroissement en
pourcentage d'un mois sur le
mois correspondant de l'année
précédente
Année de base
Millier
Million
Milliard
Tonne métrique
Terajoule = 10
9kJ
Gigawattheure = 106kWh
Dollar US
Unité monétaire européenne
Droits de tirages spéciaux
Classification type pour le
commerce international
Ensemble des États membres
de l'UE
EUR-11
B/L
A K P - A C P - A C P
BIP-GDP-PIB
OPEC-OPEC-OPEP
EGKS-ECSC-CECA
ESVG-ESA-SEC
tRöe-toe-tep
Wirtschafts und
Währungsunion (B, D, E, F,
IRL, I, L, NL, A, Ρ, FIN)
BelgischLuxemburgische
Wirtschaftsunion
Länder Afrikas,
der Karibik und des
Pazifiks Abkommen
von Lomé
Bruttoinlandsprodukt
Organisation der
erdölexportierenden
Länder
Europäische Gemeinschaft
für Kohle und Stahl
Europäischen System
Volkwirtschaftlicher
*
Gesamtrechnungen
Tonne Rohöleinhiet
Economic Monetary Union (B,
D, E, F, IRL, l,L, NL,A, P, FIN)
BelgoLuxembourg
economic union
African, Caribbean and Pacific
countries of the
Lomé Convention
Gross domestic product
Organization of petroleum
exporting countries
European coal and steal
community
European System of Accounts
Ton of oil equivalent
Union Monétaire Economique
(Β, D, E, F, IRL, I, L, NL, Α, Ρ,
FIN)
Union économique
belgoluxembourgeoise
États d'Afrique, des Caraïbes
et du Pacifique Convention
de Lomé
Produit intérieur brut
Organisation des pays
exportateurs de pétrole
Communauté européenne du
charbon et de l'acier
Système Européenne des
Comptes
Schaubilder
Graphics
SCHAUBILDER
GRAPHICS
GRAPHIQUES
Veränderung des
Changes in gross domestic
Evolution du produit
Bruttoinlandsprodukts
product
intérieur brut
ESVG95
ESA95
SEC95
(Volumenindex 1995=100)
(Volume index 1995=100)
(Indice de volume 1995=100)
EU15
Λ
EUR11
•JPN
■USA
120
115
110
105
100
95
90
SCHAUBILDER
GRAPHICS
GRAPHIQUES
I S 02
eurostat
Veränderung des
Bruttoinlandsprodukts
ESVG95
(Volumenindex 1995=100)
Changes in gross
domestic product
ESA95
(Volume index 1995=100)
Evolution du produit
intérieur brut
SEC95
(Indice de volumel 995=100)
1996
1997
1998
1999
1996
1997
1998
1999
EU15
t
ι Danmark
EU15
Deutschland
1996
1997
1998
1999
1996
1997
1998
1999
EU15
HWSSM EspanaEU15
E
France
SCHAUBILDER
GRAPHICS
GRAPHIQUES
eurostat
Veränderung des
Bruttoinlandsprodukts
ESVG95
(Volumenindex 1995=100)
Changes in gross
domestic product
ESA95
(Volume index 1995=100)
Evolution du produit
intérieur brut
SEC95
(Indice de volumel 995=100)
1996
1997
1998
1999
1996
1997
1998 1999
EU-15
Österreich
EU-15
Portugal
1996
1997
1998
1999
EU-15
Suomi/Finland
1996
1997
1998
1999
EU-15
Sverige
SCHAUBILDER
GRAPHICS
GRAPHIQUES
~~
^ 0 6
i m e t ä t ^ ^ ^ ^
eurostat
Arbeitslosenquoten
Unemployment rates total
insgesamt saisonbereinigt
seasonally adjusted
Taux de chômage total
désaisonnalisé
1996
1997
1998
1999
=n
EU15
F = ^ l EUR11
1996
1997
1998
1999
Belgique/België
E = ] EU15
Γ^^Ί EUR-11
Danmark
1996
EU-15
1997
1998
1999
EUR-11
Deutschland
-f 1 —
1996
I I EU-15
1997 1998
I I Hl JH-11
SCHAUBILDER
GRAPHICS
GRAPHIQUES
eurostat
Arbeitslosenquoten
Unemployment rates total
insgesamt saisonbereinigt
seasonally adjusted
Taux de chômage total
désaisonnalisé
IRELAND
1996
1997
1998
1999
= 3
EU15
E
EUR11
Ireland
1996
I
I EU15
1997
I I hUH11
1998
^ H
Italia
1999
25
20 H
15
10
060
25
20
15
10
1996
1997
1998
1999
EU15
Γ ^ η EUR11
Luxembourg
251
20
15
25
20
15
|i HIB n n i i l l e —^ ^ m ^
1996
I — I EU15
1997
I I bUH11
1998
ΓΖΖ3
1999
Nederland
SCHAUBILDER
GRAPHICS
GRAPHIQUES
m
eurostat
Arbeitslosenquoten
Unemployment rates total
Taux de chômage total
insgesamt saisonbereinigt
seasonally adjusted
désaisonnalisé
1996
I 1 EU15
1997
I — I HJR11
1998 1999
t_—J Suomi/Finland
1996
I 1 EU15
1997
I — I H I H 1 1
1998 1999
Sverige
1996
1997
1998
1999
E = 3 EU15
r ^ ^
EUR11
United Kingdom
1996
I 1 EU15
1997
I I hUH11 1998
USA 1999
15
SCHAUBILDER
GRAPHICS
GRAPHIQUES
10 07
eurostat
Industrielle Produktion
Industrie insgesamt
(ohne Baugewerbe)
Trend 1995=100
Industrial production
Total industry
(excluding construction)
Trend 1995=100
Production industrielle
Ensemble de l'indudstrie
(sans bâtiment)
Tendance 1995=100
NACE Rev.1 CE
EU15
A
EUR11
■USA
•JPN
125
120
115
110
105
100
95
90
SCHAUBILDER
GRAPHICS
GRAPHIQUES
ΈΔ
07
eurostat
120
115
110
105
100
95
90
85
80
Industrielle Produktion
Industrie insgesamt
(ohne Baugewerbe)
Trend 1995=100
Industrial production
Total industry
(excluding construction)
Trend 1995=100
LGIQUE/BELGIE
0701
J98 A98 S98 098 N98 D98 J99 F99 M99 A99 M99 J99 J99
Production industrielle
Ensemble de l'indudstrie
(sans
bâtiment)
Tendance 1995=100
J98 A98 S98 098 N98 D98 J99 F99 M99 A99 M99 J99 J99
EU15
Belgique/België
EU15
Danmark
DEUTSCHLAND
0701
120
115
110
105
100
95
90
85 H
80
J98 A98 S98 098 N98 D98 J99 F99 M99 A99 M99 J99 J99
120
115
1101
105
100
95
90
85
80
J98 A98 S98 098 N98 098 J99 F99 M99 A99 M99 J99 J99
SCHAUBILDER
GRAPHICS
GRAPHIQUES
—r
m
o?
eurostat
Industrielle Produktion
Industrie insgesamt
(ohne Baugewerbe)
Trend 1995=100
Industrial production
Total industry
(excluding construction)
Trend 1995=100
Production industrielle
Ensemble de I'indudstrie
(sans bâtiment)
Tendance 1995=100
J98 A9B S98 098 N98 D98 J99 F99 M99 A99 M99 J99 J99
EU-15
Ireland
J98 A98 S98 098 N98 D98 J99 F99 M99 A99 M99 J99 J99
EU-15
Italia
120
Ί115
110
105
100- |
95
90
85
80
J98 A98 S98 098 N98 D98 J99 F99 M99 A99 M99 J99 J99 J98 A98 S98 098 N98 D98 J99 F99 M99 A99 M99 J99 J99
SCHAUBILDER
GRAPHICS
GRAPHIQUES
m
07
eurostat
Industrielle Produktion
Industrie insgesamt
(ohne Baugewerbe)
Trend 1995=100
Industrial production
Total industry
(excluding construction)
Trend 1995=100
Production industrielle
Ensemble de l'indudstrie
(sans bâtiment)
Tendance 1995=100
J98 A98 S98 098 N98 D98 J99 F99 M99 A99 M99 J99 J99 J98 A98 S98 098 N98 D98 J99 F99 M99 A99 M99 J99 J99
r = i EU15
I
I Suomi/Finland
. .
UNITED KINGDOM 1
0701
EU15
Sverige
120
115
110
105
100
95
90
85
80
J98 A98 S98 098 N98 D98 J99 F99 M99 A99 M99 J99 J99 J98 A98 S98 098 N98 D98 J99 F99 M99 A99 M99 J99 J99
= ]
EU15
United Kingdom
EU15
USA
120 π
115
110
105
100
9 5
9 0
8 5
JAPAN
0701
SCHAUBILDER
GRAPHICS
GRAPHIQUES
—
iE 21
Verbaucherpreisindizes Consumer prices indices Indice des prix à la consommation
eurostat
Gesamtindex
T/T-12%
General index
T/T-12%
Indice général
T/T-12%
EU-15
USA
•JPN
GRAPHICS
GRAPHIQUES
Harmonisierte
Harmonized indices of
Verbraucherpreisindizes
consumer prices General
Gesamtindex T/T12%
index T/T12%
Indices harmonisés des prix
à la consommation
Indice d'ensemble T/T12%
0,0 ^ ^ ^ ^ ^ ^ ^ ■ ^ ^ ■ P ^ ^ ^ " · " " ^ " ^ ™ ^ ™ ^ ™ ™
0,0
A98 S98 098 N98 D98 J99 F99 M99 A99 M99 J99 J99 A99 *98 S98 098 N98 D98 J99 F99 M99 A99 M99 J99 J99 A99
EU15
EUR11
Belgique/België
EU15
ΠΞΞΞΠ
EUR11
Danmark
A98 S98 098 N98 J99 F99 M99 A99 M99 J99 J99 A99
EU15
EUR11
Deutschland
A98 S98 098 N98 J99 F99 M99 A99 M99 J99 J99 A99
EU15
A98 S98 098 N98
EUR11
Ellada
SCHAUBILDER
GRAPHICS
GRAPHIQUES
eurostat
Harmonisierte
Verbraucherpreisindizes
Gesamtindex T/T12%
Harmonized indices of
consumer prices
General index T/T12%
Indices harmonisés des prix
à la consommation
Indice d'ensemble T/T12%
A98 S98 098 N98 D98 J99 F99 M99 A99 M99 J99 J99 A99
ΞΞΞ] EU15
E
EUR11
Ireland
! S98
I 1
098 N98
EU15
D98
ι
J99 F99 M99
3
EUR11
A99 M99 J99 J99
M
Italia
A99
A98 S98 098 N98 J99 F99 (.199 A99 M99 J99 J99 A99 A98 S98 098 N98 J99 F99 (.199 A99 1.199 J99 J99 A99
EU15
EUR11
Luxembourg
ι — ι EU15
EUR11
Nederland
2,0
SCHAUBILDER
GRAPHICS
GRAPHIQUES
ËE2 21
eurostat
Harmonisierte
Verbraucherpreisindizes
Gesamtindex T/T-12%
Harmonized indices of
consumer prices General
index T/T-12%
Indices harmonisés des prix à la
consommation
Indice d'ensemble T/T-12%
SUOMI/FINL
S98 098 N98 D98 J99 F99 M99 A99 (.199 J99 J99 A99 S98 098 N98 D98 J99 F99 M99 A99 (.199 J99 J99 A99
EU-15
EUR-11
Suomi/Finland
EU-15
Ώ
EUR-11
Sverige
A98 S98 098 N98 D98 J99 F99 1.199 AS9 (.199 J99 J99 A99
SCHAUBILDER
GRAPHICS
GRAPHIQUES
m
eurostat
Wechselkurs
(Durchschnitt)
Exchange rate
(Mean)
Taux de change
(Moyenne)
•1 EUR(*) = ... USD
- 1 EUR(*) = ... YEN
1,5
1,4
1,3
1,2
1,1
1,0
J \
170
160
150
140
130
120
110
100
1996
1997
1998
1999
SCHAUBILDER
GRAPHICS
GRAPHIQUES
1Ξ
;
24
eurostat
Wechselkurs (1)
(Durchschnitt)
Exchange rate (1]
(Mean)
Taux de change (1)
(Moyenne)
598 098 N98 D98 J99 F99 M99 A99 M99 J99 J99 A99 S99
Ε Ξ ]
1
EUR:
1
USD
=
S98 098 N98 D98 J99 F99 M99 A99 M99 J99 J99 A99 S99
1
EUR
=
...
1
USD:
S98 098 N98 D98 J99 F99 M99 A99 M99 J99 J99 A99 S99
1
EUR
= .
1
USD:
l ■ ι ι ■
S98 098 N98 D98 J99
Γ = 1
1
EUR
=
...
F99 M99 A99
H B
(.199 J99 J99
1
USD
=
...
■
A99
I
S99
SCHAUBILDER
GRAPHICS
GRAPHIQUES
ΈΔ
24
eurostat
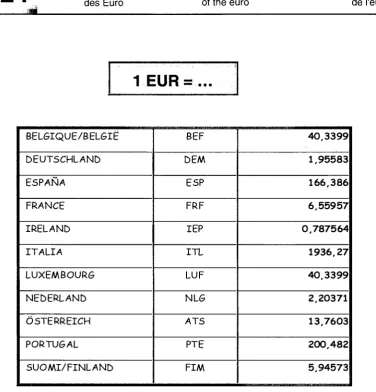
Umrechnungstabelle
des Euro
[image:27.595.86.463.117.510.2]Conversion table
of the euro
Table de conversion
de l'euro
1
EUR
=
...
BELGIQUE/BELGIË
DEUTSCHLAND
ESPAÑA
FRANCE
IRELAND
ITALIA
LUXEMBOURG
NEDERLAND
ÖSTERREICH
PORTUGAL
SUOMI/FINLAND
BEF
DEM
ESP
FRF
IEP
ITL
LUF
NLG
ATS
PTE
FIM
40,3399
1,95583
166,386
6,55957
0.787564
1936,27
40,3399
2,20371
13,7603
200,482
Volkswirtschaftliche Gesamtrechnungen
ESG 95
VOLKSWIRTSCHAFTLICHE GESAMTRECHNUNGEN ESVG 95
NATIONAL ACCOUNTS ESA 95
COMPTES NATIONAUX SEC 95
1996 1997 1998 1999 1995 IV 1996 I II III IV 1997 I II III IV 1998 I II III IV 1999 I II 1996 1997 1998 1999 1995 IV 1996 I II III IV 1997 I II III IV 1998 1 II III IV 1999 I II
0101
EU-15 6617.70 6777.80 6959.05 7101.07 1625.27 1629.54 1639.36 1648.97 1655.01 1658.34 1678.24 1690.57 1703.71 1716.04 1723.95 1733.91 1736.54 1743.43 1749.650102
EU-15 1.5 2.4 2 7 2.0 0.3 0.3 0.6 0.6 0.4 0.2 1.2 0 7 0.8 0.7 0.5 0.6 0.2 0.4 0.4Bruttoinlandsprodukt
Mrd Euro(")
1995
EUR-11 5317.15 5435.39 5583.83 5704.96 1316.13 1318.29 1326.42 1334.28 1338.11 1338.41 1355.29 1364.89 1376.27 1386.61 1393.21 1400.70 1402.78 1409.09 1413.54 Β 212.78 219.61 225.99 230.32 52.84 52.77 52.97 53.40 53.68 53.65 54.79 55.40 55.82 55.85 56.74 56.80 56.64 56.78 DK 141.71 146.16 150.08 152.62 34.84 35.01 35.48 35.66 35.60 35.96 36.73 36.62 36.89 37.30 37.13 37.87 37.83 37.63 37.70 D 1894.38 1921.87 1963.23 1996.10 471.59 467.48 473.78 475.86 477.84 475.65 481.15 482.86 484.67 489.80 489.80 491.77 490.44 492.63 492.84Veränderung des
Bruttoinlandsprodukts
Volumen (T/T1 %)
EUR-11 1.3 2.2 2.7 2.2 0.2 0.2 0.6 0.6 0.3 0.0 1.3 0.7 0.8 0.8 0.5 0.5 0.2 0.5 0.3 Β 0.9 3.2 2.9 1.9 0.4 0 . 1 0.4 0.8 0.5 0 . 1 2.1 1.1 0.8 0.1 1.6 0.1 0 . 3 0.3 DK 2.9 3.1 2.7 1.7 1.0 0.5 1.4 0.5 0 . 2 1.0 2.1 0 . 3 0.7 1.1 0 . 4 2.0 0.1 0 . 5 0.2 D 0.8 1.5 2.2 1.7 0.2 0 . 9 1.4 0.4 0.4 0 . 5 1.2 0.4 0.4 1.1 0.4 0 . 3 0.5 0.0 EL 47.25 48.74 50.54 52.25 EL 2.4 3.2 3.7 3.4 E 457.34 474.88 493.67 510.00 112.02 112.96 113.82 115.12 115.63 116.77 118.06 119.11 121.15 121.84 122.79 124.26 125.00 125.77 127.20 E 2.3 3.8 4.0 3.3 0.2 0.8 0.8 1.1 0.4 1.0 1.1 0.9 1.7 0.6 0.8 1.2 0.6 0.6 1.1 F 1201.20 1224.85 1263.59 1293.09 297.01 299.22 299.69 301.15 301.59 302.80 304.74 307.33 310.62 313.52 316.17 317.67 319.56 320.82 322.71Gross domesticproduct
Bn euroQ
1995
IRL 49.18 54.41 59.04 64.51Chanc
proc
F 1.1 2.0 3.2 2.3 0 . 2 0.7 0.2 0.5 0.2 0.4 0.6 0.9 1.1 0.9 0.9 0.5 0.6 0.4 0.6 IRLβ . :
10.7 8.E 9.: 1 846.30 858.85 870.33 884.14 210.48 211.93 211.00 212.03 211.26 210.98 214.43 215.98 217.38 216.35 217.42 218.73 217.76 218.16 219.07 L 11.56 12.03 12.72 13.13
es in gross d
uct volume
(T/T1 %)
I 0.9 1.5 1.3 1.6 0.4 0.7 0 . 4 0.5 0 . 4 0 . 1 1.6 0.7 0.7 0 . 5 0.5 0.6 0 . 4 0.2 0.4 L 2.e 4.1 5.7 3.2 NL 326.96 339.35 351.78 359.75 77.00 77.86 78.25 78.96 79.25 80.02 80.95 81.96 82.85 83.65 84.18 84.60 85.58 86.21 86.85omestic
erms
NL 3.0 3.8 3.7 2.3 0.2 1.1 0.5 0.9 0.4 1.0 1.2 1.2 1.1 1.0 0.6 0.5 1.2 0.7 0.8 A 180.16 184.70 190.70 195.01 44.46 44.65 45.08 45.00 45.37 45.54 45.75 46.30 47.00 47.45 47.71 47.71 47.79 47.96 A 2.0 2.5 3.3 2.3 0.6 0.4 1.0 0 . 2 0.8 0.4 0.5 1.2 1.5 1.0 0.5 0.0 0.2 0.3 Ρ 56.21 58.15 60.18 62.11 13.89 13.96 14.09 13.87 14.28 14.33 14.57 14.40 14.84 14.92 15.10 14.90 15.26 Ρ 3.2 3.5 3.5 3.2 3.3 0.5 0.9 1 . 6 3.0 0.4 1.7 1 . 2 3.0 0.6 1.2 1 . 3 2.4 FIN 102.34 108.06 114.10 118.35 24.57 25.16 25.27 25.79 26.17 26.16 26.96 27.33 27.67 28.09 28.40 28.71 28.96 29.05 29.34=k/
eurostal
Produit intérieur brut
Mrd euro(')
1995
s
151.08 153.74 158.16 161.61 44.29 44.46 44.62 44.97 45.05 45.26 45.33 45.85 46.43 46.02 46.87 47.18 47.84 UK 881.73 912.69 933.14 943.80 216.62 218.36 219.49 220.88 222.87 225.31 227.23 229.48 230.55 231.80 232.88 234.12 234.23 234.53 235.71 US 5749.29 5975.32 6207.21 6336.75 1402.16 1413.71 1434.64 1442.06 1457.07 1472.19 1486.53 1501.88 1512.84 1533.41 1540.37 1554.32 1577.16 1593.99 1601.11 JP 4130.03 4187.45 4066.03 4088.97 999.95 1029.38 1031.78 1034.72 1050.90 1068.11 1041.54 1052.28 1042.51 1029.83 1022.35 1019.40 1010.95 1030.93 1033.21Evolution du produit intérieur
brut volume
(T/T1 %)
FIN4.1 5.6 5.6 3.7 0 . 2 2.4 0.5 2.1 1.5 0 . 1 3.1 1.4 1.3 1.5 1.1 1.1 0.9 0.3 1.0 S 1.3 1.8 2.9 2.2 0 . 6 0.4 0.4 0.8 0.2 0.5 0.2 1.1 1.3 0 . 9 1.9 0.7 1.4 UK 2.6 3.5 2.2 1.1 0.6 0.8 0.5 0.6 0.9 1.1 0.9 1.0 0.5 0.5 0.5 0.5 0.1 0.1 0.5 US 3.5 3.9 3.9 2.1 0.7 0.8 1.5 0.5 1.0 1.0 1.0 1.0 0.7 1.4 0.5 0.9 1.5 1.1 0.5 JP 5.2 1.4 2 . 9 0.6 0.8 2.9 0.2 0.3 1.6 1.6 2 . 5 1.0 0 . 9 1 . 2 0 . 7 0 . 3 0 . 8 2.0 0.2 C)Vor 1/1/1999 un ECU
Die Daten für EU15 und EUR11 wurden in einer zusammenhängenden Weise errechnet, die alle verfügbaren Daten der Mitgliedstaaten, die vierteljährliche Ergebnisse bereitstellen, verwendet.
Vierteljährliche Daten : NL. A, P, US und JP Inlandskonzept Jahrliche Daten : A, EL, L und Ρ Inlandskonzept
C)ECU before 1/1/1999
Data for EU15 and EUR11 are calculated statistically using data available from those Member States which compile quaterly accounts.
Quaterly data : NL, A, P, US and JP under national concept Annually data : A, EL, L and Ρ under national concept
C)ECU avant 1/1/1999
VOLKSWIRTSCHAFTLICHE GESAMTRECHNUNGEN ESVG 95
NATIONAL ACCOUNT ESA 95
COMPTES NATIONAUX SEC 95
=
Jf
eurostal
(
1996 E 1997 1998 1999 1995 V 1996 I II III IV 1997 I II III IV 1998 I II III IV 1999 I I)103
EU-15 3810.45 3881.02 3995.03 4066.12 930.62 938.91 940.19 945.98 948.47 951.94 958.97 960.60 969.59 978.18 984.67 990.80 996.2B 1004.34 1007.74Privater Endverbrauch
Mrd Euro(")
1995
EUR-11 3010.24 3052.76 3140.62 3226.68 742.90 748.66 748.81 753.49 754.18 756.30 760.44 761.10 767.72 774.83 779.87 785.41 788.91 794.68 795.81 Β 115.14 117.74 121.72 124.62 28.64 28.70 28.78 28.76 28.92 29.20 29.33 29.51 29.73 30.43 30.32 30.53 30.46 31.18 DK 71.58 74.25 76.86 78.41 17.52 17.71 17.80 17.95 18.12 18.18 18.79 18.39 18.87 18.89 19.28 19.27 19.43 19.42 19.10 D 1076.59 1084.57 1109.41 1138.58 267.75 267.85 268.60 269.83 270.31 270.84 272.18 270.52 272.23 275.97 275.75 278.15 279.17 281.20 279.92 EL 35.4C 36.3" 37.02 37.7E E 272.67 280.51 292.05 302.80 67.24 68.17 67.37 68.55 68.71 69.54 69.49 70.49 71.12 71.37 72.75 73.50 74.57 74.91 75.92 F 668.00 669.26 691.93 711.13 164.58 167.65 166.46 168.14 166.00 166.06 166.33 167.41 169.76 170.96 173.18 174.16 175.25 175.65 176.69Private final consumption
Bn euro(')
1995
IRL 25.16 26.7Í 28.9Í 31.12 I 502.46 515.38 524.26 533.59 125.03 125.11 125.10 125.60 126.58 127.69 128.89 129.26 129.48 129.97 131.05 131.65 131.52 132.15 132.68 L 5.9S 6.14 62i 6.41 NL 161.86 166.15 173.04 179.28 46.03 46.34 46.43 47.00 47.25 47.54 48.04 48.12 48.97 49.38 50.06 50.73 51.13 51.82 A 101.45 102.19 103.89 106.16 25.20 25.84 26.33 25.84 26.31 26.58 26.64 26.88 27.11 27.17 27.49 27.64 27.67 27.87 Ρ 37.12 38.24 40.37 41.94 9.05 9.28 9.26 9.25 9.34 9.47 9.49 9 5 9 9.69 9.90 10.09 10.15 10.22Consommation finale privée
Mrd euro(')
1995
FIN 52.90 54.44 57.43 59.63 12.90 13.20 13.14 13.16 13.42 13.46 13.56 13.59 13.86 14.02 14.25 14.42 14.76 14.69 14.76 S 74.40 75.89 77.85 79.95 23.24 23.39 23.22 23.58 23.60 23.61 24.02 23.99 24.07 24.19 24.40 24.69 24.88 UK 567.84 589.94 609.77 623.37 138.24 140.38 141.42 142.21 143.67 144.73 146.97 148.21 149.86 151.03 152.08 152.42 154.05 156.46 158.15us
3908.13 4040.63 4237.79 4388.75 955.63 964.28 975.49 979.94 986.99 997.43 1001.40 1016.67 1023.66 1038.89 1054.32 1064.92 1078.12 1095.77 1108.08 JP 2431.42 2456.10 2428.45 2411.03 600.88 609.65 607.77 608.66 615.43 637.40 605.27 614.75 608.88 610.92 610.07 609.23 608.30 615.89 621.03Veränderung des privaten
0104 Endverbrauch Volumen
(T/T1 %)
EU-15 EUR-11 Β DK D
Changes in private final
consumptionvolume terms
(T/T-1 %)
EL IRL NL
Evolution de la consommation
finale privée volume
(T/T1 % )
P FIN S U K U S
JP
1996 1997 1998 1999 1995 IV 1996 I I 1.7 1.9 2.9 2.6 1.3 1.4 2.9 2.7 1.2 2.3 3.4 2.4 3.0 3.7 3.5 2.0 0.8 0.7 2.3 2.6
1.9 2.1 2.6 2.9 1.8 4.1 2.0 3.7
1.3 0.2 3.4 2.8 6.1 6.3 6.3 7.5 0.6 2.6 1.7 1.8 2.1 2.5 1.8 4.0 2.7 4.2 2.0 07 1.7 2.2 2.5 3.0 5.6 3.9 3.5 2.9 5.5 3.8 1.3 2.0 2.6 2.7 3.6 3.9 3.4 2.2 32 3.4 4.9 3.6 3.0 1.0 1.1 07
IV
1997 I IIV
1998 I IIV
1999 I 0.1 0.9 0.1 0.6 0.3 0.4 0.7 0.2 0.9 0.9 0.7 0.6 0.6 0.8 0.3 0.0 0.8 0.0 0.6 0.1 0.3 0.6 0.1 0.9 0.9 07 0.7 0.5 07 0.1 0.5 0.2 0.3 0.1 0.5 1.0 0.4 0.6 0.7 2.4 0.4 0.7 0.3 2.4 0.0 1.1 0.5 0.8 1.0 0.3 3.3 2.1 2.6 0.1 2.0 0.1 0.8 0.0 1.7 0.3 0.0 0.3 0.5 0.2 0.2 0.5 0.6 0.6 1.4 0.1 0.9 0.4 0.7 0.5 0.7 1.4 1.2 1.8 0.2 1.2 0.1 1.4 0.9 0.4 1.9 1.0 1.5 0.5 1.4 0.2 1.9 ο iο 1.3 0.0 0.2 0 7 1.4 0.7 1.3 0.6 0.6 0.2 0.6 0.2 0.1 0.0 04 0.8 0.9 0.9 0.3 0.2 0.4 0.8 0.5 0.1 0.5 0.4 0.2 0.7 0.2 1.2 0.5 0.6 1.1 0.2 1.8 0.8 1.4 1.3 08 1.4 0.6 2.6 1.9
1.9
1.8
1.0 0.2 0.9 0.9 0.2 1.2 0.6 0.1 0.8 0.6 2.6 0.2 0.1 1.0 1.4 0.3 1.0 1.0 2.2 2.0 0.6 0.7 1.4 2.4 0.5 0.2 2.0 0.3 0.7 0.2 2.0 1.2 1.7 1.2 2 3 0.4 0.4 0.5 0.6 0.7 1.6 0.1 0.0 1.7 0.1 0.3 0.5 0.9 1.2 0.8 1.0 1.6 0.7 0.6 1.0 Ο Ι.6 0.9 1.1 0.8 0.7 02 1.1 1.6 1.1 0.6 0.9 1.2 0.5 0.7 1.1 0.4 1.5 Ο Ι.5 1.5 L O 1.2 1.6 1.1 0.4 1.5 0.3 0.2 1.1 36 5.0 1.6 1.0 03 0.1 0.1 0.2 1.3 0.8 (•(Vor 1/1/1999 un ECUDie Daten für EU15 und EUR11 wurden in einer zusammenhängenden Weise errechnet, die aile verfügbaren Daten der Mitgiiedstaaten, die vierteljährliche Ergebnisse bereitstellen, verwendet.
Vierteljahrliche Daten : NL, A, P, US und JP Inlandskonzept
(')ECU before 1/1/1999
Data for EU15 and EUR11 are calculated statistically using data availablefrom those Member States which compile quaterly accounts.
Quaterly data : NL, A, P, US and JP under national concept
C)ECU avant 1/1/1999
1995 IV 1996 I I 1997 I I 1998 I I
IV
IV
VOLKWIRTSCHAFTLICHE GESAMTRECHNUNGEN ESVG 95
NATIONAL ACCOUNTS ESA 95
COMPTES NATIONAUX SEC 95
m
Endverbrauch des Staates
0105 MrdEuro(')
1995
Final consumption of general
government
Bn euro(*)1995
eurostat
Commation finale des administrations
publiques
Mrd euro(') 1995
EU-15 EUR-11 DK EL IRL NL FIN UK US
1999 I 338.60 337.57 339.60 341.26 342.42 339.84 34027 341.31 340.64 344.15 344.64 345.02 344.83 349.22 350.38 273.15 271.83 273.25 275.01 276.11 274.34 274.85 275.61 275.14 27828 278.44 278.60 277.93 281.62 282.52 11.42 11.50 11.58 11.62 11.55 11.50 11.50 11.48 11.54 11.70 11.70 11.84 11.92 11.95 9.04 9.10 9.14 9.24 9.20 9.23 9.26 9.29 9.29 9.45 9.51 9.57 9.62 9.61 9.64 96.13 94.00 94.69 95.92 95.87 94.42 94.16 94.26 93.36 95.49 94.85 94.48 93.14 95.60 95.22 20.30 20.35 20.43 20.48 20.59 20.73 20.93 21.13 21.28 21.42 21.44 21.42 21.49 21.56 21.61 71.32 72.04 72.39 72.56 73.04 73.29 73.53 73.90 74.02 74.27 74.48 74.50 74.64 74.90 75.20 38.55 38.70 38.83 39.04 39.01 38.71 38.66 38.69 38.77 38.86 39.08 39.23 39.59 39.85 40.08 10.94 10.92 11.14 11.08 11.14 11.10 11.18 11.30 11.35 11.42 11.45 11.56 11.62 11.72 8.93 8.94 8.94 8.96 8.98 8.60 8.58 8.62 8.63 8.68 8.76 8.68 8.74 8.70 2.32 2.33 2.34 2.34 2.36 2.37 2.38 2.40 2.42 2.44 2.46 2.48 2.49 5.69 5.71 5.74 5.76 5.81 5.84 5.92 5.96 5.98 5.94 6.00 6.04 6.05 5.98 6.03 11.30 11.22 11.27 11.58 11.47 11.02 11.09 11.34 11.17 11.27 11.32 11.41 11.48 42.53 42.69 43.27 43.12 43.21 42.40 42.38 42.66 42.44 42.58 42.77 42.94 43.27 43.99 44.27 JP 1996 1997 1998 1999 1372.37 1374.56 1392.07 1412.96 1100.68 1105.14 1119.10 1133.82 46.24 46.02 47.14 47.73 36.66 37.05 38.14 38.75 380.41 376.10 377.84 382.11 6.85 6.82 6.85 6.78 81.80 84.03 85.74 87.42 290.08 294.89 298.23 300.56 5.77 6.05 6.23 6.48 155.59 154.85 156.78 158.87 1.42 1.42 1.43 1.48 75.94 78.47 81.06 83.49 35.83 34.43 34.87 35.39 9.36 9.56 9.87 10.07 23.01 23.68 24.01 24.31 40.31 39.48 40.22 40.60 172.32 169.92 171.59 176.74 875.77 887.28 896.80 911.12 393.01 398.98 401.48 404.75 215.38 216.33 219.96 219.71 219.51 220.07 222.15 222.19 222.61 221.20 224.42 224.18 226.74 226.63 226.76 97.67 98.18 98.02 97.83 100.73 98.26 100.78 101.96 99.75 100.45 100.61 101.38 100.82 101.59 101.14
Veränderung des Endverbrauch des
0106
StaatesVolumen
(T/T-1 %)
Changes in the final consumption of
general government volume terms
(T/T1 %)
EU-15 EUR-11 DK EL
Evolution de la consommation finale
des administrations publiques volume
(T/T-1 %)
IRL NL FIN UK US JP
1996 1997 1998 1999
1995 IV 1996 I II III IV 1997 I II III IV 1998 I II III IV 1999 I II 1.8 0.2 1.3 1.5 1.1 0 . 3 0.6 0.5 0.3 0 . 8 0.1 0.3 0 . 2 1.0 0.1 0.1 0 . 1 1.3 0.3 1.8 0.4 1.3 1.3 1.3 0 . 5 0.5 0.6 0.4 0 . 6 0.2 0.3 0 . 2 1.1 0.1 0.1 0 . 2 1.3 0.3
2.4 0 . 5 2.4 1.3 1.0 0.7 0.7 0.3 0 . 6 0 . 4 0.0 0 . 2 0.5 1.4 0 . 0 1.2 0.7 0.3 3.2 1.1 3.0 1.6 1.3 0.7 0.4 1.0 0 . 4 0.3 0.4 0.3 0 . 0 1.8 0.7 0.6 0.6 0 . 2 0.3
2.2 1.C 1 . 1 0.4 0.5 0.4 1.1 1.C 3.1 2 . 2 0.7 1.3 0 . 1 1 . 5 0 . 3 0.1 1 . 0 2.3 0 . 7 0 . 4 1 . 4 2.6 0 . 4
1.3 2.7 2.0 2.0 0.1 0.2 0.4 0.2 0.6 0.6 1.0 0.9 0.7 0.7 0.1 0 . 1 0.3 0.3 0.3
2.3 1.5 1.7 4.6 1.1 3.C 0.8 4.C 0.1 1.0 0.5 0.2 0.7 0.4 0.3 0.5 0.2 0.3 0.3 0.0 0.2 0.4 0.4
1.4 5.1 0 . 5 O.C 1.3 O.E 1.3 3.E 0.8 0.4 0.4 0.5 0 . 1 0 . 8 0 . 2 0.1 0.2 0.2 0.6 0.4 0.9 0.6 0.6
0 . 4 3.3 3.3 3.0 0 . 3 0 . 2 2.0 0 . 6 0.6 0 . 3 0.7 1.1 0.5 0.6 0.3 0.9 0.5 0.9 0.6 3 . 9 1.3 1.5 0.2 0.1 0.0 0.2 0.2 4 . 3 0 . 2 0.4 0.2 0.7 0.9 0 . 9 0.6 0 . 4
1.8 2.1 3.3 2.1 0.5 0.4 0.4 0.4 0.4 0.5 0.6 0 7 0.9 1.0 0.9 0 7 0.6 2.5 2.9 1.4 1.2 0.8 0.3 0.7 0.3 0.9 0.5 1.3 0.7 0.4 0 . 8 1.1 0.6 0.2 1 . 1 0.8
0 . 2 2 . 1 1.9 0.9 0 . 8 0 . 7 0.4 2.7 0 . 9 3 . 9 0.7 2.2 1 . 5 0.9 0.4 0.8 0.6
1.7 1 . 4 1.0 3.0 0.5 0.4 1.4 0 . 4 0.2 1 . 9 0 . 1 0.7 0 . 5 0.4 0.4 0.4 0.8 1.7 0.7 0.7 1.3 1.1 1.6 1 . 4 0.4 1.7 0 . 1 0 . 1 0.3 1.0 0.0 0.2 0 . 6 1.5 0.1 1.1 0 . 1 0.1 1.8 1.5 0.6 0.8 0.5 0.5 0 . 2 0 . 2 3.0 2 . 5 2.6 1.2 2 . 2 0.7 0.2 O.B 0 . 6 0.8 0 . 4 C)Vor 1/1/1999 un ECU
Die Daten für EU15 und EUR11 wurden ¡n einer zusammenhangenden Weise errechnet, die alle verfügbaren Daten der Mitgliedstaaten, die vierteljährliche Ergebnisse bereitstellen, verwendet.
Vierteljahrliche Daten : NL, A, P, US und JP Inlandskonzept Jahrliche Daten : A, EL, L und Ρ Inlandskonzept
(*)ECU before 1/1/1999
Data for EU15 and EUR11 are calculated statistically using data availablefrom those Member States which compile quaterly accounts.
Quaterly data : NL, A, P, US and JP under national concept Annually data : A, EL, L and Ρ under national concept
(')ECU avant 1/1/1999
Les données d'EU15 et EUR11 sont calculées selon un cadre statistique utilisant comme indicateurs les données de tous les Etats membres quiélaborent une comptabilité trimestrielle. Données trimestrielles : NL, A, P, US et JP en concept national
VOLKSWIRTSCHAFTLICH GESAMTRECHNUNGEN ESVG 95
NATIONAL ACCOUNTS ESA 95
COMPTES NATIONAUX SEC 95
=
Jr
eurostal
(
1996 E 1997 1998 1999 1995 V1996 I II III IV 1997 I II III IV 1998 I II III IV 1999 I I
)107
EU-15 1315.54 1354.50 1423.18 1462.46 322.47 319.50 328.24 330.39 330.07 327.52 335.77 338.60 344.02 350.82 347.90 356.93 358.45 366.90 367.69Bruttoanlageinvestitionen
Mrd Euro( )
1995
EUR-11 1093.57 1116.87 1163.50 1203.71 270.69 266.85 274.78 276.21 275.72 272.90 278.62 280.70 284.73 289.36 286.81 293.50 293.93 301.40 301.84 Β 43.23 45.97 47.64 49.25 10.78 10.72 10.74 10.79 11.00 10.95 11.99 11.22 11.81 11.55 11.80 12.20 12.10 12.10 DK 26.90 29.67 31.78 32.59 6.71 6.466 6 1 6.84 7.02 7.07 7.50 7.58 7.59 8.03 7 8 9
7.97 7.97 8.29 8.06 D 417.32 419.29 425.18 432.67 103.98 99.55 106.28 106.49 105.80 103.61 104.94 105.85 105.90 107.50 104.14 106.92 105.69 109.00 108.36 EL 10.7E 11.82 12.9C 14.3C E 100.21 105.19 114.87 124.49 24.78 24.29 25.12 25.89 24.94 25.52 25.93 26.75 27.02 28.09 28.03 28.97 29.81 30.32 31.28 F 223.24 224.36 237.11 246.74 55.89 55.75 55.93 55.91 55.85 55.01 55.87 56.35 57.28 58.06 59.15 60.11 60.80 62.14 62.76
Gross fixed capital formation
Bn euro(')
1995
IRL 7.8Í 8.71 9.a: 10.9/ I 157.38 158.771 6 4 2 5
168.94 39.40 39.76 39.45 39.09 39.07 39.03 39.41 39.71 40.61 41.13 40.88 41.15 41.07 41.64 42.07 L 2.51 2.84 2.90 2.99 NL 68.48 72.52 76.32 77.27 14.53 14.94 14.98 15.43 15.89 15.99 16.39 16.38 16.63 16.82 16.77 17.09 17.36 18.19 A 43.08 44.28 46.47 48.52 10.57 10.65 10.74 10.65 10.97 10.87 10.83 11.06 11.42 11.91 11.52 11.55 11.48 12.04 Ρ 16.23 18.14 19.89 21.23 3.91 3.80 3 9 5 4.05 4.43 4.34 4.51 4.50 4.7B 4.86 4.93 4.81 5 2 9
Formation brute de capital fixe
Mrd euro(')
1995
FIN 17.19 19.20 20.93 22.33 3.88 4.22 4.21 4.36 4.41 4.39 4.83 4.97 5.02 4.98 5 1 5 5.36 5.44 5.39 5.50s
25.05 23.86 26.15 27.34 6.68 6.75 6 6 5 6 7 5 6.58 6.19 6 5 7 6.27 6.42 G.61 6 9 6 7.11 7 2 0UK 147.25 158.36 173.97 178.59 35.29 36.40 36.63 37.05 37.11 37.60 39.49 40.05 41.15 42.51 42.38 44.08 44.93 45.13 45.27
us
1014.81 1087.25 1192.00 1243.42 238.66 245.45 252.74 256.73 259.59 263.47 268.99 276.36 278.08 289.38 296.41 299.08 306.76 316.39 321.64 JP 1245.34 1219.47 1110.00 1054.03 291.12 307.05 315.17 312.37 314.92 313.17 305.66 304.87 299.85 288.50 278.70 274.72 271.79 285.75 281.49Veränderung der
0108 Bruttoanlageinvestitionen Volumen
(T/T1 %)
EU-15 EUR-11 DK EL
Changes in gross fixed capital formation
volume terms
(T/T1 %)
IRL NL
Evolution de la formation
brute de capital fixe volume
(T/T-1 %)
FIN S UK US JP
1996 1997 1998 1999 1995 IV 1996 I II III IV 1997 I II III IV 1998 I II III IV 1999 I II 1.6 3.0 5.1 3.4 0.0 0 . 9 2.7 0.7 0 . 1 0 . 8 2.5 0.8 1.6 2.0 0 . 8 2.6 0.4 2.4 0.2 0.9 2.1 4.2 3.5 0 . 1 1 . 4
3.0
0.5 0 . 2 1 . 0 2.1
o.e
1.4 1.6 0 . 9 2.3 0.2 2.5 0.2 0.9 6.3 3.6 3.4 0 . 6 0 . 6 0.2 0.5 1.9 0 . 4 9.5 6 . 4
5.3
2 . 2 2.1
3.5
0 . 9 0.1 5.0 10.3 7.1 2.5 3.4
3 . 8 2.3 3.4 2.7 0.6 6.2 1.1 0.0 5.8 1 . 8 1.1 0 . 1 4,0 2 . 8
1 . 1 8.£ 0.5 9.6 1.4 9.7 1.8 10.6 1 . 6 ^1.3 6.8 0.2 0 . 7 2 . 1 1.3 0.9 0.1 1.5 3 . 1 2.7 1 . 2 3.1 0 . 6
2.0 5.0 9.2 8.4 3.5 2 . 0 3.4 3.1 3 . 7 2.3 1.6 3.1 1.0 4.0 0 . 2 3.3 2.9 1.7 3.2
0 . 0 13.7 0.5 10.Í 5.7 13.C 4.1 11.i 0.4 0 . 3 0.3 0 . 0 0 . 1 1 . 5 1.6 0.9 1.7 1.4 1.9 1.6 1.1 2.2 1.0
2.3 2 . Í 0.9 13.2 3.5 2.2 2.9 3.C 1.1 0.9 0 . 8 0 . 9 0 . 0 0 . 1 1.0 0.8 2.3 1.3 0 . 6 0.6 0 . 2 1.4 1.0 6.3 5.9 5.2 1.3 0.1 2.8 0.3 3.0 3.0 0.6 2.5 0 . 1 1.6 1.1 0 . 3 1.9 1.6 4.8 2.5 2.8 4.9 4.4 0.5 0.8 0.8 0 . 8 3.0 0 . 9 0 . 4 2.1 3.2
4.3
3 . 3 0 3 0 . 6 4.9 5.7 11.8 9.7 6.7 5 7 2 . 9 3.8 2.7 9.2 1 . 8
3.9
0 . 3 6.2 1.7 1.4 2 4 9.9
8.4
11.7
9.0 6.7 3 . 2 8.6 0 . 1
3.4 1.3
0 . 5 10.0 2.9 1.1 0 . 9
3.5 4.1 1.5
1 . 1 2 0
3 7 4 . 8 9.6 4.6 1.3
1.0
1 . 5 1.5 2 . 6 5 . 9 6 2 4 . 7 2.4 3.1 5.3 2.1 1.3 4.9 7.5 9.9 2.7 0 . 5 3 2 0.6 1.1 0.2 1.3 5.0 1.4 2.B 3.3 0 . 3 4.0 1.9 0.4 0.3 7.8 7.1 9 6 4.3 1.7 2 8 3.0 1.6 1.1 1 5 2.1 2.7 0 6 4.1 2.4 0.9 2.6 3.1 1 7 11.6 2 . 1 9 . 0 5 . 0
3.4
5 5 2.7 0 . 9 0.8 0 . 6 2 . 4 0 . 3 1 . 6 3 8 3 . 4 1.4 1.1 5.1 1 . 5 (*)Vor 1/1/1999 un ECU
Die Daten für EU15 und EUR11 wurden in einer zusammenhängenden Weise errechnet, die alle verfügbaren Daten der Mitgliedstaaten, die vierteljährliche Ergebnisse bereitstellen, verwendet.
Vierteljährliche Daten : NL, A, P, US und JP Inlandskonzept
(*}ECU before 1/1/1999
Data for EU15 and EUR11 are calculated statistically using data availablefrom those Member States which compile quaterly accounts.
Quaterly data : NL, A, P, US and JP under national concept
(')ECU avant 1/1/1999
1995 IV 1996 I
I
IV 1997 I
I
1 9 9 8 I I IV
IV 1999 I
II
VOLKSWIRTSCHAFTLICHE GESAMTRECHNUNGEN ESVG 95
NATIONAL ACCOUNTS ESA 95
COMPTES NATIONAUX SEC 95
=2
Vorratsveränderungen und
0109 Nettozugang an Wertsachen
MioEuroO1995
Changes in inventories and
acquisitions less disposals of
valuables Mio euro(') 1995
eurostat
Variations de stocks et acquisitions
moins cessions d'objets de valeur
Mio euro(') 1995
EU-15 EUR-11 DK EL IRL NL FIN UK US
7031
5667 901 -1922
785 3673 6616
5602 11212 12438 16274 14121 20102
9082 8841
4682 4113 752 -2488 -843
1671
5347
4715
9708 10725 13671 11568 17975
9161
10771
11
-815
209 275 24 B91
-758 17
435 387 463 472
-534 -720
594 230 288 156 279 245 44 299 to
206 330 279 338
-730 -226
851 1862
-1064 -2606 -1330
585
1011
745
2659 2766
5532
3617
8085 2553
4893
-89
76 868 36 510 530 746
-795
522
161
70 986 269
913
-845
304
-1621
294 754 21 693 448 2382 1698 521 2260 1538 1177
2793 2075 -613
908 547 523
2800
2344 3944 3271 3235 3025
3833 4355
4101
31 108 505 61 87 6 277 167 44 866 26 25 132 650
82 173 168 298 217 239 168 279 201 340 361 465 413
252 471 81 286 302 123 276
-177
226 5 305 191
-143
275 5
320 39 128 286 73 789 410 28 748 733 1048 145 217
1303 1015 39 556 429 1654 960 540 1348 1237 2074
2197
1354 804
-933 4216 3363 5602
9986 6512
11654 16265 10941 14042
19115 9525
13139 10655 10751 6713
JP
1996
1997
1998
1999
3533 25760 59453
677
19523 49755
770
-1191
783 690
397 562 1133 1118
2695 4664
18498 16040
163 291 313 308
1271 1006 1490
-1693
707
7307 7307
508 681
-2
273 1814 8521
13294 11368
153 141 365 33
647
418
615 190 3202 3861 3822
858 888 1580 1945
192 488 1307 3597
510 587 1160 752
1984 4556 6946 1865
25239 50515 52629 51905
16825 25821 22416
337 4761 3188 4079 4764 2524 7219 7931 8188 6233 5427 5497 4284 4106 5611
Vorratsveränderungen und
0110 Nettozugang an Wertsachen(1)
Volumen% des BIP
EU-15 EUR-11 DK EL
Changes in inventories and
acquisitions less disposals of
valuables(
1)volume terms% of
T '
IRL NL
Variations de stocks et acquisitions
moins cessions d'objets de valeur(1)
volume %du PIB
FIN UK
us
JP1996
1997
1998
1999
1995 IV 1996 I
II
IV 1997 I
I
IV 1998 I
IV 1999 I
II
Daten vorläufig nicht verfügbar C)Vor 1/1/1999 un ECU
Die Daten für EU15 und EUR11 wurden in einer zusammenhängenden Weise errechnet, die alle verfügbaren Daten der Mitgliedstaaten, die vierteljährliche Ergebnisse bereitstellen, verwendet.
Vierteljahrliche Daten : NL. A, P, US und JP Inlandskonzept
Data currently unavailable (*)ECU before 1/1/1999
Data for EU15 and EUR11 are calculated statistically using data availablefrom those Member States which compile quaterly accounts.
Quaterly data : NL, A, P, US and JP under national concept
Données actuellement indisponibles C)ECU avant 1/1/1999
VOLKSWIRTSCHAFTLICHE GESAMTRECHNUNGEN ESVG 95
NATIONAL ACCOUNTS ESA 95
COMPTES NATIONAUX SEC 95
ΈΔ
eurostat
1996 1997 1998 1999 1995 1996 IV I II III IV 1997 I II III IV 1998 I 1999 II III IV I II0111
EU-15 2016.72 2212.87 2337.11 2420.11 487.62 498.80 498.98 508.64 522.12 529.88 547.36 568.91 578.53 583.96 590.86 592.28 583.10 582.91 591.95Ausfuhr von Waren und
Dienstleistungen
Mrd Euro(') -1995
EUR-11 1610.14 1770.52 1881.52 1950.89 392.04 401.18 400.21 408.60 419.44 425.24 439.85 458.62 466.93 472.81 479.19 478.99 471.80 472.32 480.15 Β 149.72 160.31 165.80 170.90 36.93 37.40 37.37 37.05 37.92 38.60 39.56 41.00 41.19 41.31 42.30 41.26 40.96 39.95 DK 51.20 53.45 54.18 55.70 12.14 12.60 12.94 12.76 12.91 12.93 13.18 13.51 13.80 13.66 12.90 14.00 13.62 13.86 14.02 D 483.74 536.53 574.02 591.12 116.47 118.55 118.82 121.06 126.19 128.22 131.95 138.20 139.69 142.57 144.82 144.82 140.49 141.72 144.76 EL 8.92 9.32 10.2Î 10.84 E 111.43 128.30 137.42 145.63 25.83 26.79 27.10 28.26 29.33 29.95 31.68 32.93 33.81 33.97 34.42 34.43 34.67 35.67 36.22 F 276.67 306.32 325.41 336.71 66.91 68.45 68.15 69.28 70.67 72.35 75.21 77.90 80.30 81.01 81.67 82.69 81.53 80.53 82.01Exports of goods and services
Bn euro(')
1995
IRL 39.61 46.32 55.36 63.5C I 210.72 221.20 223.85 226.09 51.05 52.99 51.68 52.42 53.55 52.85 54.24 56.59 57.43 57.05 56.17 56.03 54.52 54.13 54.86 L 12.3·' 13 47 14.62 15.42 NL 190.62 207.76 221.05 229.37 41.25 42.13 41.58 43.34 43.21 43.71 44.57 46.28 47.14 47.24 48.34 48.39 48.76 49.32 A 73.05 80.42 86.98 91.14 17.41 17.60 18.03 18.59 18.73 19.39 19.65 20.29 20.97 21.32 22.18 21.36 21.83 21.02 Ρ 23.15 25.03 26.98 28.53 5.57 5.80 5.82 5 7 8 5.766.03
6.26
6.30
6.44 6 6 9 6.63 6.94 6.52 FIN 38.92 44.44 48.73 50.70 9.14 9.22 9.75 9.78 10.19 10.28 10.97 11.74 11.47 12.47 11.96 12.25 12.08 12.03 12.21
Exportations de biens et
services
Mrd euro(')1995
s
64.04 72.24 77.51 80.86 18.36 18.60 19.09 19.27 19.88 20.15 21.90 22.24 22.40 22.47 22.71 23.94 23.94 UK 262.55 285.09 290.93 298.09 62.75 63.92 64.88 65.93 67.70 69.16 70.88 72.20 72.73 72.12 73.00 73.44 72.23 71.25 72.77us
679.80 766.71 778.37 800.41 163.17 164.65 167.00 167.87 179.96 183.57 190.33 195.17 197.28 195.92 192.01 190.66 199.41 196.82 198.92 J P 391.36 436.96 427.19 446.65 92.66 94.74 94.68 99.17 103.79 106.19 110.29 109.95 111.65 108.57 106.43 108.36 104.93 104.96 105.90Veränderung der Ausfuhr von Waren
0112 und Dienstleistungen Volumen
(T/T1 %)
Changes in exports of goods and services
volume terms
(T/T1 %)
Evolution des exportations de
biens et services volume
(T/T1 %)
1996 1997 1998 1999 1995 IV 1996 I II III IV 1997 I II III IV 1998 I II III IV 1999 I II EU-15 4,9 9.7 5.6 3.6 1.2 2.3 0.0 1.9 2.7 1.5 3.3 3.9 1.7 0.9 1.2 0.2 1 . 6 0 . 0 1.6 EUR-11 4.6 10.0 6.3 3.7 1.1 2.3 0 . 2 2.1 2.7 1.4 3.4 4.3 1.8 1.3 1.4 0 . 0 1 . 5 0.1 1.7 Β 1.2 7.1 3.4 3.1 0.9 1.3 0 . 1 0 . 9
2.4 1.8 2.5 3.6 0.5 0.3 2.4 2 . 5 0 . 7 2 . 5
DK 5.0 4.4 1.4 2.8 0.3 3.8 2 8 1 . 4 1.1 0.1 2.0
2.5
2.1 1 . 0 5 . 6
8.6
2 . 8 1.8 1.2
D EL
5.1 3.1 10.9 5.2 7.0 9.2 3.0 5.7 1.6 1.8 0.2 1.9 4.2 1.6 2.9 4.7 1.1 2.1 1.6 3 . 0 0.9 2.2 E 10.3 15.1 7.1 6.0 2.2 3.7 1.2 4.3 3.8 2.1 5.8 4.0 2.7 0.5 1.3 0.0 0.7 2.9 1.6
F IRL
3.5 11.E 10.7 17.C 6.2 19.Ï 3.5 14.7 0.4 2.3 0 . 4 1.7 2.0 2.4 4.0 3.6 3.1 0.9 0.8 1.3
- 1 . 4 - 1 . 2 1.8
I L
1.5 6.2 5.0 9.2 1.2 8.E 1.0 5.6 0 . 5
3.8 2 . 5 1.4 2.2 1 . 3 2.6 4.3 1.5 0 . 7 1 . 5 0 . 2 2 . 7 0 . 7 1.4 NL 4.6 9.0 6.4 3.8 1.6 2.2 1 . 3 4.2 0 . 3 1.2 2.0 3.9 1.9 0.2 2.3 0.1 0.8 1.2 A 6 9 1 0 1 8.2 4.8 2.2 1.1 2.5 3 1 0.8 . 3.5 1.3 3.3 3 3 1.7 4,1 3 . 7 2.2 3 . 7
Ρ 7 6 8.1 7.8 5 7 3.9 4 2 0.2 0 . 7 0 . 3
4.7 3.8 0.7 2.3 3.9 2.0 1.7 6 . 1
FIN 6.1 14.2 9.6 4.0 2.7 0.8 5.8 0 3 42 0.9 6 7 7.0 2 3 8 7 1 . 1
2.4
1 . 4 0.4 1.5 S 6.1 12.8 7.3 4.3 0.8 1.3 2.7 1.0 32 1.4 8.7 1.6 0.7 0.3 1.1 5.4 0 0 UK 7.5 8.6 2.1 2.5 1.6 1.9 1.5 1 6 2.7 2.2 2 5 1.9 0.7 0 . 8
12
0 6 1 . 7 1 . 4 2 1
us
8.5 12.8 1.5 2.8 2.5 0.9 1.4 0.5 7 2 2.0 3.7 2.5 1.1 0 . 7 2 . 0 0 74.6
1 . 3 1.1
JP
6.2 11.7 2 . 2 4.6
-0.3
2.3 0 . 1
4.7 4.7
2.3 3.9 0 . 3 1.6 2 . 8 2 . 0 1.8
-32
0.0 0 9 C)Vor 1/1/1999 un ECU
Die Daten für EU15 und EUR11 wurden in einer zusammenhängenden Weise errechnet, die alle verfügbaren Daten der Mitglied Staaten, die vierteljährliche Ergebnisse bereitstellen, verwendet.
Vierteljährliche Daten : NL, A, P, US und JP Inlandskonzept
(*)ECU before 1/1/1999
Data for EU15 and EUR11 are calculated statistically using data availablefrom those Member States which compile quaterly accounts.
Quaterly data : NL, A, P, US and JP under national concept
(')ECU avant 1/1/1999