This is a repository copy of Learning from a new learning landscape: Visualisation of location sensing data in the Augustine House Experiment.
White Rose Research Online URL for this paper: http://eprints.whiterose.ac.uk/82808/
Article:
Peng, C. (2013) Learning from a new learning landscape: Visualisation of location sensing data in the Augustine House Experiment. British Journal of Educational Technology, 44 (5). 795 - 809. ISSN 0007-1013
https://doi.org/10.1111/j.1467-8535.2012.01380.x
[email protected] https://eprints.whiterose.ac.uk/
Reuse
Unless indicated otherwise, fulltext items are protected by copyright with all rights reserved. The copyright exception in section 29 of the Copyright, Designs and Patents Act 1988 allows the making of a single copy solely for the purpose of non-commercial research or private study within the limits of fair dealing. The publisher or other rights-holder may allow further reproduction and re-use of this version - refer to the White Rose Research Online record for this item. Where records identify the publisher as the copyright holder, users can verify any specific terms of use on the publisher’s website.
Takedown
If you consider content in White Rose Research Online to be in breach of UK law, please notify us by
Learning from a New Learning Landscape: Visualisation of Location Sensing
Data in the Augustine House Experiment
Chengzhi Peng
Dr Chengzhi Peng is senior lecturer in the School of Architecture, University of Sheffield. He is one of the co-founders of the Digital Design + Performance Group, researching and teaching areas relating to interactive architectural and city modelling. Address for correspondence: Dr Chengzhi Peng, School of Architecture, University of Sheffield, Arts Tower, Western Bank, Sheffield, S10 2TN, UK. Email: [email protected]
Abstract
This paper presents the result from the Augustine House Experiment (AHE) project funded by the UK JISC Institutional Innovation Programme. The AHE project set out to investigate how the location sensing data collected over students’ uses of the iBorrow netbooks inside the Augustine House could be visualised to convey aspects of the new learning landscape during a one-week long location sensing period. Indoor real-time location sensing technologies are considered potential new tools for collecting quantitative data as evidence of emerging patterns of occupation and uses of interior learning spaces. The project tested a data processing and visualisation method designed to render the location sensing and associated user datasets in conjunction with 3-dimensional (3D) digital architectural models of the Augustine House. The research hypothesis is that overlay of the netbooks tracking and anonymised student user data on the 3D architectural floor models could facilitate making-sense the large complex datasets significantly. Lessons and questions are drawn from this experiment regarding how a
combination of location sensing, sensor & user data collection, and interactive architectural modelling could be further developed into a credible research apparatus applicable to longer-term post-occupancy evaluation of learning landscapes that could inform planning and design of future learning spaces.
Introduction
In recent years, the Higher and Further Education (HFE) sector in the UK have commissioned design and construction of new generation Learning Support Centres (LSC) providing spaces and facilities unseen in conventional university/college libraries. These new learning centres are often multi-functional, equipped with cutting edge information and communication technologies, and are
increasingly seen as opportunities to create new corporate visual identities of HFE institutions. Recent examples of LSC include the Information Commons (Lewis, 2010), the Augustine House (Canterbury Christ Church University), the Gateway (Buckinghamshire New University), the Great Central
Warehouse Library (University of Lincoln), just to name a few.
management terms (Pearshouse et al., 2009; Pantidi, 2010; Boys, 2011). The design and opening of the Augustine House – a newly built large-scale learning centre at the Canterbury Christ Church University – is the latest example of the new learning landscape (Poole & Wheal, 2011). A such, the quest for a better understanding of how these new learning spaces perform in response to 21stcentury learners’ as well as educators’ needs continues. What methods may constitute valid Post Occupancy Evaluation (POE) studies into the new learning landscapes? How such POE studies may inform future planning, design, use and management of such learning spaces? This paper seeks to contribute to the discussion of new learning landscapes drawing on the findings from the Augustine House Experiment (AHE) project undertaken by the uCampus team based at the University of Sheffield in collaboration with the iBorrow team at Canterbury.
Background and Related Work
Designed by ADP at the cost of £35m for the Canterbury Christ Church University (CCCU), the
Augustine House (AH) is a new purpose built, large-scale library and student services centre, enclosing some 12,500 square metres of internal floor area in four floors. A month later following the AH grand opening in October 2009, two hundred netbook computers, labelled iBorrow, were deployed inside the building as part of CCCU’s pioneering self-service laptop loan scheme to make student ICT provision easier than borrowing books (Poole et al., 2010). In addition, for research purpose, every iBorrow netbook was turned into a real-time locating device detectable by the building’s wireless infrastructure running a Cisco 3300 Series Mobility Services Engine. It therefore presents an opportunity of acquiring spatial-temporal data of the locations of iBorrow netbooks in use anywhere inside the building.
Whenever an iBorrow netbook is logged on and receiving data via the wireless network it is possible to triangulate its position within the network of 120 wireless transmitters (Cisco Aironet 1242AG radio access points). As such, the technology prompts a hypothesis that a large self-service laptop loan scheme configured with Wi-Fi location sensing software is able to gather a significant amount of data over time, and that an analysis of this data could reveal patterns of ‘learning footprints’ afforded by the Augustine House (Collis, 2010).
Prior to the AHE project, the uCampus platform has been developed at the University of Sheffield as an institutional application in Web-based 3D virtual campus visualisation modelling (Peng et al., 2010). Piloted with the real-world spatial and user context of the Sheffield campus, uCampus hosts 3D models of the campus terrain, buildings, and spaces in the X3D format. Users can freely access 3D
architectural models not only as visualisation of the campus buildings and spaces but also as an intuitive visual context for inspecting complex data. Figure 1 shows an example of visualising spatial uses of a floor of a particular building where 3D spatial taxonomical volumes and open-top
[image:3.612.56.563.593.702.2]architectural floor models are overlaid to form the resultant datascape. The design of uCampus attempts to support the principle of context-rich data visualisation applicable to multiple scales ranging from room to the entire urban campus (Peng, et al., 2009).
The iBorrow Netbook Location Sensing and User Dataset
[image:4.612.77.547.317.736.2]For the AHE project, an iBorrow netbook location tracking and anonymised user dataset was supplied by the iBorrow project team. The dataset covers only a one-week sensing period of 24 February 2010 to 3 March 2010. Given the location sensing capability of sampling every five minutes, the dataset already reaches a total 65,535 records each of which contains 18 data fields. Two sample records extracted from the original dataset are shown in Table 1. The scope of the data fields represents a join-up of anonymised student user information with tracked location of an iBorrow netbook computer used by the student. A research ethics approval and student users’ consensus have been obtained prior to launching the data collection. As shown in one of the data fields, Location, the iBorrow team have attempted a preliminary placing of the netbook tracking locations onto the different zones designated for each of the building floors. To explore a different data visualisation strategy in the AHE context, it was decided to work with the ‘raw’ data, ie. X, Y coordinates, bearing in the mind the Confidence Factor as formulated by the iBorrow team. The steps taken to turn the iBorrow netbook location sensing and user dataset into 3D datascapes are explained in the net section.
Table 1: The scope of the iBorrow netbook location tracking and anonymised user dataset supplied by the iBorrow team at the Canterbury Christ Church University
DATA FIELDS SAMPLE 1 SAMPLE 2 COMMENT
User ID USER201002240240 USER201003010515 Anonymised ID code
Level of Study Undergraduate Undergraduate UG or PG
Year of Study 2 1
Campus Medway Canterbury Campus where student
is based
Type of UG Degree Single Combined
Major Subject Early Childhood Studies Forensic Investigation
Minor Subject Applied Criminology
Mode of Attendance FT FT Full-Time, Part-Time
Gender F M
Disability Yes No Yes, No
Post Code ME1 CT1 Term time residence
Age 23 20
Location E2B E2A East Wing, 2nd Floor,
Area A, B or C
Collection Date 24/02/2010 01/03/2010
Collection Time 13:35 17:15 Sampling every five
minutes hourly for 24 hours
Confidence Factor 32 40 See Note
X 120.14 72.31 X,Y co-ordinates of an
iBorrow netbook tracked, measurements given in feet
Y 53.27 30.92 The origin (0,0) is in the
Note: The Confidence Factor relating to each X,Y is in feet and is defined as follows: With every calculated location (say x1, y1), a Confidence Factor (CF) is returned. CF is a floating point scalar used to calculate 95% confidence square (see the AHE website for visual examples: www.wecamp.group.shef.ac.uk/AHE/).
Figure 2: The origin (0,0) of the iBorrow netbook location tracking XY coordinate system is set at the top-left corner of each building floor
Visualising the iBorrow Dataset on uCampus
On the basis of the context-rich 3D data visualisation modelling approach and the uCampus platform developed previously, our method of visualising the iBorrow dataset can be summarised in the following stages.
Architectural and Urban Context Visualisation of the Augustine House
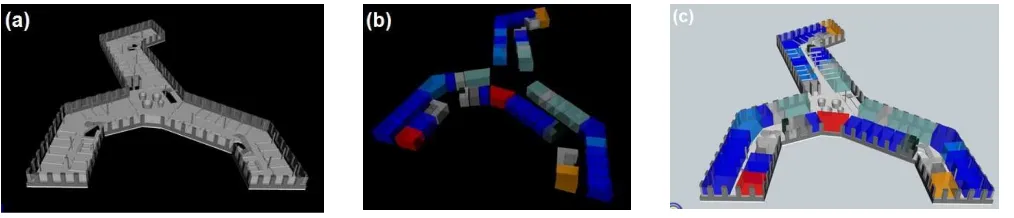
An aerial-photo derived 3D urban model with the Augustine House at the centre was used as the urban context of creating 3D models in the X3D format. A user account “AUGUSTINE” was registered on uCampus to host all the X3D models produced at this stage. For each floor of the Augustine House, three X3D models were built to represent (a) architectural floor, (b) furniture, and (c) spaces (Figure 3). Through the uCampus user interface, these models can be freely combined to construct rich
architectural contexts for displaying data models with reference to the AH floors.
(a) architectural floor (b) furniture (c) spaces
Figure 3:Architectural visualisation of the Augustine House
3D Visualization of the iBorrow Location Sensing Data
[image:5.612.63.569.540.650.2]as a coloured geo-referenced sphere positioned 50cm above each floor. Various schemes of data visualisation were devised to work with different combinations of data fields such as Male-Female, Times of a Day, PG-UG level of study, Full-Part Time etc. Due to software development limit,
generating the iBorrow X3D data models remains a combined software and manual process: XML files need to be manually created according to a specific format as inputs to the xml conversion tool.
Meaningful viewpoints of the resultant X3D iBorrow data models are inserted manually before uploading onto the uCampus accounts.
Overlay of the iBorrow Data Models on to the 3D AHE Floor Models
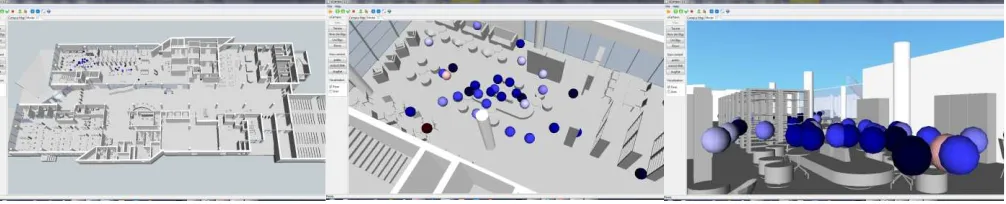
[image:6.612.64.567.278.380.2]We use the user account facility provided on uCampus to set up a number of accounts for uploading the X3D models created in the previous stages into different user content folders. Overlaying iBorrow tracking data models on the AH floor models into final 3D iBorrow datascapes can be performed simply by selecting relevant data and floor models from the lists established in the hosting accounts. A user can navigate an iBorrow datascape freely at any viewing position with a web browser that has an X3D viewer plug-in installed (Figure 4).
Figure 4: An example of navigating an iBorrow datascape in the BS Contact X3D viewer plug-in
Further Presentation of the AHE Datascapes on Web Browsers
On the basis of the 3D modelling approach described above and the uCampus platform, it is relatively straightforward to construct a website that lists the Augustine House Experiment results according to the selected data fields, for instance, “Female-Male, 01/03/2010, Ground Floor”or “Disable-Able, 01/03/2010, 2nd Floor.” The current AHE website contains links to 33 pre-assembled X3D models in 8 different groups of data fields (www.wecamp.group.shef.ac.uk/AHE/). For each X3D data model, a set of colour-coded keys is provided to aid user reading of the relevant user information and location sampling time. This further presentation enables end-user direct access to the AHE data visualisation models without installing and logging into the uCampus accounts.
What Does Location Sensing Tell Us about the AH Learning Landscape?
Within the life-time of the AHE project it was not possible to convert the entire one-week iBorrow dataset into X3D datascapes. Substantive parts of the data visualisation modelling tasks remained manually based as no extra software tools could be developed in time for speedy data processing. Instead, efforts were made to produce six location sensing patters as examples of how the uCampus-based 3D visualisation modelling approach could be applied to selected records of user characteristics, sensing time, and the spaces (Table 2). The full range of the AHE datascapes can be accessed from the AHE website assuming that an X3D viewer plugin is installed on a Windows PC.
Table 2:
(Part-time, Full-time) Wednesday 03/03/2010 11:30 12:00 13:00 14:00 15:30
G, 1, 2, 3
(Female, Male) Monday 01/03/2010 10:00 13:00 16:00 19:00 22:00
G, 1, 2, 3
(PG, UG) Monday 01/03/2010 10:00 13:00 16:00 19:00 22:00
G, 1, 2, 3
(Disable, Able) Monday 01/03/2010 10:00 13:00 16:00 19:00 22:00
G, 1, 2, 3
Age (0-25, 26-30, 31-65) Monday 01/03/2010 10:00 13:00 16:00 19:00 22:00
G, 1, 2, 3
(Days of a Week) & (Female, Male)
01/03 (Mon), 02/03 (Tue), 03/03 (Wed), 25/02 (Thu), 26/02 (Fri)
16:00 G, 1, 2, 3
User A (User ID: 201002270007)
Saturday 27/02/2010 13:25 13:30 13:50 14:25 14:30 14:50 15:25 15:30 15:50 16:25 16:30 16:50
1
User B (User ID: 201002240007)
Sunday 28/02/2010 11:25 11:30 11:50 12:25 12:30 12:50 13:25 13:30 13:50 14:25 14:30 14:50 15:25 15:30 15:50
2
Obviously, many other combinations of the data fields for producing further datascapes are possible but the principle and methodical steps of data visualisation remain the same. Perhaps, more importantly, one should ask if the resultant AHE datascapes could help contributing discussion of the new learning landscape—What does the week-long location sensing tell us about the working of the Augustine House as new learning spaces? Could we draw on the 3D datascapes as visual quantitative evidence to address some of the questions raised earlier by iBorrow’s pedagogic perspectives (Graham-Matheson, 2009; Collis, 2010)?
Where, more precisely, are the iBorrow netbooks used?
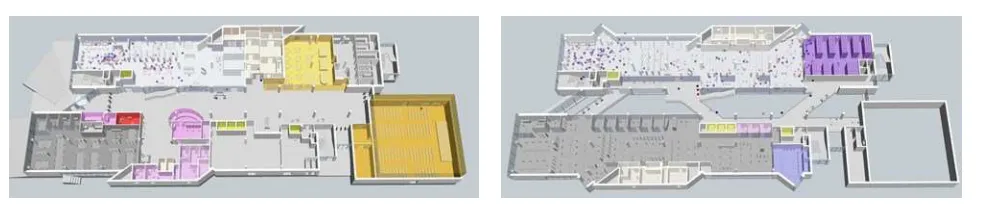
[image:7.612.63.554.574.676.2]This is what the AHE project has set out to look for. Obviously, the accuracy of the datascape visulisation depends on the level of precision afforded by the location tracking system. At present, location tracking around the central atrium areas on the 2nd and 3rd Floor is most problematic— netbooks appeared hovering outside the perimeter walls or high in the atrium (Table 3).
Table 3:Where, more precisely, are the iBorrow netbooks used?
Second Floor Third Floor
Was there a peak of activity in the building and do students favour particular areas of the building?
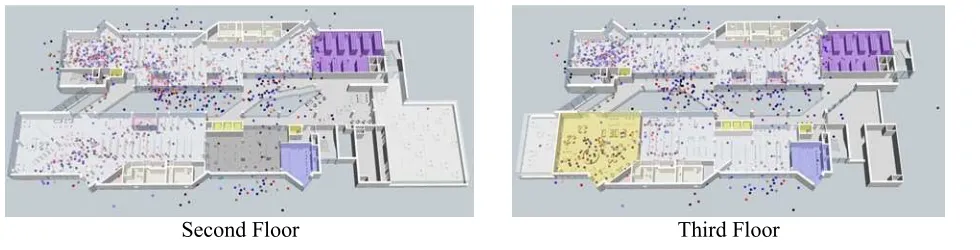
A shown above, the various results compiled in Table 4 suggest that there was a peak activity in the building between the lunch time hours and 16:00 on these days. The Second Floor had the highest intensity of use across the six patterns, followed by the Third, First and Ground Floor.
[image:8.612.65.555.54.179.2]The aggregates of all six groups of sensing point clouds on each floor indicate the areas “favoured” by the occupying student users.
Table 4: Spatial-temporal locations of peak activity and ‘favoured’ areas of the building (different data fields are collated with the AH ground floor outline as the backdrop
10:00, 01/03/2010 Female-Male, G-3
13:00, 01/03/2010 Female-Male, G-3
16:00, 01/03/2010 Female-Male, G-3
19:00, 01/03/2010 Female-Male, G-3
22:00, 01/03/2010 Female-Male, G-3
10:00, 01/03/2010 UG-PG, G-3
13:00, 01/03/2010 UG-PG, G-3
16:00, 01/03/2010 UG-PG, G-3
19:00, 01/03/2010 UG-PG, G-3
11:30, 03/03/2010 FT-PT, G-3
12:00, 03/03/2010 FT-PT, G-3
13:00, 03/03/2010 FT-PT, G-3
14:00, 03/03/2010 FT-PT, G-3
15:30, 03/03/2010 FT-PT, G-3
To what extent is iBorrow netbook use a snapshot of student use of IT in the Augustine House— Could you correlate from netbook use to overall use of the learning centre?
This is an interesting but challenging question to be addressed in view of the AHE results. First of all, it was observed that student use of IT was a mixture of fixed-location desktops, private laptops/tablets/ smartphones, and the iBorrow netbooks. The current AHE results show when and where the netbooks were used and by what users, which could potentially reveal a useful picture of student IT use if the percentage of the netbook use is further established among the mixed IT uses. If one considers “overall use of the learning centre” as spatial-temporal user occupation or where the users were detected to staying, then location sensing of the netbook uses can provide approximate overall use patterns of the new learning landscape.
Are there mixed uses of the IT resources within AH across space and time?
This is where the AH contextual modelling becomes relevant as the location sensing datasets are overlaid with the building floor and furniture models. Through close inspection of the synthesized datascapes, there appear no mixed uses of the netbooks with fixed desktops. These two IT resources appeared used separately across space and time. During the AHE sensing period, very few iBorrow netbooks were tracked around the fixed desktop areas, and the netbooks were predominantly seen used in the informal flexible areas of the Library and the Group Study Rooms. However, this cannot be concluded for a great certainty without a higher level of accuracy and sensitivity to be achieved by better location sensing technology.
Do particular ‘groups’ of students gather in certain spaces, ie. near subject resources?
Evidently, a lot more full-time students used the netbooks then part-timers. Part-timers used them more on the 2nd and 3rd Floor. More female used them on the Ground and 1st Floor, and increased male students used them on the 2nd and 3rd Floor. A lot more undergraduate students were seen across all floors and sampling times. Notably, the Disable-Able datascapes show that the netbooks were used by disabled students across all floors, indicating that the AH seems working really well in terms of
accessibility for the disabled. In age ranges, the under-25 group used the devices most, followed by the 30-65 group; few 26-30 were seen on this particular Monday (01/03/2010).
“Were there any recognizable patterns of learning footprints when learners were in the Augustine House?” and “How do the affordances of different learning spaces influence learning footprints?”
Table shows two examples of how “learning footprints” as phased by Collis may look like using User A and User B location sensing data. Though limited by the scope of temporal and spatial sampling, these initial working examples point to a further study area where far more extensive data modelling can be carried out to uncover any recognizable patterns of learning footprints. For instance, aggregates of individual users fitting certain student profiles could lead to recognitions of how certain groups move around the learning centre. Analyses of the footprint patterns could reveal useful insights of facility management such as adjusting locations of learning resources to achieve better accessibility and a more effective circulation system.
The “affordances of learning spaces” is a concept that can be approached from multiple perspectives. From an architectural point of view, affordances could result from design of views (both in and out), furniture, spatial proportions (scales), colours and textures, acoustics and lighting. Increasingly, affordances are also shaped by educational technologies (both virtual and physical)—the making of technology-rich learning spaces. Given the multiplexity, it remains an interesting open question: How affordances should be defined, captured and modelled such that it could be related to location sensing in a meaningful way?
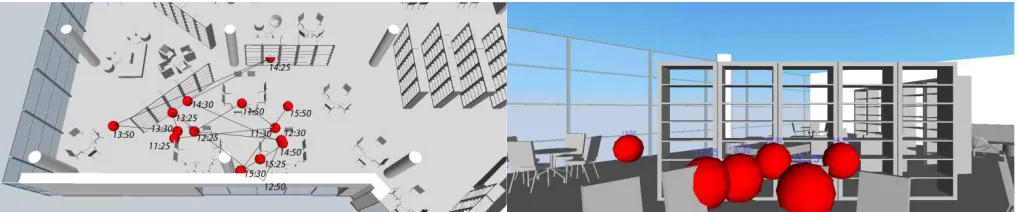
Table 5: Two examples of “learning footprints”
User A (User ID: 201002270007), Saturday 27/02/2010,13:25 13:30 13:50 14:25 14:30 14:50 15:25 15:30 15:50 16:25 16:30 16:50, 1st Floor
User B (User ID: 201002240007), Sunday 28/02/2010, 11:25 11:30 11:50 12:25 12:30 12:50 13:25 13:30 13:50 14:25 14:30 14:50 15:25 15:30 15:50, 2nd Floor
Conclusion and Areas for Further Investigation
[image:10.612.59.568.490.596.2]extent to which the resultant 3D datascapes can be considered quantitative evidence of how the new learning spaces work is discussed by addressing a number of questions enlisted by an earlier pedagogic study. It is found that inspections of the iBorrow datascapes can contribute to the discussion in a way that is helped by a strong grasp of large complex datasets. The synthesis of location sensing and context-rich data visualisation as piloted in this experiment can be developed into a creditable research apparatus with which we could probe deeper into the emerging learning landscapes to inform future deign. However, there are limitations experienced through the AHE project:
As it is, the performance of the location sensing technology is yet to be improved drastically; the reliability of the tracking data appears inconsistent across the AH floors at the moment. This is a non-trivial technical issue as it involves accurate calibration which in term depends on a whole host of factors such as mixing autonomous and managed access points and sensitivity to the furnishings and configuration of the spaces (Poole & Wheal, 2011). There is a demand for a more up-to-date survey of the latest capability and reliability of indoor/outdoor sensing
technologies that can be applied to different scales of spaces.
The generation of accurate 3D datascapes from raw sensing data requires a great deal of software processing power. Only a small portion of the software development has been
delivered by the AHE project due to limited resources. A long-term prospect is to achieve real-time on-demand 3D datascapes generation capabilities that will allow interactive user queries and retrieval from live databases hosting location sensing data and learner information.
It is questionable if quantitative evidence by itself can tell a whole story of a new learning landscape. It is possible and desirable to bring about a dialogue between direct observations, more intimate ethnographic studies, and machined-generated datascapes. Future research into learning spaces could also consider incorporating pervasive uses of social media technology with which the learners themselves may reveal their experiences of the learning spaces inhabited over time.
Acknowledgements
The Augustine House Experiment project was funded under the JISC Institutional Innovation Benefits Realisation Programme. The author wishes to acknowledge the contributions from Darren Roberts, Pangiotis Patlakas, Binh Nguyen and Jenny Chen while working on the project as technical consultants. Many discussions have been held with Phil Poole, Adrian Wheal, Wayne Barry and Peter Rand at Canterbury, and Richard Jones and Justin Luker at Buckinghamshire New University. Thanks to the supports provided by Josie Fraser, Paul Bailey, Rhonda Riachi, and George Roberts of the JISC SSBR team.
References
Boys, J. (2011). Towards Creative Learning Spaces: Rethinking the Architecture of Post-Compulsory Education. London: Routledge.
Collis, B. (2010). Studying learning spaces in the iBorrow context. Canterbury: CCCU. Available at: http://www.canterbury.ac.uk/projects/iborrow/documents/iBorrow-Pedagogic-Research-Reflections.pdf
(accessed January 2012).
Dugdale, S. (2009). Space Strategies for the New Learning Landscape. EDUCAUSE Review, 44, 2, 51-63.
http://www.canterbury.ac.uk/projects/iborrow/documents/iBorrow-Pedagogic-Research-Report.pdf (accessed January 2012).
Leiws, M. (2010). The University of Sheffield Library Information Commons: A Case Study. Journal of Library Administration, 50:161–178.
Neary, M., Harrison, A., Crellin, G., Parekh, N., Saunders, G., Duggan, F., Williams, S. & Austin, S. (2010). Learning Landscapes in Higher Education Centre for Educational Research and
Development. University of Lincoln and DEGW.
http://www.degw.com/researchpdf/LearningLandscape_HigherEducation.pdf
Pantidi, N. (2010). Appropriating Technology-Rich Learning Spaces. Proceedings of the 2010 10th IEEE International Conference on Advanced Learning Technologies. IEEE Computer Society Washington, DC, USA, 695-696.
Pearshouse, I., Bligh, B., Brown, E., Lewthwaite, S., Graber, R., Hartnell-Young, E. & Mike Sharples, M. (2009). A Study of Effective Evaluation Models and Practices for Technology Supported
Physical Learning Spaces (JELS), Final Report, JISC.
http://www.jisc.ac.uk/whatwedo/projects/learningspaces08.aspx (accessed January 2012). Peng, C., Roberts, D., Patlakas, P., Basu, P., Care, L., Evans, H. & Powell, A. (2009). Visualising
Future Learning Spaces in Context: the Sheffield Experiment, Proceedings of the International Conference on Education and New Learning Technologies (EDULEARN09), L. Gómez Chova, D. Martí Belenguer, I. Candel Torres (Eds.), Barcelona, Spain, 6-8 July, 2009, 3977-4007.
Peng, C., Powell, A., Roberts, D., Patlakas, P., Basu, P., Care, L. & Evans, H. (2010). uCampus: A web-based 3D interactive visualisation modelling platform to effect participative and collaborative planning and design of future learning spaces. weCAMP-uCampus Final Report, Available at: http://www.jisc.ac.uk/whatwedo/programmes/institutionalinnovation/wecamp.aspx (Accessed January 2012).
Poole, P., Ellery, I. & Wheal, A. (2010). iBorrow Final Report, JISC. Available at:
http://www.jisc.ac.uk/media/documents/programmes/institutionalinnovation/iborrowfinalreport.pdf (Accessed January 2012).
Poole, P. & Wheal, A. (Eds.) (2011). Learning, spaces and technology: exploring the concept. Canterbury: Canterbury Christ Church University. Available at: