City, University of London Institutional Repository
Citation
:
Karim, M. R., Ahmad, H. and Rahman, B. M. ORCID: 0000-0001-6384-0961
(2018). Design and modeling of dispersion-engineered all-chalcogenide triangular-core fiber
for mid-infrared-region supercontinuum generation. Journal of the Optical Society of America
B: Optical Physics (JOSA B), 35(2), pp. 266-275. doi: 10.1364/JOSAB.35.000266
This is the accepted version of the paper.
This version of the publication may differ from the final published
version.
Permanent repository link:
http://openaccess.city.ac.uk/19761/
Link to published version
:
http://dx.doi.org/10.1364/JOSAB.35.000266
Copyright and reuse:
City Research Online aims to make research
outputs of City, University of London available to a wider audience.
Copyright and Moral Rights remain with the author(s) and/or copyright
holders. URLs from City Research Online may be freely distributed and
linked to.
City Research Online:
http://openaccess.city.ac.uk/
[email protected]
Design and modelling of dispersion engineered
all-chalcogenide triangular core fiber for mid-infrared
region supercontinuum generation
M. R. K
ARIM1, H. A
HMAD1,*,
ANDB. M. A. R
AHMAN2 1Photonics Research Centre, University of Malaya, 50603 Kuala Lumpur, Malaysia2Department of Electrical and Electronic Engineering, City University of London, Northampton Square, London, EC1V 0HB, UK *Corresponding author: [email protected]
Compiled November 29, 2017
An ultrabroadband mid-infrared supercontinuum (SC) source has been designed and modelled using a 10-mm-long all-chalcogenide triangular core fiber (TCF). The TCF structure can be fabricated from Ge11.5As24Se64.5chalcogenide glass as a core and Ge11.5As24S64.5chalcogenide glass for its cladding run-ning along the length of the fiber instead of air-holes. Assuming the pump operates at 4µm, the TCF
is optimized by varying its side length both anomalous and all-normal dispersion SC generation. Mid-infrared region SC spectral broadening spanning beyond 15 µm could be generated with a low peak
power of 3 kW by the proposed TCF structure optimized with varying its side length between 7 and 8
µm in anomalous dispersion pumping. On the other hand, the TCF side length has to be decreased to
5.5µm and below to optimize it for pumping in all-normal dispersion region SC generation. A coherent
flat-top SC evolution in the mid-infrared region of up to 7µm could be observed by this design with the
same pump peak power and pulse duration applied before. The ultrawide optical bandwidth obtained by the proposed TCF design can be an effective tool for mid-infrared region applications such as optical coherence tomography, molecular fingerprint spectroscopy and biomedical imaging. © 2017 Optical Society of America
OCIS codes: (000.4430) Numerical approximation and analysis; (190.0190) Nonlinear optics; (230.7370) Dispersion; ((060.4005) Microstructured fiber; (160.4330)Nonlinear optical materials; (320.6629) Supercontinuum generation.
http://dx.doi.org/10.1364/ao.XX.XXXXXX
INTRODUCTION
Supercontinuum (SC) generation in the mid-infrared (MIR) (2–
20µm) region particularly is of high interest owing to the
fun-damental vibrational absorption of most molecules located in this spectral region . Although the atmospheric transparency
is better in the two spectral windows of 3–5µm and 8–13µm,
however, the second window sees great importance in molecular fingerprint spectroscopy as well as used to detect trace-gas in
a variety of industrial and atmospheric applications [1]. Until
recently, as the fiber based geometries have higher design flex-ibilities to achieve desirable dispersion properties through the engineering their structural parameters, optical step-index fibers as well as microstructured based fibers made of highly nonlinear materials are used to generate ultrabroadband MIR SC evolution
in the long wavelength region [2,3]. Chalcogenide materials
are very interesting and promising materials containing high intrinsic Kerr nonlinearity with a wide transmission window in the MIR region making them more suitable for the fabrication of
microstructured and step-index fibers that can be employed to
generate ultrabroadband MIR SC evolutions exceeding 15µm
[4–7]. Microstructured fibers can be fabricated by employing a
single material as a core and air-holes running along the entire length of the fiber as a cladding or a combination of materi-als with the core and cladding being made from two different
materials [8,9].
Recently, the generation of various ultrabroadband SC spectra in the MIR region has been demonstrated both
ex-perimentally [5, 10–18, 31–35] and numerically [19–23, 36].
Petersen et al. experimentally demonstrated the MIR SC
spectra up to 13.3 µm with a step-index fiber made from
As40Se60/Ge10As23.5Se66.6ChG glass and pumped with 100-fs
pulse duration at 6.3µm with a peak power of 2.29 MW [10].
Chenget al. reported a MIR SC spectrum covering a wavelength
range of 2-15.1µm in a 3-cm-long As2Se3/AsSe2ChG step-index
fiber pumped with 170-fs pulses in 9.8µm with a peak power
generation spectra spanning from 2µm to 16µm using
14-cm-long tellurite glass (Ge-Te-AgI) step-index fiber pumped at 7µm
with a 150-fs pulse width having a repetition rate of 1 kHz with a pump peak power of 77 MW in the normal dispersion regime
[11]. Petersenet al. experimentally demonstrates a broadband
MIR SC generation spectra covering from 1 to 11.5µm with high
average output power above 4.5µm in tapered large-mode-area
chalcogenide Ge11As22Se68photonic crystal fiber [12]. Hudson
et al. reported a broadband MIR SC spectrum spanning from 1.8
to 9.5µm using As2Se3/As2S3tapered fiber by launching 230-fs
pulses with a pulse peak power of 4.2 kW [13].
Mølleret al. reported a MIR SC spanning the wavelength
range 1.7 to 7.5µm with an 18-cm suspended core As38Se62fiber
having core diameter of 4.5µm by using pump at 4.5µm with
a pump peak power of 5.2 kW [14]. Zhaoet al. experimentally
demonstrated a MIR SC generation covering the wavelength
range 1.5 to 14µm by a 23-cm Te-based ChG step-index fiber
pumped at 4.5µm with a pulse duration of 150-fs [16]. Yuet
al. demonstrated a MIR SC generation spanning from 1.8 to
10µm by pumping an 11-cm-long step-index ChG fiber with
330-fs pulses at 4µm with a low peak power of 3 kW [17].
Ku-batet al. numerically shows the MIR SC generation extending
up to 12.5µm by using ChG step-index fiber made
employ-ing AsSe as a core and GeAsSe as a outer claddemploy-ing pumped
at 4.5µm with a peak power of 4.7 kW [19]. In our previous
microstructured fiber based designs [23], three different designs
were reported namely the triangular core fiber (TCF), hexagonal photonic crystal fiber (H-PCF) and equiangular spiral photonic crystal fiber (ES-PCF). These were designed by microstructur-ing the claddmicrostructur-ing through the incorporation of air holes into the cladding for ultrabroadband SC generation in the MIR region.
An ultrabroadband MIR SC spectrum spanned up to 11µm
us-ing an ES-PCF pumped at 3.1µm with 3 kW of input power.
Due to the nature of the group velocity dispersion (GVD) pa-rameter at this pump wavelength, however, the SC spectrum
could not be extended beyond 6µm using the TCF design. In
this work, a 10-mm-long all-chalcogenide TCF microstructured
fiber geometry made employing Ge11.5As24Se64.5 glass as its
core and Ge11.5As24S64.5glass employed as its cladding instead
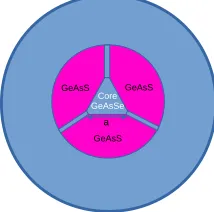
of air-holes running along the length of the fiber is numerically designed for investigating the MIR SC evolutions between the anomalous and all-normal dispersion regimes. The core of this TCF fiber has been designed with an equilateral triangle of
hav-ing equal side length suspended by three struts of 0.2µm thick
at the three corner of the fiber and this can be easily fabricated
by using extrusion technique [29]. Typical triangular core fiber is
made of suspended core type, however, in case of our design dis-persion of the TCF fiber can be easily controlled by making the triangular core smaller/larger with reducing/increasing the side length of the fiber. Moreover, a TCF core can be much smaller than that of a hexagonal PCF and other typical microstructured fibers due to stronger index contrast and better control of its structural parameters which eventually results better confine-ment yielding high nonlinear interaction. Depending on the
compositions, ChG glass can be transparent beyond 15µm in the
MIR region and the glass compositions made of GeAsSe/GeAsS, which are chosen for our TCF design, have been used to fabricate waveguides and different step-index as well as microstructured
fibers for SC generation successfully [15,24,27,39].
Initially, three different designs are optimized for pumping in the anomalous dispersion region by varying the TCF side
length between 7µm and 8µm. It is possible to predict an
[image:3.612.385.492.51.157.2]ultrabroadband SC extending into the MIR region up to 16µm
Fig. 1.Triangular core fiber geometry
with a low input peak power of 3 kW by one of the proposed TCF
design with a side length of 8µm. Subsequently, the side length
of the TCF geometry is reduced gradually to obtain the GVD parameter for pumping the structure in an all-normal dispersion profile. An all-normal dispersion design is obtained for a side
length of 5.5µm and below, and above that value the design
remains in anomalous dispersion regime. By varying side length
from 5.5 to 4.5µm, three designs for all-normal dispersion SC
generation are optimized. Inducing a minor spectral fluctuation around the pump wavelength, a broadband coherent MIR SC
spectrum could be obtained spanning up to 7µm with a TCF
side length of 5.5µm. Spectral fluctuation could significantly
be reduced by lowering the side length to 4.5µm by keeping
[image:3.612.324.552.419.504.2]the same pump pulse and power applied before. However, the SC bandwidth decreases slightly at the TCF output owing to its side length reduction, which eventually increases the spectral flatness around the pump wavelength.
Table 1.Sellmeier coefficients
Material GeAsSe[24] GeAsS[24]
m 2 2
Aj λj Aj λj
j=1 5.78525 0.28795 4.18011 0.31679
j=2 0.39705 30.39338 0.35895 22.77018
THEORY
The cross-section of the proposed TCF structure is shown in Fig. 1. During waveguide simulation, the linear refractive index
of Ge11.5As24Se64.5and Ge11.5As24S64.5 ChG glasses has been
calculated using the Sellmeier equation [24],
n(λ) =
v u u t1+
m
∑
j=1Ajλ2
λ2−λ2j, (1)
whereλdenotes the wavelength in micrometers. The values of
Sellmeier fitting coefficients are given in Table 1.
In computational photonics, finite-element is a very powerful and well established numerical tool for characterizing an optical waveguide with any refractive index distribution. We employ our in-house finite-element based full vectorial mode-solver
(FEM) to calculate mode effective index (neff=λβ(ω)/2π) of
the fundamental mode (H11x ) of the proposed TCF structure
up to the wavelength range of interest. The FEM is based upon dividing the waveguide region into a large number of non-overlapping triangular elements. We represent our TCF
structure with 500,000 first-order triangular elements (500×500
mesh) across the transverse dimensions. The field over each ele-ment is then expressed in terms of polynomials weighted by the fields over each element. By differentiating the functional with respect to each nodal value, the problem is reduced to a standard eigenvalue matrix equation, which is solved to obtain the
prop-agation constantsβ(ω)and associated field profiles of various
quasi-TE and quasi-TM modes. In the full-vectorial formulation
one needs to minimize the fullH-field energy functional using
[25],
ω2=
R R
(∇ ×H)∗.ˆε−1(∇ ×H) +p(∇.H)∗(∇.H)dxdy
R R
H∗. ˆµHdxdy , (2)
whereHis the vectorial magnetic field, * denotes a complex
con-jugate and transpose,ωis the angular frequency,pis a weighting
factor for the penalty term to eliminate spurious modes, and ˆ
eand ˆµare the permittivity and permeability tensors,
respec-tively. To calculate the confinement losses, perfectly matched layer (PML) is used to truncate the computational domain. Later, modal solution accuracy was tested by a powerful extrapolation technique called Aitken’s extrapolation through convergence be-tween the raw FEM results and extrapolated values with respect
to the increased number of mesh elements [41].
On the other hand, the GVD is an another important
waveg-uide characterizing parameter which can be evaluated fromneff
obtained by the FEM solver using the following GVD equation
[26]
GVD(λ) =−λ
c
d2Re(neff)
dλ2 , (3)
wherecdenotes the speed of light in the vacuum.
To study the MIR SC generation both in the anomalous and all-normal GVD regions, the optical pulse evolution in-side the optimized TCF structure is modeled by solving the one-dimensional generalized nonlinear Schrödinger equation
(GNLSE) [26]:
∂ ∂zA
(z,T) + α
2A−
14
∑
r≥2ir+1
r! βr
∂rA ∂Tr
=i
γ+i α2
2Aeff
1+ i
ω0 ∂ ∂T ×
A(z,T) Z ∞
−∞R(T)|A(z,T−T
0)|2dT0,
(4)
HereA(z,T)indicates the slowly varying pulse envelop evolv-ing along the length of TCF structure in a retarded time
frame with reference T = t−β1zmoving at the group
ve-locityvg = 1/β1, βr (r ≥ 2) is the second and higher-order
dispersion terms expanded by Taylor-series expansion from
the mode propagation constant β(ω) around the center
an-gular frequencyω0 and αis the linear attenuation
(propaga-tion loss) of the TCF.γis the nonlinear parameter defined as
γ(ω0) = n2ω0/(cAeff), where n2 is the nonlinear refractive
index, Aeff = (
R R
|E|2dxdy)2/(R R
|E|4dxdy) is the mode
ef-fective area of the fundamental mode of TCF structure at the pump wavelength, and the two-photon absorption coefficient
is expressed byα2=7.88×10⁻¹⁴m/W [30], however, it can be
assumed negligible at a wavelength of 4µm. The total nonlinear
response functionR(t)is expressed as
R(t) = (1−fR)δ(t) +fRhR(t), (5)
(a) D [ p s/ n m /k m ] -200 -175 -150 -125 -100 -75 -50 -25 0 Wavelength [μm]
2 3 4 5 6 7
[image:4.612.322.569.47.154.2](b)
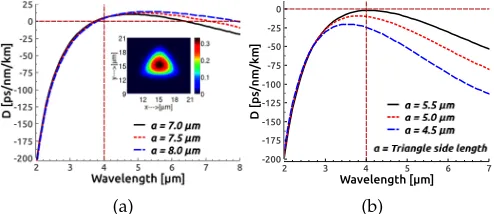
Fig. 2.GVD curves optimized for the TCF geometry shown
in Fig. 1 with the variation of its side lengthafor pump
em-ploying in (a) anomalous dispersion region and (b) normal dispersion region. The inset of Fig. 2(a) shows the
fundamen-tal mode profile (H11
x ) for the TCF structure of side length
containing 8µm at pump wavelength. The vertical dashed line
indicates pump wavelength.
Here,δ(t)is the instantaneous Kerr response andhR(t)is the
delayed Raman response expressed as
hR(t) =
τ12+τ22
τ1τ22
exp − t τ2 sin t τ1 , (6)
where the response function coefficients of chalcogenide material
are predicted asfR=0.148,τ1=23-fs andτ2=164.5-fs which
are the Raman coefficients of a single-peak Lorentz function
fitted to the As2Se3chalcogenide material [33,37] as the actual
values offR,τ1,τ2for the ternary GeAsSe chalcogenide materials
not yet reported.
The coherence of the SC spectra obtained in the all-normal dis-persion region for the proposed TCF can be tested from numeri-cal simulations by generating an ensemble average of
indepen-dent SC pairs [E1(λ),E2(λ)] with different random noise seeds.
Thus, the complex degree of first-order coherence|g(121)(λ)|can
be defined as [38]
|g(121)(λ)|=
E∗1(λ)E2(λ)
p
h|E1(λ)|2i h|E2(λ)|2i
. (7)
where the angular brackets denote an ensemble average of inde-pendently generated SC spectra pairs.
DISPERSION ENGINEERING OF TCF
SC spectral evolution at the optical waveguide output signifi-cantly depends on GVD optimization. The GVD of the optical
γ [ m -1W -1] 0 0.2 0.4 0.6 0.8 1 1.2 A e ff [μ m 2 ] 10 20 30 40 50 60 Wavelength [μm]
3 6 9 12 15
(a) C o n fi n e m e n t L o ss [d B /m ] 0 100 200 300 400 Wavelength [μm]
4 8 12 16 20
[image:4.612.323.569.571.680.2](b)
Fig. 3.(a) Mode effective areas and their corresponding non-linearities over wide wavelength range for the TCF structure
of containing side length 8µm. (b) Confinement losses are
S
p
e
ct
ra
l
P
o
w
e
r
[d
B
]
-60 -50 -40 -30 -20 -10
Wavelength [μm] 2 4 6 8 10 12 14 16
(a)
S
p
e
ct
ra
l
P
o
w
e
r
[d
B
]
-60 -50 -40 -30 -20 -10
Wavelength [μm] 2 4 6 8 10 12 14 16 18
(b)
S
p
e
ct
ra
l
P
o
w
e
r
[d
B
]
-60 -50 -40 -30 -20 -10
Wavelength [μm] 2 4 6 8 10 12 14 16 18
(c)
(d) (e) (f)
[image:5.612.46.550.46.479.2](g) (h) (i)
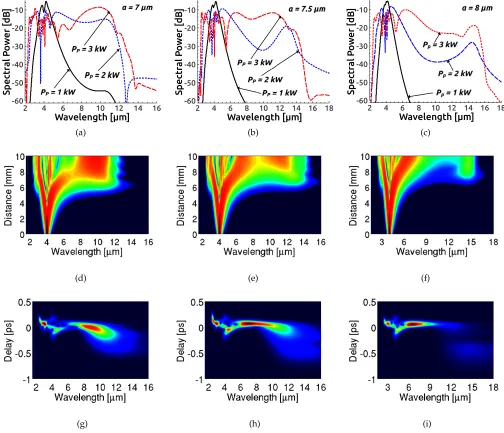
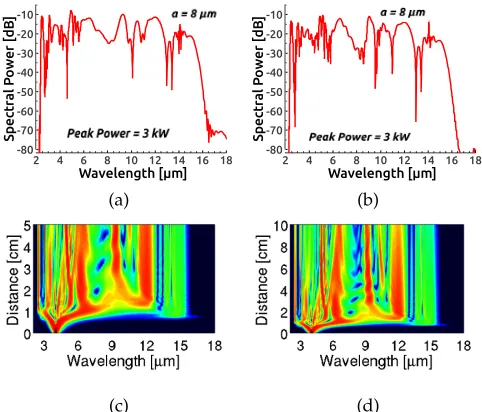
Fig. 4.Anomalous dispersion SC spectra (top row), spectral density (middle row) and spectrogram (bottom row) represent the TCF
structure with triangle side length of 7µm (left column), 7.5µm (middle column) and 8µm (right column), respectively.
waveguide can be tailored to pump the waveguide in either the all-normal dispersion or anomalous dispersion regions. To extend the SC into the MIR region, pump wavelength requires to be shifted to a longer wavelength depending on the availability of such a pump source in that region. To obtain SC spanning far into the MIR, our proposed TCF geometry is optimized for pumping in both dispersion regions assuming the pump
wave-length at 4µm by varying its structural parameter side length,
a. To obtain suitable GVD curves both in the anomalous and
all-normal dispersion regimes for pumping at this wavelength, numerous FEM modal solutions are performed on the proposed triangular-core structure with the variation of its side length
keeping the thickness of all three struts are constant at 0.2µm
(each strut) placing at the three corners of a TCF structure to obtain mode effective index over a wide range of wavelengths. Our design shows a slight birefringence and we obtain mode
effective index of both fundamental H11x (slow axis) and H11y
(fast axis) modes. The GVD parameters are calculated up to the wavelength range of interest from the mode effective index
ob-tained by the FEM mode-solver for both polarizations but shows very little difference between them. Among the numerous GVD curve variations obtained, two sets of GVD curves are shown for
the fundamental mode (H11x ) of TCF structure in Fig. 2. These
GVD curves are optimized for pumping both in the anomalous
and all-normal GVD regions varying TCF side length from 8µm
to 4.5µm. The GVD curves shown in Fig. 2(a) are tailored for
simulating SC generation in anomalous dispersion pumping by
varying the side length in the range,a =7−8µm. To obtain
all-normal dispersion GVD curves, the TCF side length, ais
reduced to 5.5µm and below. Fig. 2(b) shows the second set of
GVD curves optimized for all-normal dispersion pumping with
the variation of side length,a=5.5−4.5µm.
SC GENERATION IN THE MIR REGION
SC simulations are carried out by solving GNLSE Eq. (4) through symmetrized split-step Fourier method by MATLAB for observ-ing MIR SC spectral broadenobserv-ing in the optimized TCF designs
in both the anomalous and all-normal dispersion regimes.
Nu-merical simulations were carried out by taking 217number of
grid points with a minimum temporal resolution of 6.67-fs so that time window can accommodate extreme spectral broaden-ing inside it by avoidbroaden-ing negative frequency generation. The number of axial steps in pulse propagation direction are taken
as 100,000 with a step size of 0.1µm.
SC generation in anomalous dispersion pumping
The damage threshold of ChG glasses needs to be considered before SC generation. Among different composition of ChG glasses, GeAsSe based composition has the lowest damage
threshold which is an average power density of 30 kW/cm2.
However, the damage threshold of Sulphide (S) based ChG ma-terials is more than selenium (Se) based compositions. The ChG fiber core could be damaged if the peak intensity of pump pulses
reaches 30 GW/cm2, or the average power density at the input
facet of the fiber exceeds 100 kW/cm2. Paying attention to these
factors, we have designed our TCF fiber for MIR SC generation such that the required peak power of pump pulses is 3 kW or
lower [17].
For predicting the MIR SC spectral evolution in anomalous dispersion region pumping, a secant pulse of 100-fs full-width at half maximum (FWHM) duration has been propagated in an optimized 10-mm-long TCF structure at a pump wavelength
of 4µm with input peak power variation between 1 and 3 kW.
Before SC simulation, the FEM mode-solver is used to calculate
Aeff= 13.10µm2, 14.57µm2and 16.14µm2at pump frequency
for the TCF cross-section of side lengths 7µm, 7.5µm and 8µm,
respectively. Using theseAeffvalues, the nonlinear coefficientγ
can be calculated as 0.34 /W/m, 0.31 /W/m and 0.28 /W/m for the proposed TCF geometries. Frequency dependent nonlinear coefficients, which are illustrated in Fig. 3(a), can be calculated from the mode effective areas obtained over wide wavelength
range for a TCF side length of 8µm. During nonlinear coefficient
calculation, the nonlinear refractive indexn2has been reduced
to 1/3 times at 4µm from the measured value of 7.33×10⁻¹⁸
m2/W at 1.55µm [30]. The GVD values for the three designs
are calculated as 5.17 ps/nm/km, 4.99 ps/nm/km and 4.33 /ps/nm/km, respectively. The linear fiber propagation loss is considered to be 0.5 dB/cm at a pump wavelength during all SC simulations both in the anomalous and all-normal dispersion regimes though the loss may assume to be negligible in such
a short fiber design [39]. The confinement losses of TCF side
lengths of 4.5µm, 7µm and 8µm are shown in Fig. 3(b). The
tunable soliton pump source, which can be tuned between 2 and
4.3µm with a pulse duration of 100-fs [40], is employed during
all SC simulations. In our previous study [41], we found that
there is a possibility to obtain spurious results due to inclusion of insufficient number of higher-order GVD terms during the SC simulations. To avoid spurious results as well as to obtain more accurate SC spectral evolution at the TCF output,
higher-order dispersion terms up to 14thorder are included during all
numerical simulations.
Figure 4 shows the anomalous dispersion SC spectral broad-ening with a peak power variation between 1 and 3 kW spanning the spectrum far into the MIR region. By rigorous numerical simulations, it is determined that an ultrabroadband SC spectra can be realized with the proposed three dispersion engineered all-chalcogenide TCF designs in the MIR region covering the
wavelength ranges 2.2–13.5µm, 2.3–15µm and 2.3–16µm as
shown in Figs. 4(a), 4(b) and 4(c), respectively with a low input peak power of 3 kW. In all cases, the SC bandwidths are
mea-S
p
e
ct
ra
l
P
o
w
e
r
[d
B
]
-60 -50 -40 -30 -20 -10
Wavelength [μm]
[image:6.612.360.526.47.170.2]2 4 6 8 10 12 14 16 18
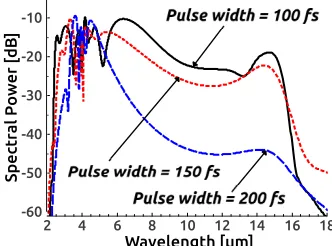
Fig. 5.The output SC spectra obtained with the variation of pulse duration for the TCF structure of side length having
8µm with a largest peak power of 3 kW.
sured in -30 dB level from the peak. According to the dispersion
length,LD=TP2/|β2|and the nonlinear length,LNL=1/γP, the
soliton order,N=√LD/LNLcan be calculated as 8.66, 8.35 and
8.53 and the soliton fission occurs approximately in 5 mm
dis-tance for the three TCF structures with the side lengths of 7µm,
7.5µm and 8µm, respectively. Relatively small anomalous GVD
as well as lower GVD slopes over the wide wavelength range (which can be seen in Fig. 2(a)) help to produce large Raman induced frequency shifts by forming the Raman soliton inside the TCF structure. Moreover, a large red shifted dispersive wave (DW) induced due to the suppression of Raman induced fre-quency shift after the second ZDW of each TCF design. The spectral density evolutions (middle row) and spectrograms (bot-tom row) in Fig. 4 for the three proposed TCF designs exhibit fission process which is initiated approximately at a distance of 5 mm of each geometry produces multiple fundamental solitons whose spectrum shifts toward the stokes-side (long wavelength region) due to Raman induced frequency shift which eventually yields a number of spectral peaks in the spectra. Due to spectral recoil effect, it can be seen from the Fig. 4 (middle and bottom rows) that solitonic propagations stop at the second zero
disper-sion wavelengths (ZDWs) at around 6.4µm, 7.2µm and 7.9µm
for the three TCF structures with a side length of 7µm, 7.5µm
and 8µm, respectively. A strong and large red shifted DW,
ow-ing to the presence of higher-order dispersion terms, emits in the long wavelength side by the fundamental solitons where energy transfer occurs from solitons to DW in the form of nonsolitonic radiation as can be seen in the Fig 4. It is also appeared that a DW is produced at a wavelength before the first ZDW of the
C
o
n
fi
n
e
m
e
n
t
fa
ct
o
r
0.4 0.5 0.6 0.7 0.8 0.9 1
Wavelength [μm] 2 4 6 8 10 12 14 16
(a)
S
p
e
ct
ra
l
P
o
w
e
r
[d
B
]
-60 -50 -40 -30 -20 -10
Wavelength [μm]
2 4 6 8 10 12 14 16 18
(b)
Fig. 6.(a) The confinement factor (power in core/total input power) and (b) the SC output spectra considering 2.5 dB linear loss during simulations for the TCF structure of containing side
[image:6.612.325.566.576.681.2]S p e ct ra l P o w e r [d B ] -80 -70 -60 -50 -40 -30 -20 -10 Wavelength [μm] 2 4 6 8 10 12 14 16 18
(a) S p e ct ra l P o w e r [d B ] -80 -70 -60 -50 -40 -30 -20 -10 Wavelength [μm] 2 4 6 8 10 12 14 16 18
(b)
[image:7.612.45.286.44.250.2](c) (d)
Fig. 7.The SC output spectra after the pulse propagation of (a) 5-cm, (b) 10-cm and their corresponding spectral density after (c) 5-cm, (d) 10-cm of propagation for the TCF structure of side
length having 8µm.
fiber falling in the normal dispersion region by the all proposed anomalous dispersion TCF designs. By varying pulse width between 100 and 200-fs, we have also performed numerical
sim-ulations for the TCF structure of side length containing 8µm
with same peak power applied before and the resulting output SC spectra illustrated in Fig. 5.
Until to date the highest MIR SC spectrum experimentally
reported by Chenget al. [5] spanning in the range of 2-15.1µm
in a 3-cm-long ChG step-index fiber (As2Se3/AsSe2) pumped
at 9.8µm with a peak power of 2.89 MW. On the other hand,
the highest SC expansion by numerical simulation was reported
by Sainiet al. [21] covering the wavelength range 2-15µm in a
5-mm long triangular core graded index As2Se3photonic crystal
fiber pumped at 4.1µm with a largest peak power of 3.5 kW.
However, by our proposed TCF design, it is possible to obtain
SC broadening in the MIR region up to 16µm pumped at 4µm
with a lower peak power of 3 kW. Actual experimental situation will be different from numerical case as more pump peak power will be required to compensate coupling loss between pump source and TCF structure to obtain identical SC bandwidth in experimental condition.
Among ChG glass compositions, sulphide (S) based ChG
glass has high absorption loss beyond 10µm wavelength. Since
our proposed TCF structure is designed employing GeAsS glass as an outer cladding, definitely this design would show high
ab-sorption loss beyond the 10µm of SC extension. To quantify this
loss problem, we have calculated the confinement factor of the
fundamental mode, H11
x for our proposed TCF design
contain-ing side lengths between 7 and 8µm which is shown Fig. 6(a).
It can be observed from figure that fundamental mode of our TCF design carries 40, 46 and 52 percent of total applied power
through fiber core at a wavelength of 15µm by the structure
containing the side length of 7, 7.5 and 8µm, respectively. On
the other hand, 48 percent of total input power is retained inside
the core of TCF containing side length 8µm at a wavelength
of 16µm. As the core still carries large portion of input power
beyond 10µm, the SC extension beyond this wavelength could
S p e ct ra l P o w e r [d B ] -60 -50 -40 -30 -20 -10 Wavelength [μm]
2 4 6 8 10 12 14 16 18
(a) S p e ct ra l P o w e r [d B ] -60 -50 -40 -30 -20 -10 Wavelength [μm]
2 4 6 8 10 12 14 16 18
(b)
Fig. 8.The comparison of SC output spectrum (a) with and without TPA; (b) using single and dual peak Lorentz function values.
be broadened by core power carrying through the fundamental mode of a TCF design. Since we could not able to obtain the long wavelength absorption edge of core/cladding materials, further SC simulations were carried out to predict the effect of cladding absorption in long wavelength region for the proposed structures by increasing linear loss from 0.5 dB/cm to 2.5 dB/cm which is assumed arbitrarily based on confinement factor ob-tained in Fig. 6(a). Although the output SC spectrum containing
TCF side length of 8µm in Fig. 6(b) shows a deep dip induced
at the middle of the spectrum as a result of high loss, the output spectra of the other two geometries demonstrated in the figure still could be the encouraging predictions by our designs.
To minimize losses, we propose a short length TCF which is 10-mm long. As per as loss concerned, TCF length can be increased and we have shown in Fig. 7 the obtained results by simulating 5 and 10-cm long two TCF structures. It can be observed from Figs. 7(a) and 7(b) that SC bandwidth remains almost same at TCF output and further SC broadening stops after 1-cm of propagation and only the smoothening of the spec-trum takes place up to remaining length of propagation which are shown in Figs. 7(c) and 7(d), respectively. We have carried out further SC simulations for a single input pulse to test the impact of TPA on obtainable SC bandwidth at the TCF output. We have noticed only negligible impact of TPA on output SC bandwidth which is shown in Fig. 8(a). Throughout in all our SC simulations we use single peak AsSe Lorentz function which is different from dual peak Raman frequency response induced by GeAsSe ternary ChG materials. We obtain SC spectrum by
setting up fractional Raman response value fR=0.03 in
numeri-cal simulations which was considered by Petersenet al.[12] for
their recent MIR SC demonstration by tapered photonic crystal fiber made with ternary GeAsSe ChG material. The output SC spectrum obtained between fractional Raman response value of 0.03 and 0.148, which are shown in Fig. 8(b), does not make any significant difference on SC bandwidth though a minor spectral
changes observe between 7 and 13µm, however, the average
power of the two spectrum are same at the TCF output.
SC generation in all-normal dispersion pumping
SC generation in the all-normal dispersion region is less popu-lar than SC generation in the anomalous dispersion regime as more SC broadening can be obtained in anomalous dispersion pumping due to solitonic propagation inside the optical waveg-uide. However, smooth and flat as well as highly coherent SC spectra with moderate bandwidth can be obtained by normal
dispersion pumping [42–47]. In all-normal dispersion pumping,
no solitonic propagation occurs as the SC extends only due to
[image:7.612.314.563.45.154.2]S
p
e
ct
ra
l
P
o
w
e
r
[d
B
]
-60 -50 -40 -30 -20 -10
Wavelength [μm]
2 3 4 5 6 7 8
(a)
S
p
e
ct
ra
l
P
o
w
e
r
[d
B
]
-60 -50 -40 -30 -20 -10
Wavelength [μm]
2 3 4 5 6 7 8
(b)
S
p
e
ct
ra
l
P
o
w
e
r
[d
B
]
-60 -50 -40 -30 -20 -10
Wavelength [μm]
2 3 4 5 6 7 8
(c)
(d) (e) (f)
[image:8.612.55.558.42.478.2](g) (h) (i)
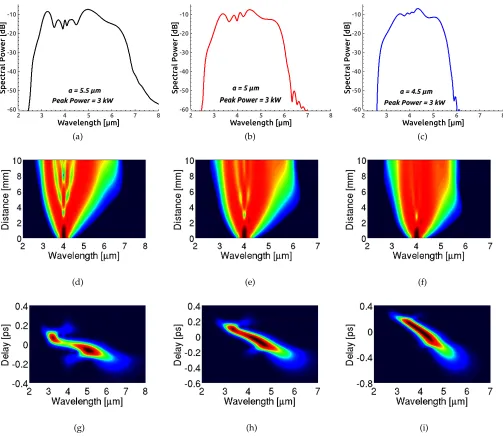
Fig. 9.All-normal dispersion SC spectra(top row), spectral density (middle row), spectrogram (bottom row) represent the TCF
structure with triangle side length of 5.5µm (left column), 5µm (middle column) and 4.5µm (right column), respectively.
self-phase modulation (SPM) and optical wave breaking (OWB). Since no soliton are induced in normal dispersion pumping which limits the spectral broadening, resulting in more flatness in the output SC spectrum that can be highly suitable for preci-sion measurement applications. The pump pulse duration is an another important factor acting in spectral fluctuation reduction and typically pump pulse width should keep less than 100-fs in duration during all-normal dispersion SC generation.
To obtain a smooth and flat MIR SC spectra in all-normal dispersion region, three different TCF structures are engineered
with the variation of side length between 5.5µm and 4.5µm.
The same pump source with the equal power is employed in normal GVD pumping SC generation. Before simulations, the
mode effective areas,Aeff= 9.24µm2, 8.16µm2and 7.2µm2are
evaluated by the FEM mode-solver for the three designs whose GVD curves are shown in Fig. 2(b). The nonlinear coefficients are
calculated asγ= 0.44 /W/m, 0.5 /W/m, 0.56 /W/m at 4µm at
a wavelength of 4µm. At this wavelength, the GVD parameters
for three different designs are calculated as -1.79 ps/nm/km,
-9.95 ps/nm/km, -24.47 ps/nm/km, respectively.
To realize a MIR SC evolution with a pulse duration of 100-fs, the all-normal dispersion SC simulation is performed by launch-ing a fundamental mode of secant pulse into the 10-mm-long optimized TCF with the largest input power of 3 kW. For the
TCF with a side length of 5.5µm, a broadband MIR SC
extend-ing from 2.5 to around 7µm could be generated containing
some minor spectral fluctuation around the pump wavelength as shown in solid black line in Fig. 9(a). The other two TCF
designs with side length of 5 and 4.5µm are optimized in such a
way that the GVD parameters at the pump wavelength become lowered (dotted red and dashed blue curves in Fig. 2(b)) which significantly reduces the spectral fluctuation around the pump source as can be seen in Fig. 9(b) and 9(c) (dotted red and dashed blue lines), respectively. The predicted SC evolution extending
up to 6.2µm and 5.8µm are achieved by these two structures.
|g
(1
) 12
|
0 0.2 0.4 0.6 0.8 1
Wavelength [μm]
[image:9.612.93.240.46.158.2]2 3 4 5 6 7
Fig. 10.First-order coherence simulated over the entire SC
bandwidth for the TCF geometry containing side lengtha=
5.5µm corresponding to the Figs. 9(a), 9(d) and 9(g) (entire left
column), respectively.
Spectral densities (middle row) and spectrograms (bottom row) are given in Fig. 9, corresponding to all-normal dispersion SC spectra obtained in Fig. 9 (top row) to show how the SC spectra evolves along the length of the optimized 10-mm-long TCF design. As mentioned earlier, SC evolution in all-normal dispersion pumping is mainly dominated initially by SPM and later by OWB. In the case of all-normal dispersion SC evolution, one has to initially observe the symmetrical spectral extension around the pump wavelength due to SPM when an ultra short pulse launches into the TCF structure. Later, an overlap occurs among different frequency components owing to the longer wavelength components propagating faster than their shorter wavelength counterparts. In the temporal domain, the OWB results in the overlap of two pulse components generates new frequency components, creating the two side lobs in the blue and red wavelength component sides of the SC spectra as can be seen in both spectral density evolutions and spectrograms of Fig. 9 (top and bottom rows, respectively).
Finally, the coherence of the output of all-normal dispersion
SC spectra obtained for a TCF structure containing side lengtha
= 5.5µm from an ensemble average is calculated using Eq. (7)
from twenty independently simulated SC spectra pairs. For co-herence calculation, the input pump pulse is increased by adding random noise with 1% of the pulse intensity during all-normal dispersion SC simulations. Figure 10 shows the modulus of
com-plex degree of first-order coherence|g12(1)(λ)|=1 which implies
the SC output is highly coherent over the entire bandwidth for this design. Similar results are obtained for the remaining two TCF geometries optimized for pumping in all-normal dispersion region as well.
CONCLUSION
In this work, a 10-mm-long dispersion engineered all-chalcogenide triangular core microstructured fiber for MIR SC generation from the anomalous dispersion pumping to normal dispersion pumping region is proposed and simulated. In the case of anomalous dispersion pumping, three TCF geometries are optimized by varying their side length for pumping at a
wavelength of 4µm. An ultrabroadband MIR SC spectral
evolu-tion covering the wavelength range 2.2-13.5µm could be
gener-ated by the optimized TCF structure containing side length of
7µm. By increasing the side length to 7.5µm, SC spectral
evolu-tion can be extended up to 15µm. The bandwidth can further be
enhanced beyond 15µm by increasing the side length to 8µm
by the proposed TCF design. In all cases, the largest low pump
peak power of 3 kW is used. This is the encouraging prediction by our design, however, bandwidth could somewhat actually be reduced owing to long wavelength cladding absorption at the TCF output.
For all-normal dispersion pumping, the TCF structure is op-timized by varying its side length for broadband ultraflat SC generation in the MIR region. To investigate spectrum flatness, three different designs have been proposed depending on its
side length variation between 5.5µm and 4.5µm. It has been
ob-served from these designs that the SC spectra can be spanned up
to 7µm in the MIR region by using a TCF structure containing
side length of 5.5µm. Slight spectral fluctuation can be observed
between both side of the pump source by this design. The spec-tral flatness can be improved by reducing the side-length, which eventually reduces bandwidth slightly at the TCF output.
The two different all-chalcogenide novel TCFs proposed and modelled for operation in the anomalous and all-normal dis-persion MIR region SC generation can be used in molecular fingerprint spectroscopy, atmospheric gas sensing, biomedical imaging as well as many more fiber based broadband applica-tions.
ACKNOWLEDGEMENT
Funding for this research was provided by the Ministry of Higher Education (MOHE) under the grants LRGS (2015) NGOD/UM/KPT and the University of Malaya under the grant RP029A-15 AFR and RU001-2017.
REFERENCES
1. A. Schliesser, N. Picque, and T. W. Haensch, “Mid-infrared frequency combs," Nat. Photonics6, 440–449 (2012).
2. M. Michalska, J. Mikolajczyk, J. Wojtas, and J. Swiderski, “Mid-infrared, super-flat, supercontinuum generation covering the 2–5µm spectral band using a fluoroindate fibre pumped with picosecond pulses," Sci. Reports6, 39138 (2016).
3. J. M. Dudley, G. Genty, and S. Coen, “Supercontinuum generation in photonic crystal fiber," Rev. Mod. Phys.78(4), 1135–1184 (2006). 4. B. J. Eggleton, B. Luther-Davies, and K. Richardson, “Chalcogenide
photonics," Nat. Photonics5, 141–148 (2011).
5. T. Cheng, K. Nagasaka, T. H. Tuan, Xiaojie Xue, M. Matsumoto, H. Tezuka, T. Suzuki, and Y. Ohishi, “Mid-infrared supercontinuum generation spanning 2 to 15.1µm in a chalcogenide step-index fiber," Opt. Lett.41, 2117-2120 (2016).
6. X. Gai, T. Han, A. Prasad, S. Madden, D. Y. Choi, R. Wang, D. Bulla, and B. Luther-Davies, “Progress in optical waveguides fabricated from chalcogenide glasses," Opt. Express18(25), 26635–26646 (2010). 7. Y. Yu, X. Gai, T. Wang, P. Ma, R. Wang, Z. Yang, D. Choi, S. Madden,
and B. Luther-Davies, “Mid-infrared supercontinuum generation in chalcogenides," Opt. Mater. Express3(8) 1075–1086 (2013). 8. C. Markos, I. Kubat, and O. Bang, “Hybrid polymer photonic crystal
fiber with integrated chalcogenide glass nanofilms," Sci. Reports4, 6057 (2014).
9. C. Wei, X. Zhu, R. A. Norwood, F. Seng, and N. Peyghambarian, “Numerical investigation on high power mid-infrared supercontinuum fiber lasers pumped at 3µm," Opt. Express21(24), 29488–29504 (2013).
10. C. R. Petersen, U. Mφller, I. Kubat, B. Zhou, S. Dupont, J. Ramsay, T. Benson, S. Sujecki, M. Abdel-Moneim, Z. Tang, D. Furniss, A. Seddon, and O. Bang, “Mid-infrared supercontinuum covering the 1.4-13.3
µm molecular fingerprint region using ultra-high NA chalcogenide step-index fiber," Nat. Photonics8, 830–834 (2014).
11. Z. Zhao, B. Wu, X. Wang, Z. Pan, Z. Liu, P. Zhang, X. Shen, Q. Nie, S. Dai, and R. Wang, “Mid-infrared supercontinuum covering 2–16
µm in a low-loss telluride single-mode fiber," Laser Photonics Rev.2,
1700005 (2017).
12. C. R. Petersen, R. D. Engelsholm, C. Markos, L. Brilland, C. Caillaud, J. Troles, and O. Bang, “Increased mid-infrared supercontinuum band-width and average power by tapering large-mode-area chalcogenide photonic crystal fibers," Opt. Express25, 15336–15348 (2017). 13. D. D. Hudson, S. Antipov, L. Li, I. Alamgir, T. Hu, M. El-Amraoui, Y.
Messaddeq, M. Rochette, S. D. Jackson, and A. Fuerbach, “Toward all-fiber supercontinuum spanning the mid-infrared," Optica4, 1163–1166 (2017).
14. U. Møller, Y. Yu, I. Kubat, C. R. Petersen, X. Gai, L. Brilland, D. Mechin, C. Caillaud, J. Troles, B. Luther-Davies, and O. Bang, “Multi-milliwatt mid-infrared supercontinuum generation in a suspended core chalco-genide fiber," Opt. Express23(3), 3282–3291 (2015).
15. Y. Yu, X. Gai, P. Ma, K. Vu, Z. Yang, R. Wang, D. Choi, S. Madden, and B. Luther-Davies, “Experimental demonstration of linearly polarized 2-10µm supercontinuum generation in a chalcogenide rib waveguide,"
Opt. Lett.41(5), 958–961 (2016).
16. Z. Zhao, X. Wang, S. Dai, Z. Pan, S. Liu, L. Sun, P. Zhang, Z. Liu, Q. Nie, X. Shen, and R. Wang, “1.5-14µm mid-infrared supercontinuum generation in a low-loss Te-based chalcogenide step-index fiber," Opt. Lett.41, 5222–5225 (2016).
17. Y. Yu, B. Zhang, X. Gai, C. Zhai, S. Qi, W. Guo, Z. Yang, R. Wang, D. Choi, S. Madden, and B. Luther-Davies, “1.8-10µm mid-infrared supercontinuum generated in a step-index chalcogenide fiber using low peak pump power," Opt. Lett.40, 1081–1084 (2015).
18. C. R. Petersen, P. M. Moselund, C. Petersen, U. Mφller, and O. Bang, “Spectral-temporal composition matters when cascading supercon-tinua into the mid-infrared," Opt. Express24, 749–758 (2016). 19. I. Kubat, C. S. Agger, U. Mφller, A. B. Seddon, Z. Tang, S. Sujecki, T.
M. Benson, D. Furniss, S. Lamrini, K. Scholle, P. Fuhrberg, B. Napier, M. Farries, J. Ward, P. M. Moselund, and O. Bang, “Mid-infrared supercontinuum generation to 12.5 µm in large NA chalcogenide
step-index fibres pumped at 4.5µm," Opt. Express22, 19169–19182
(2014).
20. M. R. Karim, B. M. A. Rahman, and G. P. Agrawal, “Mid-infrared super-continuum generation using dispersion-engineered Ge11.5As24Se64.5
chalcogenide channel waveguide," Opt. Express23(5), 6903–6914 (2015).
21. T. S. Saini, A. Kumar, and R. K. Sinha, “Broadband mid-infrared su-percontinuum spectra spanning 2-15µm using As2Se3chalcogenide
glass triangular-core graded-index photonic crystal fiber,” J. Lightw. Technol.33(18), 3914–3920 (2015).
22. I. Kubat, C.R. Petersen, U. Mφller, A. Seddon, T. Benson, L. Brilland, D. Mechin, P.M. Moselund, and O. Bang, “Thulium pumped mid-infrared 0.9-9µm supercontinuum generation in concatenated fluoride and chalcogenide glass fibers," Opt. Express22, 3959–3967 (2014). 23. M. R. Karim, B. M. A. Rahman, Y. O. Azabi, A. Agrawal, and G.
P. Agrawal, “Ultra-broadband mid-infrared supercontinuum genera-tion through dispersion engineering of chalcogenide microstructured fibers," J. Opt. Soc. Am. B32(11), 2343–2351 (2015).
24. P. Ma, D. Y. Choi, Y. Yu, X. Gai, Z. Yang, S. Debbarma, S. Madden, and B. Luther-Davies, “Low-loss chalcogenide waveguides for chemi-cal sensing in the mid-infrared," Opt. Express21(24), 29927–29937 (2013).
25. B. M. A. Rahman and J. B. Davies, “Finite-element solution of inte-grated optical waveguides," J. Lightw. Technol.2, 682–688 (1984). 26. G. P. Agrawal, Nonlinear Fiber Optics 5th ed. (Academic, San Diego,
California, 2013).
27. X. Gai, S. Madden, D. Y. Choi, D. Bulla, and B. Luther-Davies, “Disper-sion engineered Ge11.5As24Se64.5nanowires with a nonlinear
parame-ter of 136 W−1m−1at 1550 nm," Opt. Express18(18), 18866–18874 (2010).
28. M. R. Karim and B. M. A. Rahman, “Ultra-broadband mid-infrared supercontinuum generation using chalcogenide rib waveguide," Opt. Quant. Electron.48(3), 174 (2016).
29. V. V. R. K. Kumar, A. K. George, W. H. Reeves, J. C. Knight, P. St. J. Russell, F. G. Omenetto, and A. J. Taylor, “Extruded soft glass photonic crystal fiber for ultrabroad supercontinuum generation," Opt. Express10, 1520–1525 (2002).
30. T. Wang, X. Gai, W. Wei, R. Wang, Z. Yang, X. Shen, S. Madden, and B. Luther-Davies, “Systematic z-scan measurements of the third order nonlinearity of chalcogenide glasses," Opt. Mater. Express4(5), 1011–1022 (2014).
31. A. Al-Kadry, L. Li, M. E. Amraoui, T. North, Y. Messaddeq, and M. Rochette, “Broadband supercontinuum generation in all-normal disper-sion chalcogenide nanowires," Opt. Lett.40(20), 4687–4690 (2015). 32. B. Siwicki, M. Klimczak, R. Stepien, and R. Buczynski,
“Supercontin-uum generation enhancement in all-solid all-normal dispersion soft glass photonic crystal fiber pumped at 1550 nm," Opt. Fiber Tech.25, 64–71 (2015).
33. L. Liu, T. Cheng, K. Nagasaka, H. Tong, G. Qin, T. Suzuki, and Y. Ohishi, “Coherent mid-infrared supercontinuum generation in all-solid chalcogenide microstructured fibers with all-normal dispersion," Opt. Lett.41(2), 392–395 (2016).
34. G. Stepniewski, M. Klimczak, H. Bookey, B. Siwicki, D. Pysz, R. Stepien, A. K. Kar, A. J. Waddie, M. R. Taghizadeh, and R. Buczynski, “Broadband supercontinuum generation in normal dispersion all-solid photonic crystal fiber pumped near 1300 nm," Laser Phys. Lett.11, 055103 (2014).
35. Z. Guo, J. Yuan, C. Yu, X. Sang, K. Wang, B. Yan, L. Li, S. Kang, and X. Kang, “Highly coherent supercontinuum generation in the normal dispersion liquid-core photonic crystal fiber," Prog. in Elec. Res.48, 67–76 (2016).
36. M. R. Karim, H. Ahmad, and B. M. A. Rahman: “All-normal-dispersion chalcogenide waveguides for ultraflat supercontinuum generation in the mid-infrared region", IEEE J. Quan. Elec.53(2) (2017). 37. A. B. Salem, R. Cherif, and M. Zghal, “Raman response of a highly
nonlinear As2Se3-based chalcogenide photonic crystal fiber," Proc.
PIERS, Morocco, 1256 (2011).
38. X. Gu, M. Kimmel, A. P. Shreenath, R. Trebino, J. M. Dudley, S. Coen, and R. S. Windeler, Experimental studies of the coherence of microstructure-fiber supercontinuum, Opt. Express11(21), 2697-2703 (2003).
39. Y. Yu, B. Zhang, X. Gai, P. Ma, D. Choi, Z. Yang, R. Wang, S. Deb-barma, S. J. Madden, and B. Luther-Davies, “A broadband, quasi-continuous, mid-infrared supercontinuum generated in a chalcogenide glass waveguide," Laser Photonics Rev., 1–7 (2014).
40. Y. Tang, L. G. Wright, K. Charan, T. Wang, C. Xu, and F. W. Wise, “Generation of intense 100-fs solitons tunable from 2 to 4.3µm in fluoride fiber," Optica3, 948-951 (2016).
41. M. R. Karim, B. M. A. Rahman, and G. P. Agrawal, “Dispersion engi-neered Ge11.5As24Se64.5nanowire for supercontinuum generation: A
parametric study," Opt. Express22(25), 31029–31040 (2014). 42. P. Falk, M. H. Frosz, and O. Bang, “Supercontinuum generation in a
photonic crystal fiber with two zero-dispersion wavelengths tapered to normal dispersion at all wavelengths," Opt. Express13(19), 7535– 7540 (2005).
43. A. M. Heidt “Pulse preserving flat-top supercontinuum generation in all-normal dispersion photonic crystal fibers," J. Opt. Soc. Am. B27(3), 550–559 (2010).
44. A. M. Heidt, A. Hartung, G. W. Bosman, P. Krok, E. G. Rohwer, H. Schwoerer, and H. Bartelt, “Coherent octave spanning near-infrared and visible supercontinuum generation in all-normal dispersion pho-tonic crystal fibers," Opt. Express19(4), 3775–3778 (2011). 45. C. Finot, B. Kibler, L. Provost, and S. Wabnitz, “Beneficial impact of
wave-breaking for coherent continuum formation in normally dispersive nonlinear fibers," J. Opt. Soc. Am. B25(11), 1938–1337 (2008). 46. A. Hartung, A. M. Heidt, and H. Bartelt, “Design of all-normal
disper-sion microstructured optical fibers for pulse-preserving supercontin-uum generation," Opt. Express19(8), 7742-7749 (2011).