Abstract--Partial discharge (PD) testing of high voltage (HV) cables and cable accessories has been implemented predominantly using high frequency current transformers (HFCTs) as PD sensors. PD currents initiating at PD sources are coupled onto cable conductors and travel away from the PD sources and will be detected by HFCTs installed at cable terminations. In this paper, based on combining finite-difference time-domain (FDTD) modeling and transfer function theory, a hybrid modeling approach is proposed to investigate the processes of PD coupling and detection involved in HFCT-based PD testing of HV cables. This approach allows exciting a PD event anywhere in FDTD models of the cables and predicting output from HFCTs some distance away. Implementation of the method is illustrated using an 11 kV XLPE cable. Moreover, a “direct measurement” method to obtain original PD pulses as the excitation source waveform is presented. The modeling approach introduced here will facilitate studies on the relationship between measured PD signals and those excited at PD sources, which can potentially give useful insight into the basic mechanisms behind PD detection in cables.
Index Terms--Finite-difference time-domain (FDTD), transfer functions, high frequency current transformer (HFCT), partial discharge (PD), power cables.
I. INTRODUCTION
ARTIAL discharge (PD) is indicative of local defects and degradation in high voltage insulation and is a popular insulation diagnostic tool. Measurement of PD has been widely carried out for high voltage (HV) cables to allow both detection and location of insulation defects within the cables. The PD sensor used in the measurement is frequently high frequency current transformers (HFCTs), in particular in on-line measurement [1]. The HFCTs are usually clamped at
This research at the University of Strathclyde was supported by EPSRC funding through grant EP/G029210/1. The work was also supported in part by funding of Guizhou University through grant GZU/HR(2016)09 and funding of Guizhou Provisional Education Office through grant QIAN/EDU/KY [2017]102.
Xiao Hu is with Guizhou University, Guiyang, 550025, P. R. China (e-mail: [email protected]). He was with University of Strathclyde, 204 George Street, Glasgow G1 1XW, UK.
W. H. Siew is with University of Strathclyde, 204 George Street, Glasgow G1 1XW, UK (e-mail: [email protected]).
Martin D. Judd is with High Frequency Diagnostics and Engineering Ltd, Glasgow G3 7JT, UK (e-mail: [email protected]).
Alistair J. Reid is with Cardiff University, the Parade, Cardiff CF24 3AA, UK (e-mail: [email protected]).
Bojie Sheng is with Brunel Innovation Centre, TWI, Granta Park, Great Abington, Cambridge, CB21 6AL, UK (e-mail: [email protected]).
cable terminations where the cable inner and outer conductors are accessible. PD current pulses flowing through the cable conductors will be detected by the HFCTs and converted to corresponding voltage pulses at the output terminals of the HFCTs.
PD currents initiating at PD source sites will be subject to significant changes before detection. Attenuation of the PD current pulses has been found as a function of propagated distance in the cables [2]. Furthermore, effects resulting from coupling of the PD currents from the PD sources onto the cable conductors and detection by HFCTs can also make appreciable differences. These effects make it difficult to interpret PD measurement results from the field. To investigate the relationship between PD currents excited at PD sources and PD measurement results from HFCTs in laboratory is both difficult and limited since some defect types cannot easily be reproduced experimentally. Exploring this problem through modeling is more versatile and can potentially provide useful insight.
Finite-Difference Time-Domain (FDTD) methods are used in electrodynamics as a numerical modeling technique to solve electromagnetic (EM) wave problems. Since the first application to EM waves by Yee in 1966 [3], it has grown in popularity for solving time-domain EM problems. The FDTD technique was found to be a useful tool within the field of studies on HV insulation systems and PD monitoring techniques in 2000 [4]. Since then, FDTD modeling has been used to investigate PD propagation problems in GIS [5-7] and transformers [8-10]. FDTD modeling has also been found effective in assisting with optimizing design and installation of UHF PD sensors for GIS and transformers [11,12]. In terms of applications to PD measurement for HV cables, some work has been seen using FDTD modeling to investigate sensitivity of field PD sensors [13,14] and high frequency properties of HV cables [15,16]. However, not much is reported in recent years. Probably due to the fact that modeling of frequency-dependent media such as the semi-conducting (semicon) layers of the cables is not supported by the basic FDTD method. Moreover, the widely used PD sensor like HFCTs is a kind of inductive coupling sensor which is usually made by winding many turns of thin wires onto a toroidal coil. This means that there are going to be too much fine details if proceeding to create physical representations of HFCTs in FDTD models. In this paper, a hybrid modeling approach based on combining FDTD modeling and transfer function
Modeling of High Frequency Current
Transformer Based Partial Discharge Detection
in High Voltage Cables
Xiao Hu, W. H. Siew,
Senior Member
,
IEEE
, Martin D. Judd,
Senior Member
,
IEEE
, Alistair J. Reid,
Senior Member
,
IEEE
and Bojie Sheng
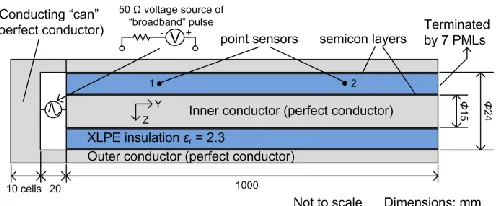
Fig. 1. Structure of the 11 kV XLPE cable sample. MDPE is acronym of medium-density polyethylene. The thickness of the inner semicon, insulation and outer semicon layers is 0.4 mm, 3.4 mm and 0.7 mm, respectively. FDTD is based on numerically approximating and solving
Maxwell’s equations. By gridding a finite region with a sufficient number of electric (E) and magnetic (H) field cells, Maxwell’s equations are solved in a time and space interleaved manner so that time-domain electromagnetic fields throughout the simulated region will be obtained. Being a time-domain technique, FDTD's solutions of which transient responses can be converted to the frequency-domain are able to cover a wide frequency range with one single simulation run, which is ideal for simulating PD pulses, a kind of broadband pulse. For carrying out practical FDTD simulations, both open source and commercial software packages are available. Commercial software usually has a powerful graphical user interface and is both able to deal with complex problems and easy to use. In this work, the commercial FDTD modeling package of XFdtd (ver. 7.1) [17] was employed for all the FDTD simulations and a Dell work station with Xeon CPU of 2.67 GHz and 12 GB RAM have been employed to carry out the FDTD modeling.
Transfer functions are used in signals and systems to describe completely the input-output characteristics of a physical system [18]. In the frequency-domain, a transfer function H(ω) can be expressed as
𝐻(𝜔) =𝑌(𝜔)
𝑋(𝜔) (1)
where Y(ω) and X(ω) are the Fourier transform of the input and output of the system, respectively. Given the transfer function H(ω) of a system the output Y of the system to any input X can be obtained through multiplying H(ω) by the input in the frequency-domain and applying the inverse Fourier transform to the product if the output in the time-domain is sought.
III. FDTDMODELING OF HVCABLES
A 20 m 11 kV XLPE cable manufactured in 2010 according to BS 7870-4.10 was under investigation. The structure and dimensions of the cable are shown in Fig. 1, where r1 and r5 are the inner radius of cable components 1 and 5, respectively. Three-dimensional (3D) models of the cable were created using the built-in 3D modeling tool of XFdtd. The outer conductor of the cable is made of helically applied circular wires. Including the helical wires into the FDTD model can prove to be modeling intensive as well as computing intensive. There has been research considering detailed geometries of cable outer conductors to investigate their effects on high frequency properties of the cables [16,19,20], but in many other examples, these details are not considered. In this study, both inner and outer conductors were created as solid regardless of the detailed geometries.
In defining the electric properties of the materials for the
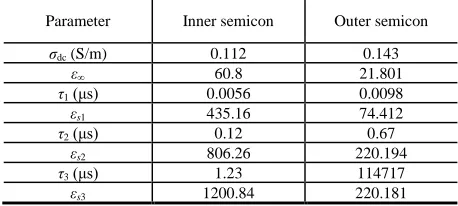
cable structure within the FDTD model, properties of the inner and outer semicon layers were not measured because the semicon layers are bonded to the insulation and it is difficult to get proper samples for measurement. Instead, estimations of the semicon properties were made based on published semicon property data. The complex relative permittivity measured (at 25 °C) for the conductor screen and the insulation screen of a 12 kV XLPE cable in [21] was taken as the initial estimations. An optimization method [22] was used to further improve the accuracy of the estimations. TABLE I lists the final parameters used to define the semicon layers’ properties in the FDTD model. The parameters are defined by a 3-pole Debye function [23] with which the complex relative permittivity of the semicon layers ε* can be expressed as
𝜀∗(𝜔) = 𝜀 ∞+ ∑
𝜀𝑠𝑖−𝜀∞ 1+j𝜔𝜏𝑖+
𝜎dc 𝑗𝜔𝜀0 3
𝑖=1 (2)
where ε∞is the permittivity at infinite frequencies and εsiis the
static permittivity from the ith Debye relaxation process and its relaxation time is τi, and σdc is the DC conductivity, and ε0 = 8.854*10-12 F/m is the permittivity of air. The cable conductors and XLPE insulation within the FDTD model were specified as perfect conductors and an ideal dielectric with εr =
2.3 [24] and σ = 0 S/m, respectively. This means that the skin effect in the conductors and the dielectric loss were not considered in the FDTD model. It is usually not practical to consider the skin effect in conductors within FDTD models because the skin effect decreases the wavelength in conductors with frequency, and at very high frequencies the wavelength can become too small to satisfy a general rule of thumb of the FDTD method, i.e., 10 FDTD cells per wavelength. The dielectric loss in the cable insulation was not considered because the employed modeling package did not provide an appropriate material definition [17]. However, for XLPE-insulated cables, it is the semicon layers that are dominating the high frequency characteristics of the cables [25,26]. It will
TABLEI
3-pole Debye function’s parameters for material definition of the cable semicon layers within the FDTD model.
Parameter Inner semicon Outer semicon
σdc (S/m) 0.112 0.143
ε∞ 60.8 21.801
τ1 (μs) 0.0056 0.0098
εs1 435.16 74.412
τ2 (μs) 0.12 0.67
εs2 806.26 220.194
τ3 (μs) 1.23 114717
[image:2.612.315.565.47.131.2] [image:2.612.324.553.206.309.2]Fig. 2. Axial cross-section of the FDTD model of the 11 kV XLPE cable. Two point sensors 1 and 2 axially spaced for some distance were put within
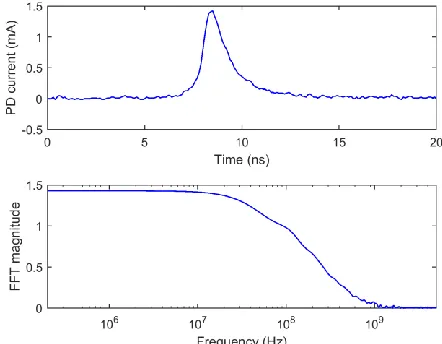
[image:3.612.52.300.47.150.2]the insulation to record electromagnetic fields at corresponding positions. Fig. 3. Waveform and FFT of a “broadband” pulse.
[image:3.612.323.545.53.163.2]Fig. 4. Electric fields recorded by point sensors 1 and 2. The simulation was carried out with a cell size (Δx, Δy, Δz) of (0.20, 20, 0.20) mm and took 1 hour, 48 minutes to complete.
Fig. 5. Cable attenuation represented by the FDTD model of the 11 kV XLPE cable.
be shown later that while only the losses in the semicon layers were represented, expected agreement between the prediction of the FDTD model and measured high frequency attenuation of the cable was achieved within a frequency range of 200 MHz.
IV. EVALUATING ACCURACY OF THE FDTDMODEL
A. Modeling of TDR Measurement
In order to evaluate the accuracy of the FDTD model, modeling of time-domain reflectometry (TDR) measurement on the cable was carried out. Fig. 2 shows an axial cross-section view of the FDTD model where a TDR input module was created at one end of the cable. The other end of the cable was terminated with 7 perfect matched layers (PMLs) which are one of the commonly used boundary conditions of the FDTD method and were used here to avoid reflection from the open end. The TDR source was simulated using a lumped 50 Ω voltage source with the waveform of a “broadband” pulse of which an example is shown in Fig. 3. The “broadband” pulse is a specific waveform definition in the modeling package that is a Gaussian pulse with a bandwidth able to cover the highest frequency content possible for the specific FDTD space [17]. The highest possible frequency is subject to the maximal cell dimension Lmax in meters. For this model, in Cartesian coordinates, an FDTD cell size of (Δx, Δy, Δz) = (0.20, 20, 0.20) mm was applied making Lmax = Δy = 20*10-3 m. The highest possible frequency can be calculated as fmax = c / (10*Lmax) where c is the speed of light in free space, i.e., 3*108 m/s, and thus fmax = 1.5 GHz. The spectrum of the “broadband” pulse will have less than 10 dB attenuation at the highest frequency fmax. With electromagnetic fields recorded by both point sensors (refer to Fig. 2) in FDTD simulations, the cable propagation constant γc can be worked out (e.g., up
to fmax). The electromagnetic fields at the two points, EM1 and
EM2, are related by
FFT[𝐸𝑀2] = FFT[𝐸𝑀1] × 𝑒−𝛾𝑐(𝜔)(𝐿2−𝐿1) (2)
where FFT is the fast Fourier transform, and L1 and L2 are axial distances from point sensors 1 and 2 to the TDR input, respectively. L1 = 0.1 m and L2 = 0.9 m were used in this model.
B. FDTD Simulation Results
The FDTD simulation was carried out requesting results of a sufficient length of time so that both the point sensors can capture the complete TDR input pulse. Fig. 4 shows the radial
direction component of electric fields recorded by the point sensors. In both electric field traces, the first pulse was followed by a few smaller pulses, which was caused by impedance mismatch between the TDR input module and the cable within the model. There was some kind of “ringing” noise starting from about 5 ns in the trace recorded by point sensor 1. This was a result of frequency components of the “broadband” pulse interacting with the FDTD cells. FFT analysis of the electric field suggested that the “ringing” noise frequency was centered at 10 GHz, which was well above the frequency range of interest here and therefore was not of concern.
[image:3.612.322.543.192.307.2] [image:3.612.321.548.354.467.2](a) “Direct measurement” method
(b) Actual connection of the “direct measurement” method Fig. 6. “Direct measurement” method to obtain “original” PD pulses.
Fig. 7. A single positive pulse recorded using the “direct measurement” method and FFT of the pulse. 28 pulses with similar magnitude and shape were recorded. Average rise-time of the pulses is 0.94 ns. Average full width at half magnitude (FWHM) is 1.3 ns. Average -3 dB bandwidth is 96.4 MHz. can only predict the semicon properties with acceptable
accuracy at a limited range of frequencies. Simulation results of another FDTD model created for an 11 kV EPR cable showed that agreement in the cable attenuation between the FDTD model and the corresponding measurement was valid only up to 50 MHz. This was attributed to that good estimations of the cable’s semicon properties were not obtained and moreover the EPR insulation had a dielectric loss tangent of 0.004 which was ten times of that of the XLPE insulation and was not considered in the FDTD model.
V. MEASUREMENT OF EXCITATION SOURCE WAVEFORM To obtain “original” PD pulses that can be used as the source waveform to excite a PD event in the FDTD model, “direct measurement” of PD [28] in a cable was performed. The measurement setup is plotted in Fig. 6a. The actual connection is shown in Fig. 6b. The experiment was conducted on a 1.5 m 11 kV EPR cable sample manufactured in 1983 according to BS 6622. Proper terminations were installed on both ends of the cable sample to avoid termination corona discharges. A potential protrusion defect was introduced into the cable insulation by using a hypodermic needle. The center of a 50 Ω coaxial cable was connected with the needle and the other end of the coaxial cable was connected to the 50 Ω input of an oscilloscope. Since it was a direct connection between the energized sample and the oscilloscope, there was a potential risk of damage in the event of flashover. Therefore, energizing at lower voltages like 5 kV and 6 kV was performed. PD current pulses resulting from the needle were recorded. Fig. 7 shows one of the recorded traces consisting of one single pulse. The single pulse trace can be used to define the waveform of the excitation source in the FDTD model.
VI. MODELING OF HFCT-BASED PDDETECTION IN CABLES
A. Hybrid Modeling Approach
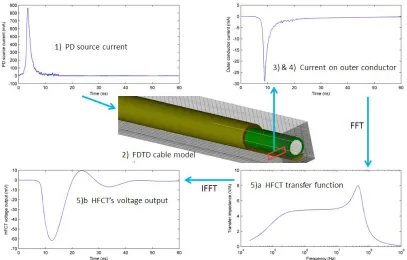
A hybrid approach to modeling of HFCT-based PD testing of HV cables was developed. The approach is based on using FDTD modeling to investigate coupling of PD source currents onto the cable conductors and transfer function theory to work out HFCTs’ voltage output while being input by the PD-induced currents on the cable conductors. Fig. 8 shows this approach as five steps:
Step 1) is the measurement procedure detailed in Section V. Step 2) - An FDTD model of a cable under investigation is created and one of the recorded PD waveforms from Section V is used to define the excitation current as a data file within the model. Simulations are then carried out to characterize the effects caused by coupling of PD currents from the PD source location onto the cable outer conductor.
Step 3) - A method of measuring currents flowing on conductors within FDTD models was developed. The method requires that a sensor loop is created out of point sensors around the cable outer conductor within the FDTD model. The point sensor is used to record magnetic fields at a certain point of the model.
[image:4.612.322.543.369.541.2]Fig. 8. Modeling of HFCT-based PD detection in high voltage cables.
Fig. 10. Illustration of the whole modeling methodology.
Fig. 9. Axial cross-section of the FDTD model of the 11 kV XLPE cable for demonstrating the modeling approach. The cell size used in the FDTD simulation was (Δx, Δy, Δz) = (0.20, 20, 0.20) mm.
around a closed loop.
Step 5) - The complex transfer function of a HFCT can be obtained by simultaneously measuring the HFCT's input and output and then dividing FFT of the output by FFT of the input. The step and pulse responses of the HFCT are measured to construct the low and high frequency parts of the transfer function respectively [29]. Through multiplying the obtained HFCT transfer function by FFT of the currents derived in step 4) and using IFFT, the HFCT's time-domain PD pulse output voltage can be determined.
B. Illustration of the Modeling Approach
As an example, the proposed modeling approach was implemented based on the FDTD model of the 11 kV XLPE cable evaluated in Section IV. To simulate PD detection in the cable, some changes were made, and the updated model is shown in Fig. 9. Both ends of the cable within the model were terminated with 7 PMLs to simulate matched loads. The cable outer conductor was curtailed by 0.2 m at one end and instead an extended outer conductor was made for the remaining 0.2 m to simulate an earth strap on which a HFCT is clamped. According to steps 3) and 4) of the modeling approach, a closed loop consisting of point sensors was created on the extended outer conductor to record magnetic fields. A PD
source was created as a current filament represented using a current source with 0 Ω source impedance. The PD source was defined in the FDTD model on the inner conductor in the middle of the cable. The single pulse trace shown in Fig. 7 was used as the PD source current waveform. After the simulation, magnetic fields recorded by the point sensor loop were integrated to obtain the current flowing on the extended outer conductor. The derived current in combination with a measured HFCT transfer function, converting to the HFCT's voltage output was carried out by following step 5).
[image:5.612.99.506.470.730.2]Fig. 11. Measurement setup for injecting pulses into the cable. The avalanche pulse generator can generate pulses with sub-nanosecond risetime.
(a) The injected pulse with a 1.5 ns rise-time and 6.53 V magnitude.
[image:6.612.322.550.260.430.2](b) The 1st pulse propagating through the EPR cable. The rise-time and magnitude of the pulse are 10.8 ns and 1.43 V, respectively. Fig. 12. Measurement results of the pulse-injecting test.
Fig. 13. The current input and the voltage output of the HFCT. The current pulse was generated with the same avalanche pulse generator as that used in the pulse-injecting test.
cable sample. Fig. 11 shows the measurement setup. The pulse was injected from one end of the cable and measured at the other end. The injected pulse was first of all measured when the 22.3 m test cable was disconnected from the EPR cable and connected to channel 2 of the oscilloscope, and then the measurement was performed with the connection shown in Fig. 11. Measurement results are shown in Fig. 12. The pulse measured at the other end of the cable had magnitude less than one fourth of the injected pulse and the rise-time increased by about seven times. While the increasing rise-time was due to propagating through the EPR cable, the magnitude attenuation was caused not only by propagation effects but also by impedance mismatching at the interfaces between the test cables and the EPR cable. This test did not include measurements using the HFCT but another test [29] to characterize the transfer function of the HFCT made use of the same avalanche pulse generator to excite the HFCT and the HFCT output (as shown in Fig. 13) shows clear difference from the input pulse. The experimental results presented here are not meant to be a direct comparison with the modeling detailed in Section VI but some similarities between the experimental and modeling results, such as attenuation of pulse magnitude and distortion of pulse shape, are indeed observed. The experimental results show some typical effects that contribute to the change of PD signals when HFCT-based PD testing of cables is conducted. It has been envisaged that these effects can be further investigated using the proposed modeling approach.
VIII. DISCUSSION
A. Potential Advantages of the Modeling Methodology
Although the illustration of the modeling approach in Section VI is basic, the purpose is to show how the approach will work on an “original” PD current pulse and prove effectiveness of the model. Some potential advantages of the modeling approach are summarized as follows:
1. By creating 3D models of the cables, both the cable cross-sectional and axial details can be characterized. Therefore, modeling earth connections, terminations, joints and various defects are all possible.
2. By exciting a PD pulse anywhere in the created models, the PD-induced currents on the cable inner and outer conductors some distance away from the PD launching site can be predicted. This permits variations in physical parameters of the PD that would not be possible in practical experiments.
3. Instead of physically modeling HFCTs in FDTD models, implementing the effect of HFCTs using the transfer function method is more practical and makes it easier to compare different HFCTs.
B. Implementation of the Approach
[image:6.612.315.566.476.558.2]modern polymeric-insulated cables. Instead of practical measurement, a possible solution of using published semicon properties and an optimization method can be adopted. This solution was found effective in the modeling of the 11 kV XLPE cable where the cable attenuation predicted by the FDTD model agreed appropriately with the measurement result. However, it is worth noting that the FDTD technique being a time-domain method has a relatively limited capability in dealing with frequency-dependent materials like the semicon layers of polymeric-insulated cables. For modeling the semicon layers, the most appropriate material definition provided in the software package XFdtd is based on the Debye function which can only fit the semicon properties at limited frequencies. As a result, the frequency range where the FDTD models can predict the cable attenuation will be limited, e.g., within 200 MHz for the 11 kV XLPE cable. While the modeling work presented in this paper is based on a XLPE cable the principles are readily applicable to other cables, such as EPR cables and paper-insulated cables. However, it must be emphasized that the dielectric losses in the insulation of these cables are substantially different to those of XLPE cables where the cable attenuation is predominantly caused by the losses in the semicon layers. Therefore, for modeling of EPR cables and paper-insulated cables, it would be necessary to construct the model appropriately to represent the predominant loss mechanisms so that sufficient modeling accuracy can be achieved.
IX. CONCLUSIONS
An FDTD model of an 11 kV XLPE cable was created in this study. The semicon layers of the cable were created out of the Debye medium in the FDTD model and the parameters of the corresponding Debye function were obtained based on published data of cable semicon properties. The simulation results suggest that the cable attenuation represented by the FDTD model can achieve appropriate agreement with the measurement result within a frequency range of 200 MHz. A hybrid modeling approach based on combining FDTD modeling and transfer function theory was developed to investigate the PD coupling and detection processes involved in HFCT-based PD testing of HV cables. Implementation of the method has been detailed and illustrated. Furthermore, a “direct measurement” method to obtain “original” PD pulses necessary for the modeling has been described. The resulting modeling approach can be used to investigate the relationship between measured PD signals and those excited at PD sources, which is expected to improve our understanding of PD measurement for cables and interpretations of the measurement results. Future work will involve modeling of cable joints and terminations with more complex structures. Moreover, the possibility of applying the inverse transfer function to infer the PD source current pulse based on measurements at a HFCT sensor will be explored, which would improve diagnostic capabilities for measurements in the field.
X. REFERENCES
[1] G. C. Stone, “Partial discharge diagnostics and electrical equipment insulation condition assessment”, IEEE Trans. Dielectr. Electr. Insul., vol. 12, no. 5, pp. 891-904, 2005.
[2] S. Boggs, A. Pathak, and P. Walker, “Partial discharge. XXII. High frequency attenuation in shielded solid dielectric power cable and implications thereof for PD location”, IEEE Electr. Insul. Mag., vol. 12, no. 1, pp. 9-16, 1996.
[3] K. S. Yee, “Numerical solution of initial boundary value problems involving Maxwell’s equations in isotropic media”, IEEE Trans. Antennas Propag., vol. 14, no. 3, pp. 302-307, 1966.
[4] M. D. Judd, “Using finite difference time domain techniques to model electrical discharge phenomena”, in 2000 Annu. Rep. Conf. Electr. Insul. Dielectr. Phenom., vol. 2, pp. 518-521, Victoria, BC, Canada, Oct. 2000. [5] S. Okabe, S. Yuasa, S. Kaneko, M. Yoshimura, H. Muto, H. Yoshiyasu, C. Nishida, and M. Kamei, “Simulation of propagation characteristics of higher order mode electromagnetic waves in GIS”, IEEE Trans. Dielectr. Electr. Insul., vol. 13, no. 4, pp. 855-861, 2006.
[6] T. Hoshino, S. Maruyama, and T. Sakakibara, “Simulation of propagating electromagnetic wave due to partial discharge in GIS using FDTD”, IEEE Trans. Power Del., vol. 24, no. 1, pp. 153-159, 2009. [7] T. Li, X. Wang, C. Zheng, D. Liu and M. Rong, “Investigation on the
placement effect of UHF sensor and propagation characteristics of PD-induced electromagnetic wave in GIS based on FDTD method”, IEEE Trans. Dielectr. Electr. Insul., vol. 21, no. 3, pp. 1015-1025, 2014. [8] L. Yang, M. D. Judd, and G. Costa, “Simulating propagation of UHF
signals for PD monitoring in transformers using the finite difference time domain technique [power transformers]”, in 2004 Annu. Rep. Conf. Electr. Insul. Dielectr. Phenom., pp. 410-413, Boulder, CO, Oct. 2004. [9] Zhiguo Tang, Chengrong Li, Wei Wang, Hui Wang, Li Wang, and
Yansheng Ding, “The propagation characteristics of electromagnetic wave generated from partial discharges in power transformer by FDTD simulation”, in 2007 Annu. Rep. Conf. Electr. Insul. Dielectr. Phenom., pp. 200-203, Vancouver, BC, Oct. 2007.
[10] M. Hikita, “Recent progress in diagnosis of electric power apparatus using non-conventional partial discharge measurements”, in 2016 Int. Conf. Condition Monitoring and Diagnosis (CMD), pp. 9-13, Xi'an, China, Sept. 2016.
[11] A. J. Reid, M. Stewart, and M. D. Judd, “FDTD modeling of UHF partial discharge sensor response”, in 2009 Int. Conf. Sustainable Power Generation and Supply (SUPERGEN), pp. 1-4, Nanjing, China, Apr. 2009.
[12] A. M. Ishak, M. T. Ishak, M. T. Jusoh, S. F. Syed Dardin and M. D. Judd, “Design and Optimization of UHF Partial Discharge Sensors Using FDTD Modeling”, IEEE Sensors J., vol. 17, no. 1, pp. 127-133, Jan. 2017.
[13] R. Heinrich, R. Jobava, W. Kalkner, and A. Gheonjian, “Numerical modeling for investigation and optimization of a sensor for sensitive partial discharge detection on high-voltage XLPE cables”, European Trans. Electr. Power, vol. 10, pp. 161-166, 2000.
[14] D. Pommerenke, R. Jobava, and R. Heinrich, “Numerical simulation of partial discharge propagation in cable joints using the finite difference time domain method”, IEEE Electr. Insul. Mag., vol. 18, no. 6, pp. 6-11, 2002.
[15] Y. Baba, N. Tanabe, N. Nagaoka, and A. Ametam, “Transient analysis of a cable with low-conducting layers by a finite-difference time-domain method”, IEEE Trans. Electromagn. Compat., vol. 46, no. 3, pp. 488-493, 2004.
[16] R. Papazyan, P. Pettersson, and D. Pommerenke, “Wave propagation on power cables with special regard to metallic screen design”, IEEE Trans. Dielectr. Electr. Insul., vol. 14, no. 2, pp. 409-416, 2007.
[17] Remcom Inc, XFdtd Reference Manual, 7.1 ed., PA, USA, 2010. [18] C. L. Phillips, J. Parr, and E. Riskin, Signals, Systems, and Transforms,
Pearson Education, New Jersey, 2008.
[19] Jim Jun Guo and S. A. Boggs, “High frequency signal propagation in solid dielectric tape shielded power cables”, IEEE Trans. Power Del., vol. 26, no. 3, pp. 1793-1802, 2011.
[20] Chunchuan Xu and S. A. Boggs, “High frequency properties of shielded power cable part 3: loss from neutral wire-shield interaction”, IEEE Electr. Insul. Mag., vol. 23, no. 2, pp. 12-16, 2007.
frequency properties of shielded power cable part 1: overview of mechanisms”, IEEE Electr. Insul. Mag., vol. 21, no. 6, pp. 24-28, 2005. [26] G. Mugala, R. Eriksson, and P. Pettersson, “Dependence of XLPE
insulated power cable wave propagation characteristics on design parameters”, IEEE Trans. Dielectr. Electr. Insul., vol. 14, no. 2, pp. 393-399, 2007.
[27] R. Papazyan and R. Eriksson, “Calibration for time domain propagation constant measurements on power cables”, IEEE Trans. Instrum. Meas., vol. 52, pp. 415-418, 2003.
[28] A. J. Reid, M. D. Judd, B. G. Stewart, and R. A. Fouracre, “Partial discharge current pulses in SF6 and the effect of superposition of their radiometric measurement”, J. Phys. D: Appl. Phys., vol. 39, pp. 4167-4177, 2006.
[29] X. Hu, W. H. Siew, M. D. Judd and X. Peng, “Transfer function characterization for HFCTs used in partial discharge detection”, IEEE Trans. Dielectr. Electr. Insul., vol. 24, no. 2, pp. 1088-1096, 2017.
XI. BIOGRAPHIES
Xiao Hu graduated from Xi'an Jiaotong University with a B.Sc. degree and a
M.Sc. degree in electrical engineering in 2006 and 2009, respectively. He received his Ph.D. degree from the University of Strathclyde in 2014 for research on FDTD modeling of partial discharge in high voltage cables. He was a PhD student and later a research assistant in the University of Strathclyde. Currently, he is a lecture in Guizhou University, China and his research includes partial discharge measurement and modeling.
W. H. Siew is a Professor in the Department of Electronic & Electrical Engineering, University of Strathclyde, Glasgow, Scotland. He is a triple alumnus of the University of Strathclyde with degrees in B.Sc. (Hons) in Electronic & Electrical Engineering; Ph.D. in Electronic & Electrical Engineering; and Master of Business Administration. His areas of research include large systems electromagnetic compatibility; cable diagnostics; lightning protection; and wireless sensing systems. He is the Convener of CIGRE WG C4.30; a member of the Technical Advisory Panel for the IET Professional Network on Electromagnetics; and a member of IEEE TC5 & TC7 and CIGRE WG C4.31. He is also involved in the maintenance of IEC 61400-24. He is a Chartered Engineer and is an MIEE and a SMIEEE.
Martin D. Judd (M'02-SM'04) is now the Technical Director of High
Frequency Diagnostics Ltd, Glasgow, Scotland. He was born in Salford, England in 1963 and graduated from the University of Hull in 1985 with a first class (Hons) degree in electronic engineering, after which he gained 8 years of industrial experience, first with Marconi Electronic Devices and then with EEV Ltd. Martin received his Ph.D. degree from the University of Strathclyde in 1996 for research into the excitation of UHF signals by partial discharges in gas insulated switchgear. He has worked extensively on UHF partial discharge location techniques for power transformers and was latterly Professor of High Voltage Technologies at the University of Strathclyde, where he managed the High Voltage Research Laboratory. In 2014 he founded High Frequency Diagnostics, a specialist consultancy business that works in partnership with companies developing new electromagnetic wave sensor technologies and applications.
Alistair J. Reid (M'11-SM'15) graduated from the University of Strathclyde in 2004 with a B.Eng. (Hons) Degree in Electrical and Mechanical Engineering and received the Ph.D. Degree in 2007 for research on partial discharge monitoring. He conducted post-doctoral research within the Institute for Energy and Environment at the University of Strathclyde from 2007-2011, studying advanced radiometric techniques for partial discharge detection and diagnostic monitoring. In 2011 he gained a Research Fellowship at Glasgow Caledonian University and in 2013 was awarded a Visiting Research position at California Institute of Technology's Department of Computing and Mathematical Sciences. He is presently a Lecturer within Cardiff University's School of Engineering researching diagnostic monitoring techniques within the Advanced High Voltage Engineering Research Group. His interests focus