R E S E A R C H
Open Access
Comparative transcriptome analysis of
second- and third-generation merozoites of
Eimeria necatrix
Shijie Su
1,2,3, Zhaofeng Hou
1,2,3, Dandan Liu
1,2,3, Chuanli Jia
1,2,3, Lele Wang
1,2,3, Jinjun Xu
1,2,3and Jianping Tao
1,2,3*Abstract
Background:Eimeriais a common genus of apicomplexan parasites that infect diverse vertebrates, most notably poultry, causing serious disease and economic losses.Eimeriaspecies have complex life-cycles consisting of three developmental stages. However, the molecular basis of theEimeriareproductive mode switch remains an enigma. Methods:Total RNA extracted from second- (MZ-2) and third-generation merozoites (MZ-3) ofEimeria necatrixwas subjected to transcriptome analysis using RNA sequencing (RNA-seq) followed by qRT-PCR validation.
Results:A total of 6977 and 6901 unigenes were obtained from MZ-2 and MZ-3, respectively. Approximately 2053 genes were differentially expressed genes (DEGs) between MZ-2 and MZ-3. Compared with MZ-2, 837 genes were upregulated and 1216 genes were downregulated in MZ-3. Approximately 95 genes in MZ-2 and 48 genes in MZ-3 were further identified to have stage-specific expression. Gene ontology category and KEGG analysis suggested that 216 upregulated genes in MZ-2 were annotated by 70 GO assignments, 242 upregulated genes were associated with 188 signal pathways, while 321 upregulated genes in MZ-3 were annotated by 56 GO assignments, 322 upregulated genes were associated with 168 signal pathways. The molecular functions of upregulated genes in MZ-2 were mainly enriched for protein degradation and amino acid metabolism. The molecular functions of upregulated genes in MZ-3 were mainly enriched for transcriptional activity, cell proliferation and cell differentiation.
Conclusions:To the best of our knowledge, this is the first RNA-seq data study of the MZ-2 and MZ-3 stages ofE. necatrix; it demonstrates a high number of differentially expressed genes between the MZ-2 and MZ-3 ofE.necatrix. This study forms a basis for deciphering the molecular mechanisms underlying the shift from the second to third generation schizogony inEimeria. It also provides valuable resources for future studies onEimeria, and provides insight into the understanding of reproductive mode plasticity in differentEimeriaspecies.
Keywords:Eimeria, Merozoite, RNA-seq, Comparative transriptomes, Differentially expressed genes
Background
Avian coccidiosis is a major worldwide veterinary health challenge caused by the obligate intracellular protozoan parasites of the phylum Apicomplexa, Eimeria. Clinical coccidiosis causes a reduction in weight gain, ineffective feed-conversion, and high levels of mortality. Although coccidiosis is a well-known disease, it still remains one of
the most economically important parasitic diseases of the poultry industry throughout the world. It has been esti-mated that the total annual cost for avian coccidiosis con-trol is approximately $30–60 million in China [1], and the global cost is likely greater than $800 million annually [2]. With the development of drug resistance in Eimeria spe-cies threatening the continued use of prophylactic anticoc-cidials, vaccination remains a desirable long-term strategy for combatting this disease [3].
The life-cycle of Eimeria spp. is the most straight-forward of any apicomplexan parasite and includes merogony, gametogony and sporogony. Parasites are trans-mittedvia sporulated oocysts. Once ingested, sporozoites * Correspondence:[email protected]
1College of Veterinary Medicine, Yangzhou University, Yangzhou 225009,
China
2Jiangsu Co-innovation Center for Prevention and Control of Important
Animal Infectious Diseases and Zoonoses, Yangzhou University, Yangzhou 225009, China
Full list of author information is available at the end of the article
are released from the oocysts into intestinal epithelial cells. Several asexual cycles result in the growth of merozoites, which differentiate into the sexual stages. Female macroga-metes are fertilized by male microgamacroga-metes to produce oo-cysts, which are shed in the feces of infected hosts. After sporulation in the external environment, oocysts can infect other animals once consumed. At different developmental stages, the genes expressed, as well as the levels of gene ex-pression, vary. Although the second- and third-generation
meronts and merozoites belong to the asexual
reproduction stage, the mature second- and third-generationE. tenellamerozoites and meronts can be differ-entiated by periodic acid Schiff’s (PAS) staining, concluded by Klimes et al. [4]. Cornelissen et al. [5, 6] also found that the two generation merozoites ofE. tenellacould be differ-entiated by Feulgen-pararosaniline staining. These reports indicated that the second- and third-generation merozoites had already been sexually differentiated. The differentiation and development of different biological stages are dependent on the regulation of gene transcription. A few stage-specific genes have been identified in oocysts, sporo-zoites and second-generation merosporo-zoites of E. tenella, E. maximaandE.acervulina[7–9] in tachyzoites, sporozoites and oocysts ofToxoplasma gondii [10–13] and in human and mosquito stages [14] and gametocyte stages of Plasmo-dium falciparum [15], based on profiling quantitative changes in gene transcription. To date, a global analysis of gene transcription has not yet to be performed for every stage of the coccidian life-cycle, due in part to difficulties in producing sufficient quantities of parasitic material for conventional transcriptional analysis.
Eimeria necatrixis a highly pathogenic coccidium that can cause high mortality in susceptible birds. Coccidiosis caused by E. necatrix mainly occurs in chickens older than 8 weeks when raised on a litter floor [16, 17]. Com-pared with other species of avian coccidia, the life-cycle ofE.necatrixis somewhat distinct. Its first- and second-generation meronts are primarily located in the mid-intestinal area of host chickens, and its third-generation meronts, and later oocyst development, occur only in the cecum [18]. Therefore, it is relatively easy to obtain sufficient quantities of the second- and third-generation merozoites through isolation from the mid-intestine and cecum, respectively, of chickens.
To the best of our knowledge, there are no reports to date concerning analysis of the transcriptome of the sec-ond- and third-generation merozoites ofE.necatrix, nor of its stage-specific genes. The process of MZ-2 conversion to MZ-3 is confusing, and an issue on whether sex develop-ment and differentiation has happened in MZ-3 is also not clear. In the present study, therefore, we conducted RNA sequencing using a next-generation sequencer to identify differentially expressed gene (DEG) profiling from the sec-ond- and third-generation merozoites of E. necatrix. To
gain an understanding of the biology of the differentiation and development of E. necatrix, we determined the expressed mRNAs at these stages and the relevant meta-bolic pathways based on information from other species in the GenBank database. The putative roles of selected DEGs and significantly enriched signal pathways are po-tentially involved in the switching from the second to the third generation schizogony and the sex differentiation and development. This study provides the most compre-hensive dataset to date for gene expression in different de-velopment stages ofE.necatrix, which could facilitate our understanding of molecular mechanisms in reproductive mode switch ofEimeria.
Methods
Parasite materials
One-day-old chicks (Suqiu Yellow chickens; the Poultry Institute of China Agricultural Academy, Yangzhou, Jiangsu, China) were reared in a coccidia-free isolation fa-cility and allowed unlimited access to water and food that did not contain any anti-coccidial drugs or antibiotics. To confirm chickens as free of infection prior to experimental inoculation, feces were analyzed by salt-flotation and light microscopy to ensure the absence of oocysts [19]. Chickens at 4 weeks of age were orally infected with 2.0 × 10⁴ sporu-lated oocysts of E. necatrix. The Yangzhou strain of E. necatrix, originally isolated from chickens that died fromE. necatrix infection by the Key Laboratory for Avian Preventive Medicine at Yangzhou University, was used in this study. All animal care and procedures were conducted according to the guidelines for animal use in toxicology. The study protocol was approved by the Animal Care and Use Committee of the College of Veterinary Medicine, Yangzhou University.
Preparation of merozoites
Second-generation merozoites (MZ-2)
At 136 h post-infection (HPI), chickens were sacrificed, and their intestines were removed and cut open to clean out the intestinal contents by rinsing in cold PBS. The mu-cosa was scraped using a glass slide. All the collected scrapings were ground down and incubated for 60 min at 37 °C in digestion liquid (120 mM NaCl, 10 mM CaCl2,
3 mM K2HPO4, 20 mM Tris-HCl, 0.1% BSA, 0.1%
merozoites were then washed with cold PBS three times. The resulting merozoites were purified by density-gradient centrifugation using the method described by Mo et al. [20]. Approximately l010merozoites were recovered from each chicken (Additional file 1: Figure S1a). Purified merozoites were stored at -80 °C for further use.
Third-generation merozoites (MZ-3)
At 144 HPI, chickens were sacrificed, and their ceca were removed and cut open for cleaning of the cecal contents by rinsing in cold PBS. The mucosa in the distal region of the ceca, approximately 3 cm from the ileo-cecal junction, was scraped using a glass slide. All the collected scrapings were processed for merozoite isolation as described above. The resulting merozoites were passed through a DEAE-52 cel-lulose chromatographic column as described by Chapman et al. [21]. Approximately l07 merozoites were recovered from each chicken (Additional file 1: Figure S1b). Purified merozoites were stored at -80 °C for further use.
RNA extraction and purification
Total RNA was extracted using RNAiso Plus Total RNA extraction reagent (Takara Dalian,China), according to the manufacturer’s instructions. The quality of the RNA was measured using a NanoDrop ND-2000, and the integrity was evaluated with an Agilent Bioanalyzer 2100 (Agilent Technologies, Santa Clara, CA, USA). Only samples with RNA Integrity Numbers (RIN) from 7 to 10 were used for further study. Qualified total RNA was further purified with an RNeasy micro kit (Qiagen, Hilden, Germany) and an RNase-Free DNase Set (Qiagen, Hilden, Germany) and then re-assessed on a Bioanalyzer 2100 (Agilent Technolo-gies, Santa Clara, CA, USA).
cDNA library construction and RNA-seq
Illumina sequencing libraries were constructed using a TruSeq™ RNA Sample Pre Kit (Illumina, San Diego, CA, USA). In brief, 1–3μg of purified total RNA was used for isolation of coding RNA and non-coding RNA using a ribo-zero kit for rRNA depletion, and isolated RNA sam-ples were simultaneously eluted and fragmented in Elute, Prime, Fragment Mix at 94 °C for 8 min to obtain 120– 200 bp inserts. First-strand cDNA was synthesized with SuperScript II Reverse Transcriptase (Invitrogen, Carlsbad, CA, USA) in the presence of random hexamer primers. Second-strand cDNA synthesis was carried out at 16 °C for 1 h. After polyadenylation of the 3′end, the DNA frag-ments were ligated with TruSeq adapters, and Agencourt ® Ampure XP beads (Beckman, Brea, USA) were used to isolate the double-strand (ds) cDNA synthesized by the Second Strand Master Mix. The samples were amplified with TruSeq PCR primers. DNA size and purity of the cDNA library were checked using a high-sensitivity DNA
1000 kit on a Bioanalyzer 2100 system (Agilent
Technologies, Santa Clara, CA, USA). The quantification of the cDNA libraries was performed with a Qubit™ dsDNA HS Assay kit on a Qubit® 2.0 Fluorometer (Life Technologies, Carlsbad, CA, USA). Cluster generation was performed on a paired-end flow cell using a cBot Clonal Amplification System with a HiSeq PE Cluster Kit v4 (Illumina, San Diego, CA, USA), and sequenced on the Illumina HiSeq 2500 platform using the SBS 36-cycle Sequencing Kit (v5) at Shanghai Biotechnology Corpor-ation (Shanghai, China) according to manufacturer-recommended cycling parameters. According to the manufacturer’s instructions, paired reads were sequenced using the double-read multiplex program on the Illumina HiSeq 2500 platform at Shanghai Biotechnology Corpor-ation. Each library was run on two lanes in a flow cell in order to maximize the total number of RNA-seq reads.
Sequence data analysis
Raw reads in fastq format were filtered, and the adaptor sequences and low quality reads were removed. Strin-gent filtering criteria were used to minimize the effects of sequencing errors during the assembly. Briefly, bases with a 3 terminal quality score lower than 10 and a read-length shorter than 20 bp were discarded. Genome mapping was performed based on the recently published E. necatrixHoughton strain reference genome sequence (GCA_000499385.1) using Tophat (version 2.0.9) with a spliced-mapping algorithm. After genome mapping, reads with less than two-base mismatches and multi hits
≤2 were retained.
Identification of differentially expressed genes (DEGs)
The mapped fragments were normalized for RNA length according to the fragment per kilobase of exon model per million mapped reads (FPKM) for each gene [22], which facilitated the comparison of transcript levels between sam-ples. Differentially expressed genes (DEGs) between the two samples were selected using the following filter criteria: FDR (False discovery rate) ≤0.05 and the Fold-change ≥ 2 or log2 (FPKM ratio of two samples) ≥1.
Furthermore, the enrichment analysis of DEGs was con-ducted with the GO database (http://www.geneontolo-gy.org/), and the gene number for each GO term was calculated. The main pathways of biochemical and signal transduction significantly associated with DEGs were determinedviaKEGG pathway analysis.
Relative quantitative real-time PCR (qRT-PCR) analysis
Eraser (Perfect Real Time) (Takara, Dalian, China) to digest genomic DNA and synthesize cDNA according to the manufacturer’s instructions. The primers used for qRT-PCR were designed according to the RNA-seq data with Primer Premier 5.0 software (Premier Biosoft International, Palo Alto, CA, USA). Glyceraldehy3-phosphate de-hydrogenase (GAPDH) was used as an endogenous marker to normalize the reactions to the same amplification pro-gression. By employing FastStart Universal SYBR Green Master (Roche, Shanghai, China), qRT-PCR was performed following the manufacturer’s protocols. Each 20 μl qRT-PCR reaction mixture comprised a 2μl dilution of cDNA, 10 μl 2 × SYBR Green Master and 4μl (10 μM) of each primer. PCR amplification was performed with the follow-ing cyclfollow-ing parameters: 95 °C for 5 min, followed by 45 cy-cles of 94 °C for 10 s, 60 °C for 10 s, and 72 °C for 15 s. Melting curve analysis was performed at the end of the PCR amplification over the range of 60–95 °C, increasing the temperature stepwise by 0.5 °C every 10 s. After ampli-fication, the relative fold change of the differentially expressed genes was calculated through the 2-ΔΔCtmethod [23]. All quantitative PCR analyses for each gene used three biological replicates, with three technical replicates
per experiment to guarantee the reproducibility of the amplification. The RNA samples for qRT-PCR were the same as those for Illumina sequencing. Differences were considered statistically significant at P< 0.05. All primers are listed in Additional file 2: Table S1.
Results
Illumina sequencing and assembly of sequence reads
[image:4.595.306.539.100.155.2]Three individuals’ RNA samples that show good RNA integrity of the same group were equally mixed to gener-ate an RNA pool, then tregener-ated with DNase and evalugener-ated for quality by automated gel electrophoresis. Paired-end sequencing was carried out on all RNA samples using the Illumina HiSeq platform. Approximately 68,009,332 and 51,854,332 raw reads were obtained from MZ-2 and
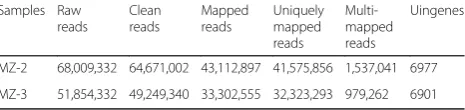
Table 1Summary of results of MZ-2 and MZ-3 transcriptome Samples Raw
reads
Clean reads
Mapped reads
Uniquely mapped reads
Multi-mapped reads
Uingenes
MZ-2 68,009,332 64,671,002 43,112,897 41,575,856 1,537,041 6977
MZ-3 51,854,332 49,249,340 33,302,555 32,323,293 979,262 6901
[image:4.595.58.539.376.703.2]MZ-3 cDNA library, respectively. After removal of low-quality regions, adaptors and all possible contamination, 64,671,002 and 49,249,340 high-quality clean reads were obtained from MZ-2 and MZ-3 samples, respectively. The majority of the clean reads were distributed in the exon region, followed by the intergenic region and the intron region. Clean reads were mapped to the E. necatrixgenome scaffold (https://www.ncbi.nlm.nih.gov/ nuccore/NW_013651811.1). A total of 1,537,041 and 979,262 multi reads obtained for MZ-2 and MZ-3, re-spectively, were mapped to the E. necatrix genome scaffold. The mapping ratio of two different samples was higher than 66%. After subsequent assembly, a total of 6977 and 6901 unigenes were obtained for MZ-2 and MZ-3, respectively (Table 1).
Annotation
BLAST
Gene annotation was based on sequence similarity searches in the National Center for Biotechnology Information data-base (NCBI) using the BLAST algorithm. A total of 7415 unigenes showed similarities to existing GenBank entries. The results included gene ID, alignment GenBank ID, description in NCBI database, gene short name, locus, FPKM and count. Among the 7415 unigenes, 4749 genes coding for hypothetical proteins were identified.
[image:5.595.60.539.86.483.2]Fig. 3GO analysis of differently expressed genes. The results are divided into three main categories: molecular function, biological process and cellular component. The identified functions and the corresponding numbers of DEGs for each GO category are shown
[image:6.595.59.540.87.410.2] [image:6.595.60.539.453.705.2]stages, the expression level of each unigene in MZ-2 was compared with that in MZ-3.
As shown in volcano plots of up/downregulated genes (Fig. 1), genes were identified as significantly upregulated genes with a log2fold-change ≥ 1 or a fold-change≥ 2
(red spot), and significantly downregulated genes were defined by a log2fold-change≤-1 or a fold-change≤-2
(green spot). The comparisons showed that a large population of genes was detected specifically in either MZ-2 or MZ-3. Considering only genes with P- values < 2.2e-16, a total of 2053 genes (27.69%) were found to
be DEGs between the MZ-2 and MZ-3 stages
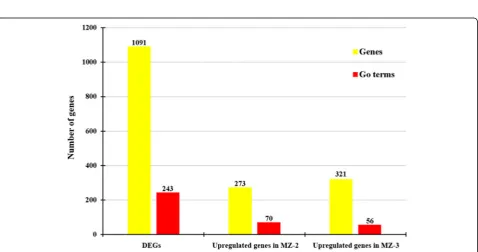
(Additional file 3: Table S2). Excluding genes with DE false discovery rates of > 0.05, 837 significantly upregu-lated genes (11.29%) and 1216 significantly downregu-lated genes (16.40%) were visualized in the Venn diagrams (Fig. 2a). To amplify the difference between the MZ-2 and MZ-3, we defined those DEGs with an FPKM > 1 in MZ-2 or MZ-3 and a FPKM < 1 in MZ-3 or MZ-2 as stage-specific genes. As shown in Fig. 2b, 95
genes (7.81%) were observed to be specifically expressed in MZ-2 (Additional file 4: Table S3), and 48 genes
(5.73%) had stage-specific expression in MZ-3
(Additional file 5: Table S4).
Gene ontology classification
Gene ontology (GO) Slim terms contain specified sub-sets of higher-level ontology categories that provide a broad profile for genome-genome comparison [25]. Sig-nificant GO categories were designated as those with aP - value <0.01. Of 2053 DEGs between MZ-2 and MZ-3, 1203 DEGs were successfully annotated with 57 GO terms, 904 DEGs were categorized into biological pro-cesses, 884 DEGs into molecular functions and 847 DEGs into cellular components (Fig. 3). For the molecu-lar functions, the dominant sub-categories of catalytic activity and binding accounted for 44.64% and 44.70%, respectively. Cellular component sub-categories with the largest numbers of annotated unigenes included cell part (22.11%) and cell (22.11%). Among the biological
[image:7.595.59.540.343.717.2]processes, the dominant sub-categories included meta-bolic processes (32.87%) and cellular processes (25.72%).
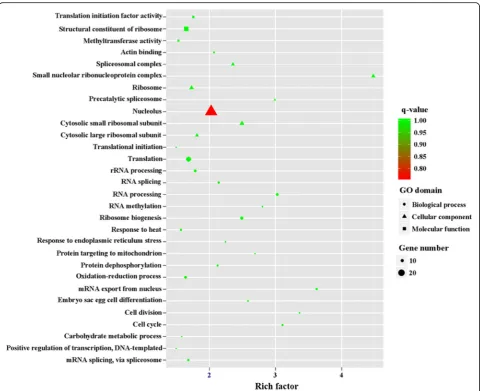
GO is an international standardized gene functional classification system and was applied to search for sig-nificantly enriched GO terms in DEGs. To obtain a com-prehensive view of DEGs, GO term enrichment analysis was carried out to evaluate significantly over-represented GO terms. Of 2053 DEGs between MZ-2 and MZ-3, 1091 DEGs were successfully annotated with 243 GO terms (Fig. 4), of which 509 DEGs were assigned to mo-lecular function, 583 DEGs to biological process, and 522 DEGs to cellular component ontology. A large portion of annotated DEGs involved in metabolic pro-cesses were novel genes related to pathways of secondary metabolite synthesis (Fig. 5).
To obtain a detailed view of stage-specific upregulated genes, GO term enrichment analysis was carried out to evaluate significantly over-represented GO terms. Of
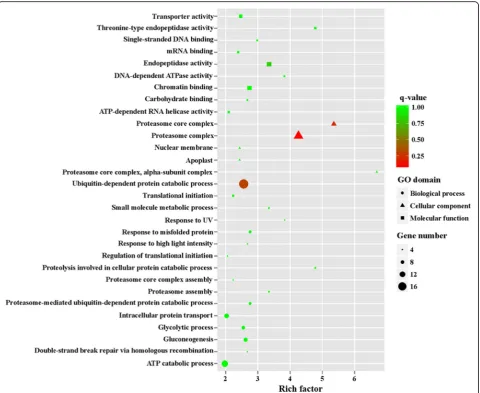
1216 upregulated genes in MZ-2273 upregulated genes in MZ-2 were categorized into 70 GO terms (Fig. 4), and the top 10 GO enrichments involved were in the proteasome core complex, alpha-subunit complex,
proteasome core complex, proteasome complex,
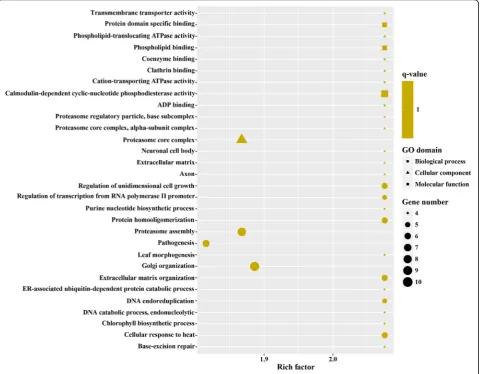
threonine-type endopeptidase activity, proteolysis involved in cellular protein catabolic process, DNA-dependent ATPase activity, response to UV, proteasome assembly, endopeptidase activity and small molecule metabolic processes (Fig. 6). Of 837 DEGs in MZ-3, 321 upregulated genes in MZ-3 were categorized into 56 GO terms (Fig. 4), and the top 10 GO enrichments in-volved were in the small nucleolar ribonucleoprotein complex, mRNA export from nucleus, nucleolus, cell division, cell cycle, RNA processing, precatalytic spli-ceosome, RNA methylation, protein targeting to mito-chondria, embryo sac egg cell differentiation and ribosome biogenesis (Fig. 7).
[image:8.595.59.540.321.714.2]Biochemical pathways
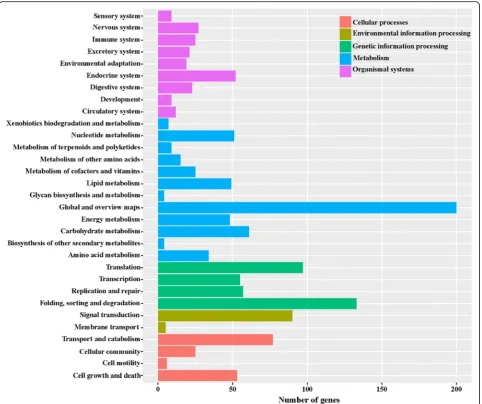
KEGG analysis provides an alternative functional anno-tation based on genes associated with biochemical pathways. DEGs were mapped to the reference pathway in the KEGG database in order to identify the changes in biological pathways operating during the two devel-opmental stages. The KEGG pathways were designated as those with a P - value < 0.05. Of the 2053 DEGs between MZ-2 and MZ-3, 620 unigenes were classified into 198 KEGG pathways (Fig. 8).
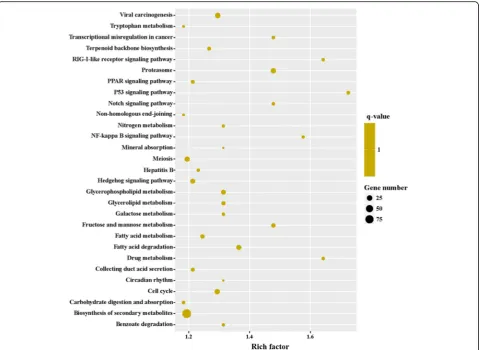
To obtain a detailed view of stage-specific upregu-lated genes, KEGG enrichment analysis was carried out to evaluate significantly over-represented KEGG terms. Of the 2053 DEGs between MZ-2 and MZ-3, 727 genes had a KO ID and were associated with 242 pathways. The KEGG metabolic pathways were well represented with the largest number of annotated DEGs (25.31%), followed by biosynthesis of secondary metabolites (12.65%) and biosynthesis of antibiotics
(8.94%). The “p53 signaling pathway”, “drug metabol-ism”, “RIG-I-like receptor signaling pathway” and “NF-kappa B signaling pathway” were also highly enriched (Fig. 9).
[image:9.595.58.539.86.477.2]transport, hippo signaling pathway, ribosome biogenesis in eukaryotes, notch signaling pathway, RNA degrad-ation, herpes simplex infection, 2-Oxocarbocylic acid metabolism and pertussis (Fig. 11).
Quantitative real-time PCR validation of RNA-seq results
To validate the sequencing data, 9 differentially expressed mRNAs were further examined by qRT-PCR with gene-specific primer sequences. The expression levels were calculated according to the 2-ΔΔCt values. According to the RNA-seq results, the expression levels of ENH_00029420, ENH_00079950, ENH_00018950 were upregulated in MZ-3, the expression levels of ENH_00068470, ENH_00068780, ENH_00014830 were downregulated in MZ-3, and the expression level of ENH_00072650, ENH_00049010, ENH_00032690 were no significant difference. Using GAPDH as a reference
gene, expression levels determined by qRT-PCR were consistent with those obtained by RNA-seq (Fig. 12), confirming the accuracy and reliability of the RNA-seq results. Thus, the data generated here can be used to in-vestigate stage-specific expression of genes that show different expression levels among different developmen-tal stages.
Discussion
The whole genomes for all seven Eimeria species that infect chickens have been sequenced and annotated [26]. Genome-wide gene identification has predicted more
than 8000 protein-coding genes in each of the
hemorrhagicEimeriagenomes andE. mitis. ForE. neca-trix, the size of the genomic DNA is 55.2 Mb and encodes 8627 proteins [27]. In the present study, we investigated the transcript profiles of MZ-2 and MZ-3 of Fig. 8KEGG analysis of differentially expressed genes. The X-axis indicates the number of genes in the pathway. The Y-axis indicates the
[image:10.595.58.541.87.491.2]E.necatrixusing RNA-seq and identified 6977 and 6901 genes in MZ-2 and MZ-3, respectively. The number of genes identified fromE.necatrixwas slightly more than that of E. tenella. By transcriptome sequencing, Reid et al. [27] identified expression of 76% of predicted E. tenella genes (6700) across four developmental life-stages (unsporulated oocyst, sporulated oocyst, sporozo-ite and merozosporozo-ite).
The differential expression analysis of RNA-seq data in MZ-2 and MZ-3 revealed that 1216 genes were upregu-lated in MZ-2 and 837 genes were upreguupregu-lated in MZ-3. Of 2053 DEGs, 95 and 48 genes were specifically expressed in MZ-2 and MZ-3, respectively. These genes included, for example, ApiAP2 DNA-binding proteins, Eimeria-specific surface antigens (SAGs), CMGC kinase, DEAD/DEAH box helicase domain-containing protein and proliferation-associated protein 2G4 (PA2G4) (Additional file 6: Table S5). The analysis of stage-specific expression genes revealed that 73 were hypothetical protein-coding genes of the 95 MZ-2-specific expression genes, and 35 were hypothetical protein-coding genes of the 48 MZ-3-specific expression
genes. Since hypothetical proteins are not annotated in the database and not validated in other reports, we will not discuss them in this article. There are 8 structural protein-coding genes among the 15 MZ-3-specific expression genes that were mainly associated with cell morphology, mechanical support, defense, protection and repair. Compared to MZ-3, of the 22 MZ-2-specific expression genes, 15 were functional protein-coding genes, which were related to the biological functions such as metabolic, single-organism and cellular pro-cesses, and the catalytic activity, binding functions, and meanwhile, biosynthesis of secondary metabolites and metabolic pathways were also involved. These results revealed the functional differences from the specific expression genes between MZ-2 and MZ-3.
[image:11.595.59.539.87.437.2]replication in Plasmodium [31], Cryptosporidium parvum [32], Toxoplasma gondii [33] and Theileria annulata[34]. InEimeria, the number of genes contain-ing ApiAP2 domains was found to vary from 44 to 54, including 21 Eimeria-specific ApiAP2 groups, 22 add-itional groups shared byEimeriaand other coccidia, and five pan-apicomplexan clusters [27]. In our study, we de-tected 14 genes containing ApiAP2 domains, of which 12 were upregulated in MZ-2 and 2 were upregulated in MZ-3. This difference in expression profiles for ApiAP2 domain-encoding genes could be associated with the developmental fates of MZ-2 and MZ-3. Previous work on the merogony of T. annulata in an in vitro system found that the probability of merogony occurring could be increased by inhibition of DNA synthesis, while the inhibition of protein synthesis reduced the potential to reach commitment [35].
The principal surface antigen gene family inE. tenellais sag, which encodes single domain, membrane-bound proteins tethered by glycosylphosphatidylinositol (GPI) an-chors to the surface of invasive sporozoites and merozoites
[image:12.595.60.538.88.445.2]sagsin MZ-2 may be beneficial for parasites to escape from host immune responses. In contrast to MZ-2, MZ-3 liber-ated from the third-generation meronts immediately enters into other cecal epithelial cells near the cecal tonsil, which contains numerous lymphocytes, and become macroga-metes or microgamonts. The increased expression of some sagsin MZ-3 may help parasites to attach to the host cells prior to parasite invasion.
CMGC proteins participate in several signaling pathways critical for development processes and cell homeostasis, and DEAD/DEAH box proteins play crucial roles in almost all aspects of RNA metabolism, including transcription, splicing, translation and decay [37–39]. It has been pro-posed that CMGC kinase has evolved independently within the Apicomplexa to provide specialized functions related to life-cycle transitions [40]. Compared to MZ-3, 4 genes coding for CMGC kinase and 4 genes coding for DEAD/DEAH box helicase domain-containing protein were detected in MZ-2.
Proliferation-associated protein 2G4 (PA2G4), also known as ErbB3-binding protein 1 (EBP1), is implicated in cell growth, differentiation and apoptosis. Recent
reports have shown that EBP1 participates in the regula-tion of intestinal inflammaregula-tion via mediating the Akt signaling pathway, and the downregulation of EBP1 could accelerate intestinal inflammation [41]. In this study, we found that EBP1 was upregulated in MZ-2. The upregulation of EBP1 in MZ-2 suggested that parasites could escape immune responses by attenuating inflammatory damage.
[image:13.595.60.539.87.449.2]MZ-2 were mainly enriched for protein degradation and amino acid metabolism. The molecular functions of upreg-ulated genes in MZ-3 were mainly enriched for transcrip-tional activity, cell proliferation and cell differentiation.
Conclusions
The present study represents the first report on a large-scale analysis of differentially expressed genes between MZ-2 and MZ-3 of E. necatrix using RNA-seq. Our study adds a number of genes to the list of candidate
[image:14.595.57.540.87.555.2]genes involved in the reproductive mode plasticity of Eimeria. Thus, these results provide a comprehensive gene expression profile among asexual reproduction stages of E. necatrix, and will extend our knowledge of the putative regulation of sex differentiation and devel-opment in Eimeria. Further studies on the candidate genes will help to unfold the molecular mechanisms underlying the transition from MZ-2 to MZ-3 of theE. necatrix as well as to develop novel strategies for coccidiosis control.
Additional files
Additional file 1: Figure S1.The purified MZ-2 and MZ-3.aA MZ-2 sample purified fromE.necatrix-infected chickens at 136 h post-infection.
bA MZ-3 sample purified fromE.necatrix-infected chickens at 144 h post-infection.Scale-bars: 10μm. (TIFF 829 kb)
Additional file 2: Table S1.Primers used in qRT-PCR. (XLSX 11 kb) Additional file 3: Table S2.Information on DEGs in the pair-wise comparison of MZ-2 and MZ-3. (XLSX 209 kb)
Additional file 4: Table S3.Information on MZ-2-specific mRNA transcripts. (XLSX 18 kb)
Additional file 5: Table S4.Information on MZ-3-specific mRNA transcripts. (XLSX 15 kb)
Additional file 6: Table S5.Information on differentially expressed mRNA transcripts coding for SAG proteins, CMGC, ApiAP2 and DEAD BOX. (XLSX 36 kb)
Abbreviations
ApiAP2:Apicomplexan AP2; DE: Differential expression; DEG: Differentially expressed gene; FPKM: Fragment per kilobase of exon model per million mapped reads; GO: Gene ontology; GPI: Glycosylphosphatidylinositol anchor; KEGG: Kyoto Encyclopedia of Genes and Genomes; MZ-2: Second-generation merozoites; MZ-3: Third-generation merozoites; PA2G4: Proliferation-associated protein 2G4; qRT-PCR: Relative quantitative real-time PCR; sag: Surface antigen gene; SRS: SAG1 related sequences
Acknowledgements
We are grateful to Engineer Xiaotao Cheng from Shanghai Biotechnology Corporation for his generous help in data processing and bioinformatics analysis.
Funding
This work was supported by the National Natural Science Foundation of China (No. 31472181 to JPT, No.31602039 to DDL), the National Key Research and Development Program of China (2017YFD0500400), Youth science and technology talent project of Yangzhou municipal basic research program (YZ2016114), and a project funded by the Priority Academic Program Development of Jiangsu Higher Education Institutions (PAPD). The funders had no role in study design, data collection and analysis, decision to publish, or preparation of the manuscript.
Availability of data and materials
The datasets supporting the findings of this article are included within the article. The RNA-seq raw data and normalized data have been deposited at the NCBI SRA repository under the accession number PRJNA388030.
Authors’contributions
Conceived and designed the experiments: JPT and SJS. Performed the experiments: SJS, ZFH, DDL, CLJ and LLW. Analyzed the data: SJS, JJX and JPT. Wrote the paper: SJS and JPT. All authors read and approved the final manuscript.
Ethics approval
All animals were handled in strict accordance with good animal practice as defined by the Animal Ethics Procedures and Guidelines of the People’s Republic of China. The study protocol was approved by the Animal Care and Use Committee of the College of Veterinary Medicine, Yangzhou University.
Consent for publication
Not applicable.
Competing interests
The authors declare that they have no competing interests.
Publisher’s Note
Springer Nature remains neutral with regard to jurisdictional claims in published maps and institutional affiliations.
Author details
1College of Veterinary Medicine, Yangzhou University, Yangzhou 225009,
China.2Jiangsu Co-innovation Center for Prevention and Control of Important Animal Infectious Diseases and Zoonoses, Yangzhou University, Yangzhou 225009, China.3Jiangsu Key Laboratory of Zoonosis, Yangzhou University, Yangzhou 225009, China.
Received: 16 March 2017 Accepted: 7 August 2017
References
1. Hao L, Liu X, Zhou X, Li J, Suo X. Transient transfection ofEimeria tenella using yellow or red fluorescent protein as a marker. Mol Biochem Parasitol. 2007;153:213–5.
2. Shirley MW, Smith AL, Blake DP. Challenges in the successful control of the avian coccidia. Vaccine. 2007;25:5540–7.
3. Shirley MW, Blake D, White SE, Sheriff R, Smith AL. Integrating genetics and genomics to identify new leads for the control ofEimeriaspp. Parasitology. 2004;128:S33–42.
4. Klimes B, Rootes DG, Tanielian Z. Sexual differentiation of merozoites of Eimeria tenella. Parasitology. 1972;65:131–6.
5. Cornelissen AW, Overdulve JP, Van der Ploeg M. Cytochemical studies on nuclear DNA of four eucoccidian parasites,Isospora(Toxoplasma)gondii,
Eimeria tenella,Sarcocystis cruziandPlasmodium berghei. Parasitology.
1984;88:13–25.
6. Cornelissen AW, Overdulve JP, Van der Ploeg M. Determination of nuclear DNA of five eucoccidian parasites,Isospora(Toxoplasma)gondii,Sarcocystis
cruzi,Eimeria tenella,E. acervulinaandPlasmodium bergheiwith special
reference to gamontogenesis and meiosis inI.(T.)gondii. Parasitology. 1984;88:531–53.
7. Novaes J, Rangel LT, Ferro M, Abe RY, Manha AP, de Mello JC, et al. A comparative transcriptome analysis reveals expression profiles conserved across threeEimeriaspp. of domestic fowl and associated with multiple developmental stages. Int J Parasitol. 2012;42:39–48.
8. Matsubayashi M, Hatta T, Miyoshi T, Anisuzzaman SK, Shimura K, et al. High-throughput RNA sequencing profiles and transcriptional evidence of aerobic respiratory enzymes in sporulating oocysts and sporozoites of
Eimeria tenella. Infect Genet Evol. 2013;18:269–76.
9. Amiruddin N, Lee XW, Blake DP, Suzuki Y, Tay YL, Lim LS, et al. Characterisation of full-length cDNA sequences provides insights into the
Eimeria tenellatranscriptome. BMC Genomics. 2012;13(2):21.
10. Radke JR, Behnke MS, Mackey AJ, Radke JB, Roos DS, White MW. The transcriptome ofToxoplasma gondii. BMC Biol. 2005;3:26.
11. Behnke MS, Wootton JC, Lehmann MM, Radke JB, Lucas O, Nawas J, et al. Coordinated progression through two subtranscriptomes underlies the tachyzoite cycle ofToxoplasma gondii. PLoS One. 2010;5(8):e12354. 12. Fritz HM, Buchholz KR, Chen X, Durbin-Johnson B, Rocke DM, Conrad PA,
et al. Transcriptomic analysis ofToxoplasmadevelopment reveals many novel functions and structures specific to sporozoites and oocysts. PLoS One. 2012;7(2):e29998.
13. Behnke MS, Zhang TP, Dubey JP, Sibley LD.Toxoplasma gondiimerozoite gene expression analysis with comparison to the life cycle discloses a unique expression state during enteric development. BMC Genomics. 2014;15:350. 14. Le Roch KG, Zhou Y, Blair PL, Grainger M, Moch JK, Haynes JD, et al.
Discovery of gene function by expression profiling of the malaria parasite life cycle. Science. 2003;301:1503–8.
15. Silvestrini F, Bozdech Z, Lanfrancotti A, Giulio ED, Bultrini E, Picci L, et al. Genome-wide identification of genes upregulated at the onset of gametocyte genesis inPlasmodium falciparum. Mol Biochem Parasitol. 2005;143:100–10.
16. McDougald LR, Fuller AL, McMurray BL. An outbreak ofEimeria necatrix coccidiosis in breeder pullets: analysis of immediate and possible long-term effects on performance. Avian Dis. 1990;34:485–7.
17. Mattiello R, Boviez JD, McDougald LR.Eimeria brunettiandEimeria necatrix in chickens of Argentina and confirmation of seven species ofEimeria. Avian Dis. 2000;44:711–4.
18. Swayne DE, Glisson JR, McDougald LR, Nolan LK, Suarez DL, Nair VL. Diseases of poultry. 13th ed. Wiley-Blackwell: Ames; 2013.
20. Mo PH, Ma QT, Ji XX, Song P, Tao JP, Li JG. Effects of artemisinin treatment to microneme gene transcription in second-generation merozoites and pathological change s of caecum in chickens infected byEimeria tenella. Acta Vet Zootech Sinica. 2014;45:833–8.
21. Chapman HD, Shirley MW. The Houghton strain ofEimeria tenella: a review of the type strain selected for genome sequencing. Avian Pathol. 2003;32: 115–27.
22. Trapnell C, Williams BA, Pertea G, Mortazavi A, Kwan G, van Baren MJ, et al. Transcript assembly and quantification by RNA-Seq reveals unannotated transcripts and isoform switching during cell differentiation. Nat Biotechnol. 2010;28:511–5.
23. Livak KJ, Schmittgen TD. Analysis of relative gene expression data using real-time quantitative PCR and the 2(-Delta Delta C(T)) method. Methods. 2001;25:402–8.
24. Anders S, McCarthy DJ, Chen Y, Okoniewski M, Smyth GK, Huber W, et al. Count-based differential expression analysis of RNA sequencing data using R and bioconductor. Nat Protoc. 2013;8:1765–86.
25. Lomax J. Get ready to GO! A biologist's guide to the gene ontology. Brief Bioinform. 2005;6:298–304.
26. Blake DP.Eimeriagenomics: where are we now and where are we going? Vet Parasitol. 2015;212:68–74.
27. Reid AJ, Blake DP, Ansari HR, Billington K, Browne HP, Bryant J, et al. Genomic analysis of the causative agents of coccidiosis in domestic chickens. Genome Res. 2014;24:1676–85.
28. Balaji S, Babu MM, Lyer LM, Aravind L. Discovery of the principal specific transcription factors of Apicomplexa and their implication for the evolution of the AP2-integrase DNA binding domains. Nucleic Acids Res. 2005;33: 3994–4006.
29. Campbell TL, De Silva EK, Olszewski KL, Elemento O, Llinas M. Identification and genome-wide prediction of DNA binding specificities for the ApiAP2 family of regulators from the malaria parasite. PLoS Pathog. 2009;6: e1001165.
30. Jofuku KD, Den Boer B, Van Montagu M, Okamuro JK. Control ofArabidopsis flower and seed development by the homeotic gene APETALA2. Plant Cell. 1994;6:1211–25.
31. Sinha A, Hughes KR, Modrzynska KK, Otto TD, Pfander C, Dickens NJ, et al. A cascade of DNA binding proteins for sexual commitment and development
inPlasmodium. Nature. 2014;507:253–7.
32. Oberstaller J, Pumpalova Y, Schieler A, Llinás M, Kissinger JC. The
Cryptosporidium parvumApiAP2 gene family: insights into the evolution of
apicomplexan AP2 regulatory systems. Nucleic Acids Res. 2014;42:8271. 33. White MW, Radke JR, Radke JB.Toxoplasmadevelopment - turn the switch
on or off? Cell Microbiol. 2014;16:466–72.
34. Pieszko M, Weir W, Goodhead I, Kinnaird J, Shiels B. ApiAP2 factors as candidate regulators of stochastic commitment to merozoite production in Theileria annulata. PLoS Negl Trop Dis. 2015;9(8):e0003933.
35. Shiels B, Aslam N, McKellar S, Smyth A, Kinnaird J. Modulation of protein synthesis relative to DNA synthesis alters the timing of differentiation in the protozoan parasiteTheileria annulata. J Cell Sci. 1997;110:1441–51. 36. Tabares E, Ferguson D, Clark J, Soon PE, Wan KL, Tomley F.Eimeria tenella
sporozoites and merozoites differentially express
glycosylphosphatidylinositol-anchored variant surface proteins. Mol Biochem Parasitol. 2004;135:123–32.
37. Cordin O, Banroques J, Tanner NK, Linder P. The DEAD-box protein family of RNA helicases. Gene. 2006;367:17–37.
38. Linder P, Jankowsky E. From unwinding to clamping-the DEAD box RNA helicase family. Nat Rev Mol Cell Biol. 2011;12:505–16.
39. Rocak S, Linder P. DEAD-box proteins: the driving forces behind RNA metabolism. Nat Rev Mol Cell Biol. 2004;5:232–41.
40. Talevich E, Mirza A, Kannan N. Structural and evolutionary divergence of eukaryotic protein kinases in Apicomplexa. BMC Evol Biol. 2011;11:321. 41. Miao X, Tang Q, Miao X, Wu Y, Qian J, Zhao W, et al. ErbB3 binding protein
1 (EBP1) participates in the regulation of intestinal inflammationvia mediating Akt signaling pathway. Mol Immunol. 2015;67:540–51.
• We accept pre-submission inquiries
• Our selector tool helps you to find the most relevant journal
• We provide round the clock customer support
• Convenient online submission
• Thorough peer review
• Inclusion in PubMed and all major indexing services
• Maximum visibility for your research
Submit your manuscript at www.biomedcentral.com/submit