Open Access
R E S E A R C H
Bio
Med
Central
© 2010 Nkurunziza et al; licensee BioMed Central Ltd. This is an Open Access article distributed under the terms of the Creative Com-mons Attribution License (http://creativecommons.org/licenses/by/2.0), which permits unrestricted use, distribution, and reproduc-tion in any medium, provided the original work is properly cited.Research
Bayesian modelling of the effect of climate on
malaria in Burundi
Hermenegilde Nkurunziza*
1, Albrecht Gebhardt
2and Jürgen Pilz
2Abstract
Background: In Burundi, malaria is a major public health issue in terms of both morbidity and mortality with around 2.5 million clinical cases and more than 15,000 deaths each year. It is the single main cause of mortality in pregnant women and children below five years of age. Due to the severe health and economic cost of malaria, there is still a growing need for methods that will help to understand the influencing factors. Several studies have been done on the subject yielding different results as which factors are most responsible for the increase in malaria. The purpose of this study has been to undertake a spatial/longitudinal statistical analysis to identify important climatic variables that influence malaria incidences in Burundi.
Methods: This paper investigates the effects of climate on malaria in Burundi. For the period 1996-2007, real monthly data on both malaria epidemiology and climate in the area of Burundi are described and analysed. From this analysis, a mathematical model is derived and proposed to assess which variables significantly influence malaria incidences in Burundi. The proposed modelling is based on both generalized linear models (GLM) and generalized additive mixed models (GAMM). The modelling is fully Bayesian and inference is carried out by Markov Chain Monte Carlo (MCMC) techniques.
Results: The results obtained from the proposed models are discussed and it is found that malaria incidence in a given month in Burundi is strongly positively associated with the minimum temperature of the previous month. In contrast, it is found that rainfall and maximum temperature in a given month have a possible negative effect on malaria incidence of the same month.
Conclusions: This study has exploited available real monthly data on malaria and climate over 12 years in Burundi to derive and propose a regression modelling to assess climatic factors that are associated with monthly malaria incidence. The results obtained from the proposed models suggest a strong positive association between malaria incidence in a given month and the minimum temperature (night temperature) of the previous month. An open question is, therefore, how to cope with high temperatures at night.
Background
In Burundi, malaria is a major public health issue in terms of both morbidity and mortality with around 2.5 million clinical cases and more than 15,000 deaths each year. During the last decade, for example, malaria cases increased from 550,000 cases in 1991 to 2.8 million in 2001 in a total population estimated at 7 million [1]. In 2001, Burundi was the country most affected by malaria in the world [2]. Malaria is the single main cause of mor-tality in pregnant women and children below five years of
age. Malaria continues to ravage millions of rural Burun-dians, despite concerted efforts to reduce malaria mortal-ity [3,4]. This is often attributed to a number of factors, including poverty, limited access to basic health care and specialized health facilities, the cost-sharing system, and the under-funding of the health sector by the govern-ment. Currently, the government allocates only 2% - 4% of its national budget towards supporting the health sec-tor. The direct economic costs of malaria that result from treatment and from time away from work or school are enormous, but the overall economic impact of malaria is likely to be much more substantial than suggested by esti-mates of direct costs alone [5].
* Correspondence: [email protected]
1 Department of Mathematics, Institute of Applied Pedagogy, University of Burundi, Burundi
Due to the severe health and economic cost of malaria epidemics, there is still a growing need for methods that will help to understand the influencing factors, allow forecasting, early warning, so that more effective control measures may be implemented [6]. Several studies have been done on the subject yielding different results as which factors are most responsible for the increase in malaria. Epidemiology studies on malaria in Africa have identified, in general, an association between climate variables and malaria [7,8]. An association between cli-mate variability and the epidemics of malaria has been identified in seven sites of East African highlands in Ethi-opia, Kenya and Uganda [9], suggesting that climate vari-ability had an important influence in initiating epidemics in the highlands of East Africa. There was a significant and positive influence of interactions between maximum temperature, minimum temperature and rainfall on malaria transmission. The work of Pemola and Jauhari [10] investigated the relationship between climate and malaria incidence using Pearson's correlation analysis. The authors found a high positive correlation between monthly parasite incidence and climatic variables (tem-perature, rainfall and humidity). Gallup and Sachs [11] have suggested that the location and severity of malaria are mostly determined by climate and ecology. A signifi-cant correlation between malaria risk and elevation, annual maximum temperature and rainfall was also described [12]. Another study found that variation in the malaria transmission intensity was strongly associated with basic climatic factors, noting that even small differ-ences in climate variation can significantly affect malaria transmission intensities [13]. Rainfall, temperature and altitude were the most plausible predictors of malaria prevalence in Botswana [14].
Others have suggested that malaria was influenced by
factors other than climate. Hay et al [15] suggested that
the association between local malaria resurgence and regional changes in climate was overly simplistic. Eco-nomic, social and political factors may explain recent resurgence in malaria and other mosquito-borne dis-eases, with no need to invoke climatic changes. Many variables may affect malaria transmission beside climatic changes, such as environmental modification, population growth, limited access to health care, and lack of or unsuccessful malaria control measures [16]. Although cli-mate can affect the incidence of malaria, human eco-nomic activities and malaria control strategies play an important role in the incidence of the disease [17]. Rela-tively high rates of malaria morbidity could result from poor access to health services, inadequate case manage-ment, overwhelmed health services, poor immunological competence because of malnutrition, a general disruption to livelihoods because of often-associated flooding, or a combination of these factors [18].
The above-mentioned studies have led to various con-troversial conclusions when investigating which factors influence malaria incidence, depending on the country specificity. This makes it difficult to establish common determinants of malaria in all countries [19]. In Burundi, the situation of malaria is poorly documented. Indeed, very few studies have been published on the malaria prev-alence in Burundi. Further, published papers concern only three provinces (Ngozi, Kayanza, Karuzi) [20,21], where "Médecins-sans-Frontières" from Belgium was active. It is believed that the situation of crisis experi-enced by Burundi since 1993, followed by a break in cooperation with some countries led researchers and international agencies to lose interest on Burundi. So far, no research on malaria has been carried out throughout the entire country in order to establish a generalized framework to investigate this subject.
In this paper, both generalized linear and generalized additive mixed models are proposed to assess the climatic factors that are the highly associated with monthly malaria incidence in Burundi. It is assumed that malaria incidence in a given month in Burundi can be predicted by rainfall, temperature and humidity. Rainfall has a great influence on the mosquito population by increasing the vegetation density and by providing suitable breeding pools for the production and maturation of larvae. Tem-perature has a great influence on the transmission of malaria, higher temperatures shortening the extrinsic incubation period [6] and humidity facilitates adult mos-quito life span [9,22,23].
Methods
Study area
Burundi is located in East-central Africa, between 2°20 and 4°27 of latitude south and between 28°50 and 30°53 of longitude east; the altitude varies between 775 metres (Lake Tanganyika) and 2,670 metres (Crest Congo - Nil). Burundi has generally a tropical highland climate, with a considerable daily temperature variation in many areas [24]. Temperature also varies considerably from one region to another, mainly as a result of differences in alti-tude. The central plateau is cool, with temperature aver-aging 20°C. The area near Lake Tanganyika is warmer, averaging 23°C; the highest mountain areas are cooler, averaging 16°C. Rain is irregular, falling most heavily in the north-west [24]. Dry season varies in length, and there are sometimes longer periods of drought. Most parts of Burundi receive between 130 and 160 cm of rain-fall a year [24]. Bounded on the north by Rwanda, in south-east by Tanzania and in west by the Democratic
Republic of Congo, Burundi covers an area of 27,834 km2
(of which 2,634 km2 are occupied by Tanganyika Lake)
of the population living in rural areas. The urban popula-tion is 8.4% with an annual growth rate of 5.7%. The Burundi population is young: 46.1% are under 15 years of age, while people aged 60 and above represent only 5.4%.
With an average density of 266 inhabitants per km2, a
population growth rate of 3.44% and a total fertility rate of six children per woman, Burundi is one of Africa's most densely populated country [3]. Burundi is struc-tured in 17 provinces. The epidemiological profile can be summarized as follows. The health system suffers from a shortage of qualified personnel with one doctor per 34,750 inhabitants and one nurse for 3,500 inhabitants. 17.4% of patients do not have access to health care, while 81.5% of patients are forced to go into debt or sell prop-erty to pay the health costs. There is a big disparity between the capital Bujumbura and the remainder of the country, as 80% of doctors and more than 50% of nurses are working in Bujumbura. Malaria, which is responsible for more than 50% of hospital deaths in children under five years of age and 40% of all consultations in health centres, is undoubtedly the main public health problem, the main cause of mortality and morbidity in Burundi [3].
Data description
Malaria data
The goal/aim of this study is to assess which climatic fac-tors affect malaria incidence in Burundi. Data on malaria morbidity in Burundi were collected from EPISTAT (Epi-demiology and Statistics) [25], a department of the Burundi Ministry of health, in charge of collecting and storing data on epidemiology all over the country. The health services collect all monthly notification of malaria consultations. Malaria morbidity data/number from 1996 to 2007 were collected. This is the period where data are available in EPISTAT. The well-known nearest neighbour method is used to fill the (~5%) missing data. The esti-mated population for each province, for the study period, was obtained from the Institute of Statistics and Eco-nomic Studies of Burundi (ISTEEBU) [26]. In this study, the number of malaria cases for each province was divided by the total number of population of the province to obtain the incidence rate. Used are the incidence rates per 1,000 inhabitants.
Meteorological data
Monthly cumulative precipitation, monthly average of maximum temperature, monthly average of minimum temperature, monthly average of maximum humidity and monthly average of minimum humidity, for the period 1996-2007 were obtained from the Geographic Institute of Burundi (IGEBU) [27]. The record of these variables from 1996 to 2007 has remained uniform, with the same calibration and the same precision. Only 14 stations had enough data for the desired study period. The missing data (2% - 3%) were filled by the same method as in
Malaria data (nearest neighbour and cross-validation). Data for three provinces (Bubanza, Bujumbura rural and Cibitoke) were not available for the study period. They are estimated using ordinary kriging [28].
Modelling the impact of climatic variables on malaria
Generalized linear and generalized additive mixed models
Let Y be a response variable, X = (X1, ..., Xn) be a vector of
covariates and θ and ϕunknown parameters. Bayesian
generalized linear models assume that the distribution of
Y belongs to an exponential family, i.e.
Here b(.), c(.), θ and ϕdetermine the specific response
distribution [29-31]. The mean μ = E(Y/X, γ) is linked to a
linear predictor η by
where h is a known link function and γ is a vector of
unknown regression parameters.
In most practical regression applications however, the assumption of a strictly linear effect (of the covariates) on the predictor may not be appropriate for continuous covariates.
Generalized additive mixed models for longitudinal data generalize (2), by replacing the strictly linear predic-tor by a structured additive predicpredic-tor [32]:
where ηit is the predictor, xit1, ..., xitk, uit are the
(contin-uous) covariates values observed for location i at time t, fj
are smooth function and εit is the error. For Bayesian
inference, the unknown functions f1, ...., fp in the predictor
(3) and the fixed effects parameter γ are onsidered as
ran-dom variables and are supplemented by appropriate prior assumptions [33]. Defining the vector of the function evaluations fj = (fj(xit1), ..., fj(xitp))' as the matrix product of
a design matrix Xj and a vector of unknown parameters
βj, i.e. fj = Xjβj, one obtains the predictor (3) in matrix notation as
where U corresponds to the design matrix for fixed
effects. A prior for a function fj is defined by specifying a
suitable design matrix Xj and a prior distribution for the
vector βj of unknown parameters. The general form of the
prior for the βj in (4) is given by
p Y( /X)=exp⎛y −b( ) c y( , ) ⎝
⎜ ⎞
⎠ ⎟
q q
f f (1)
m=h( ),h h= ′Xg (2)
hit = f x1( it1)+…+ f xp( itp)+ ′ +uitg eit (3)
where Kj is a penalty matrix that shrinks parameters towards zero or penalizes too abrupt jumps between neighbouring parameters [32,34]. The variance
parame-ter in (5) controls the trade-off between flexibility and
smoothness. Weakly informative inverse Gamma
hyper-priors ~IG(aj, bj) are often assigned to . Bayesian
inference is based on the posterior of the model given by:
Here L(.) denotes the likelihood which, under the
assumption of conditional independence, is the product of individual likelihood contributions. Markov Chain Monte Carlo (MCMC) simulation methods that allow to draw random samples from the posterior are used to compute the posterior distribution [35,36].
Model formulation
The aim is to model the dependence of malaria incidence on covariates including rainfall, minimum and maximum temperature, minimum and maximum humidity in Burundi. In the model, the variation of temperature, rain-fall and humidity within one province is assumed not sig-nificant. This assumption is dictated by the fact that provinces in Burundi are small (17 provinces on an area
of 27,834 km2). Taking into account the life cycle of the
parasite (13 days for Plasmodium falciparum) [13] and
the incubation period (seven days to four weeks), it is assumed that malaria incidence in a given month is asso-ciated with climatic conditions of the same month and those of the previous month. Most of those who become ill in a given month were bitten by mosquitoes in the pre-vious month. The data are available in different scale and units (malaria and humidity data are unit-free, rainfall is measured in centimetres (cm) and temperature in degrees centigrade (°c)). To avoid the effect of scale in our modelling, the data are first standardized. Throughout this study we adopt the following notation for the
vari-ables:Rn is the rainfall, Tx is the maximum temperature,
Tn is the minimum temperature, Hx is the maximum
humidity, Hn is the minimum humidity and Rnp, Txp, Tnp,
Hxp, Hnp are the same variables for the previous month.
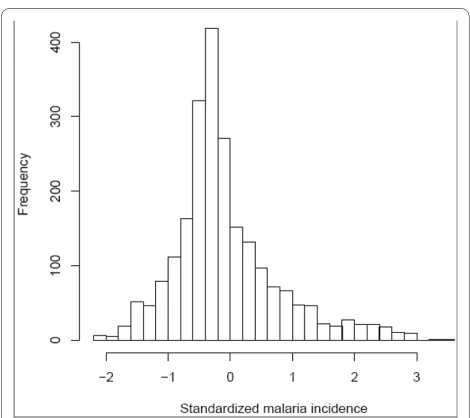
Figure 1 represents the histogram of the standardized malaria incidences. The histogram is right-skewed,
sug-gesting that a gamma distribution for the response vari-able is appropriate. Since some values of the standardized data are negative, a second transformation is made to the
data by adding a constant (c = 2.2) to the response
vari-able to obtain positive values. The following analysis is then conducted on these new data. In the model, the
response variable Y(malaria incidence) is assumed to
have a gamma distribution (with log-link function), i.e.
where μ > 0 is the mean and s > 0 is the shape
parame-ter. The parameters μ and s are related to θ and ϕin
equa-tion (1) by and (see [32] for more
details).
Generalized linear model
The following generalized linear model is first fitted using all the available covariates.
Here
ηit is the predictor of malaria incidence assumed to have
a gamma distribution,
Yit is the malaria incidence in province i (i = 1,...,17) and month t(t = 1,...,144),
β is a vector of unknown regression parameters βk,
p
j K
j j j j j
(b /t ) exp
t b b 2 1 2 2 ∝ − ′ ⎛ ⎝ ⎜ ⎜ ⎜ ⎞ ⎠ ⎟ ⎟ ⎟ (5)
t2j
tj2 tj2
p y L y p p p p p j j j ( , , , , , , / ) ( , , , , ) ( / )
b b t t g
b b g
b t 1 1 2 2 1 2 … … ∝ ×
(
Λ ==∏
⎧ ⎨ ⎪⎪ ⎩ ⎪ ⎪ 1 pp Y X s
s s
y s y
s s
( / , , )
( ) exp
m m m = ⎛ ⎝ ⎜ ⎞ ⎠ ⎟ ⎛− ⎝ ⎜ ⎞ ⎠ ⎟ − 1 1 Γ (7)
m = ′b( )q = −q1 s=f1
h b
h b b b e
it it it
it k kit
k
k kip k
it
E Y X
[image:4.595.304.539.92.301.2]X X = = + + + = =
∑
∑
( / , ) 0 1 5 6 10 (8)Xkit and Xkip are the five climatic covariates (rainfall, maximum temperature, minimum temperature,
maxi-mum humidity and minimaxi-mum humidity) for months t and
the previous month p respectively. Finally, β0 is the
inter-cept (accounting for the effects of unmeasured
covari-ates) and εit is the error. Variables selection is then
performed based on the Akaike information criterion (AIC) in a stepwise algorithm; a final model was then retained. The lowest AIC corresponded to the following model:
The regression coefficients βk (k = 0,...,5) are estimated
via Markov Chain Monte Carlo (MCMC) simulation that allows to draw random samples from the posterior given by (6).
12,000 iterations of the MCMC are ran with a burn-in phase of 2,000 iterations. A thinning to the Markov Chain is applied to reduce autocorrelations, by requiring the
programme to store only every 10th sampled parameter.
This leads to a random sample of length 1,000 for every parameter in the model [35].
The estimated values of the parameters βi are presented
in Table 1.
Generalized additive mixed model
Assuming a nonlinear effect of the climatic covariates on malaria incidence, a generalized additive model (GAM) is first fitted tothe longitudinal data. The additive approxi-mation has the following advantages: first, the curse of dimensionality is avoided because each of the individual additive terms is estimated using a univariate smoother [37]. Second, the estimates of the individual terms explain how the dependent variable changes with the corre-sponding independent variables [37]. At the beginning, all the explanatory covariates are used as follows;
Here, as above, ηit is the predictor of malaria incidence
in month t and province i, assumed to have a gamma
dis-tribution, Xkit and Xkip are the five covariates in province i
for month t and the previous month p, respectively, fi are
unknown smooth functions of the covariates, β0 is the
intercept and εit is the error. The effects of two-factors
interaction are assumed to be smaller and are conse-quently omitted. The main reason is the wish to preserve the simplicity and easy interpretation of the effects, which are often lost by including interactions [29,38].
A final model was then selected based on the Akaike information criterion (AIC) using the algorithm described in [39]. The algorithm is able to decide whether a particular covariate is included in the model or not and whether it enters the model linearly or nonlinearly. More-over the algorithm selects an appropriate degree of smoothness of the nonlinear covariate. Model choice and estimation of the parameters is done simultaneously (see [39] for more details). The lowest AIC corresponded to the following generalized additive mixed model (GAMM) [32]:
The regression coefficients αk (k = 0,...,3) and the
non-linear effect of the continuous covariates are estimated via Markov Chain Monte Carlo (MCMC) as above. The effects of the continuous covariates are modelled by cubic p-splines [40] with 20 equidistant knots and second order
random walk penalty [38,41]. Positive hyperparameters a
= 0.001 and b = 0.0005 for τ 2 are chosen to ensure the
propriety of the posterior [35,40,42]. The sensitivity of
hit =b0+b1Rnit +b2Txit +b3Txpit+b4Tnpit+eit
(9)
hit b k kit e
k
k kip it
k
f X f X
= + + +
= =
∑
∑
0 1 5
6 10
( ) ( ) (10)
h a
a a
it
n it x it xp it
xpit xit nit
f R f H f T
f H T T
= + + +
+ + +
0 1 2 3
4 1 2
( ) ( ) ( )
( ) ++ +
⎧ ⎨ ⎪
⎩⎪ a3Tnpit eit
[image:5.595.56.540.591.748.2](11)
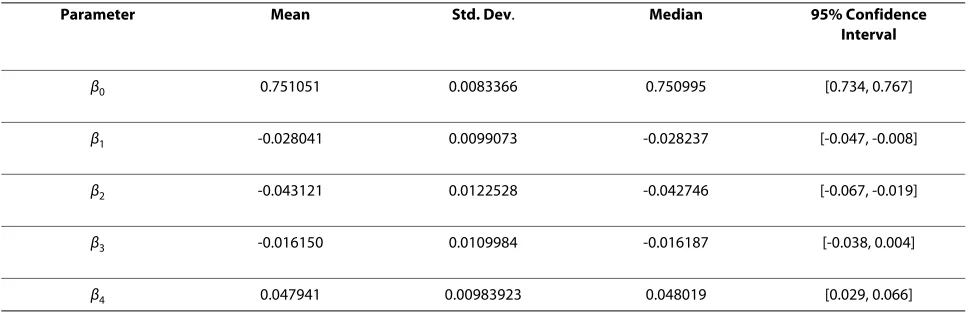
Table 1: Estimates of the coefficients of the linear effects in the generalized linear model.
Parameter Mean Std. Dev. Median 95% Confidence
Interval
β0 0.751051 0.0083366 0.750995 [0.734, 0.767]
β1 -0.028041 0.0099073 -0.028237 [-0.047, -0.008]
β2 -0.043121 0.0122528 -0.042746 [-0.067, -0.019]
β3 -0.016150 0.0109984 -0.016187 [-0.038, 0.004]
the results with respect to changes in the
hyperparame-ters a and b is then checked by re-estimating the model
with different choices for the hyperparameters a and b for
each effect in the model by setting
(a = 1, b = 0.005); (a = 0.001, b = 0.001); (a = 0.01, b = 0.005); (a = 0.001, b = 0.005) (a = 0.0001, b = 0.0001); (a =
0.0001, b = 0.0005) to assess the dependence of results on
minor changes in the model assumptions. The results showed no significant change.
The models are implemented in BayesX, a public domain software for Bayesian inference in structured Additive Regression Models available at http:// www.stat.uni-muenchen.de/~bayesx/bayesx.html.
Results and discussion
The purpose of this study has been to undertake a spatial/ longitudinal statistical analysis to identify important cli-matic variables that influence malaria incidences in Burundi. Table 1 presents the estimates of the coefficients
βi from model (9).
In Table 1, β1, β2 and β3 have negative means. Moreover
β1 and β2 have a negative 95% credible interval (CI),
sug-gesting that rainfall and maximum temperature in a given month have a negative effect on malaria incidence of the
same month. β4 has a positive mean with a positive 95%
CI. This suggests malaria incidence in a given month is positively and significantly associated with minimum temperature of the previous month.
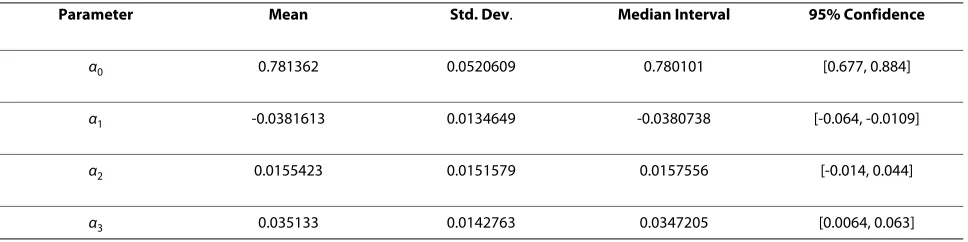
The coefficients αi of the linear part of model (11) are
given in Table 2: α1 has negative mean with a negative
95% CI. This suggests that maximum temperature in a given month has a negative effect on malaria incidence of
the same month. α2 and α3 have positive means, moreover
α3 has a positive 95% CI. This suggests that malaria
inci-dence in a given month is positively associated with the minimum temperature of the same month and (more sig-nificantly) that of the previous month. The results of the GAMM are in good agreement with those of the GLM. In
both tables the intercepts (β0 and α0) have positive mean
with a positive 95% CI. Moreover, they have the largest
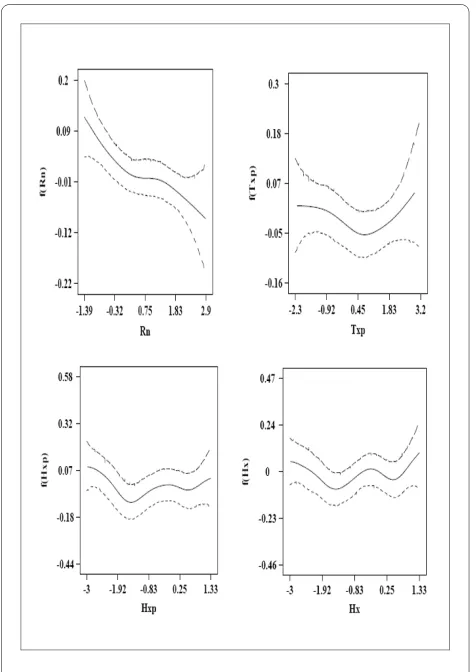
absolute value. This suggests that variables other than cli-mate may have a greater influence on malaria incidence. The extents of nonlinear effects are represented in Figure 2. The upper left plot of Figure 2 suggests that rainfall in a given month has a negative effect on malaria incidence of the same month. Other plots show no clear trend.
Overall, both models (GLM and GAMM) suggest that malaria incidence in a given month in Burundi is signifi-cantly positively associated with the minimum tempera-ture of the previous month. Conversely, rainfall and maximum temperature in a given month are found to have a negative effect on malaria incidence of the same month. Possible explanations of these results are the fol-lowing. Due to the development cycle of the parasite into mosquitoes and the incubation period, those who became ill in a given month were bitten by mosquitoes in the previous month. Minimum temperature is observed at night and mosquitoes are active only at night; by day-time they hide themselves in houses or vegetation. This explains why this factor, which is observed at the same time (at night) when there is mosquito activity, has a great influence on malaria transmission. Moreover, when the night temperature is high, people do not cover them-selves, increasing the risk of being bitten by mosquitoes. Maximum temperature has a negative effect because mosquito's development is interrupted at higher temper-ature [41]. Too much rainfall may flush away breeding larvae, reducing the numbers of the disease vectors.
Conclusions
[image:6.595.57.541.627.748.2]This study has exploited available real monthly data on malaria, rainfall, temperature and humidity over 12 years (1996-2007) in the area of Burundi to derive and propose a regression modelling to assess climatic factors that are associated with monthly malaria incidence. The regres-sion is based on the generalized linear model (GLM) and generalized additive mixed model (GAMM). The results obtained suggest a strong positive association between malaria incidence in a given month and the minimum temperature (night temperature) of the previous month. An open question is therefore how to cope with high tem-peratures at night. One possible suggestion in the context
Table 2: Estimated coefficients of the linear effects in the generalized additive mixed model.
Parameter Mean Std. Dev. Median Interval 95% Confidence
α0 0.781362 0.0520609 0.780101 [0.677, 0.884]
α1 -0.0381613 0.0134649 -0.0380738 [-0.064, -0.0109]
α2 0.0155423 0.0151579 0.0157556 [-0.014, 0.044]
of Burundi would be to popularize the use of bed nets in order to reduce contact with mosquitoes. In contrast, it is found that rainfall and maximum temperature in a given month have a negative effect on malaria incidence of the same month. It is believed that climatic variables alone cannot explain the spatio-temporal distribution of malaria cases in Burundi. An interesting problem under investigation is extending the results in this work by incorporating in the proposed model the spatial effect by accounting for both structured (correlated) and unstruc-tured (uncorrelated) components.
Competing interests
The authors declare that they have no competing interests.
Authors' contributions
HN collected the data, performed the statistical analysis and drafted the manu-script. AG and JP reviewed and improved the manumanu-script. All authors read and approved the final manuscript.
Acknowledgements
This study was carried out in the frame of the doctorate studies of the first author (HN). He is extremely grateful to the Austrian agency for international cooperation in education and research (ÖAD) for offering him the opportunity to study in Austria through providing him with the necessary financial support. HN would also like to acknowledge the valuable cooperation and support
from the workers in Epistat and IGEBU in Burundi by providing him with the data used in this study.
Author Details
1Department of Mathematics, Institute of Applied Pedagogy, University of Burundi, Burundi and 2Department of Statistics, University of Klagenfurt, Austria
References
1. Gerstl S, Cohuet S, Edoh K, Brasher C, Lesage A, Guthmann JP, Checchi F:
Community coverage of an antimalarial combination of artesunate and amodiaquine in Makamba Province, Burundi, nine months after its introduction. Malar J 2007, 6:94.
2. Ndayiragije A, Niyungeko D, Karenzo J, Niyungeko E, Barutwanayo M, Ciza A, Bosman A, Moyou-Somo R, Nahimana A, Nyarushatsi JP, Barihuta B, Mizero L, Ndaruhutse J, Delacollette C, Ringwald P, Kamana J: Efficacité de combinaisons thérapeutiques avec des dérivés de l'artémisinine dans le traitement de l'accès palustre non-compliqué au Burundi. Trop Med Int Health 2004, 9:673-679.
3. WHO: Stratégie de coopération de l'OMS avec les pays. République du Burundi. 2005.
4. UNDP: Rapport national sur le Développement humain au Burundi. 2003.
5. Greenwood B, Mutabingwa T: Malaria in 2002. Nature 2002, 415:670-672. 6. Gomez-Elipe A, Otero A, Van Herp M, Aguirre-Jaime A: Forecasting
malaria incidence based on monthly case reports and environmental factors in Karuzi, Burundi, 1997-2003. Malar J 2007, 6:129.
7. Wandiga SO, Opondo M, Olago D, Githeko A, Githui F, Marshall M, Downs T, Opere A, Yanda PZ, Kangalawe R, Kabumbuli R, Kirumira E, Kathuri J, Apindi E, Olaka L, Ogallo L, Mugambi P, Sigalla R, Nanyunja R, Baguma T, Achola P: Vulnerability to climateinduced highland malaria in East Africa. AIACC Working Paper No. 25 2006.
8. Gemperli A: Development of spatial statistical methods for modelling point-referenced spatial data in malaria epidemiology. PhD Thesis Basel University; 2003.
9. Zhou G, Minakawa N, Githeko A, Yan G: Association between climate variability and malaria epidemics in the East African highlands. Proc Natl Acad Sci USA 2004, 101:2375-2380.
10. Pemola ND, Jauhari RK: Climatic variables and malaria incidence in Dehradun, Uttaranchal, India. J Vector Borne Dis 2006, 43:21-28. 11. Gallup JL, Sachs JD: The economic burden of malaria. Am J Trop Med Hyg
2001, 64:85-96.
12. Kazembe LN, Kleinschmidt I, Holtz TH, Sharp BL: Spatial analysis and mapping of malaria risk in Malawi using point-referenced prevalence of infection data. Int J Health Geographics 2006, 5:1-9.
13. Kleinschmidt I: Spatial statistical analysis, modelling and mapping of malaria in Africa. PhD thesis, South Africa 2001.
14. Craig MH, Sharp BL, Mabaso ML, Kleinschmidt I: Developing a spatial-statistical model and map of historical malaria prevalence in Botswana using a staged variable selection procedure. Int J Health Geographics
2007, 6:1-15.
15. Hay SI, Cox J, Rogers DJ, Randolph SI, Stern DI, Shanks GD, Myers MF, Snow RW: Climate change and the resurgence of malaria in the East African highlands. Nature 2002, 415:905-909.
16. Patz JA, Lindsay SW: New challenges, new tools: the impact of climate Change on infectious diseases. Current Opinion in Microbiology 1999,
2:445-451.
17. Richard T: Malaria and climate change. Working papers series, Julian Simon Centre for Policy Research 2002.
18. Cox J, Hay SI, Abeku TA, Checchi F, Snow RW: The uncertain burden of
Plasmodium falciparum epidemics in Africa. Trends Parasitol 2007,
23:142-148.
19. Collein R: Implications of climate change on malaria in Karnataka, India
Senior Honors Thesis in Environmental Science, India; 2000.
20. Checchi F, Cox J, Balkan S, Tamrat A, Priotto G, Alberti KP, Guthmann JP:
Malaria epidemics and interventions, Kenya, Burundi, southern Sudan and Ethiopia 1999-2004. Emerg Infect Dis 2006, 12:1477-1485.
Received: 19 November 2009 Accepted: 29 April 2010 Published: 29 April 2010
This article is available from: http://www.malariajournal.com/content/9/1/114 © 2010 Nkurunziza et al; licensee BioMed Central Ltd.
This is an Open Access article distributed under the terms of the Creative Commons Attribution License (http://creativecommons.org/licenses/by/2.0), which permits unrestricted use, distribution, and reproduction in any medium, provided the original work is properly cited.
[image:7.595.56.294.94.430.2]Malaria Journal 2010, 9:114
Figure 2 Estimates of the nonlinear effects of the continuous co-variates in model (11) with 95% CI.
21. Guthmann JP, Bonnet M, Ahoua L, Dantoine F, Balkan S, van Herp M, Tamrat A, Legros D, Brown V, Checchi F: Deaths rates from malaria epidemics, Burundi and Ethiopia. Emerg Infect Dis 2007, 13:140-143. 22. Protopopoff N, Van Herp M, Maes P, Reid T, Baza D, D'Alessandro U, Van
Bortel W, Coosemans M: Vector control in a malaria epidemic occurring within a complex emergency situation in Burundi: a case study. Malar J
2007, 6:93.
23. Grover-Kopecm EK, Blumenthal MB, Ceccato P, Dinku T, Omumbo JA, Cannor SJ: Web-based climate information resources for malaria control in Africa. Malar J 2006, 5:38.
24. Encyclopedia of the Nations [http://www.nationsencyclopedia.com/ Africa/Burundi-CLIMATE.html]
25. Ministry of Public Health in Burundi, EPISTAT: .
26. Ministry of Economy, Finance and development co-operation, ISTEEBU: . 27. Ministry of Planning and Environment in Burundi, IGEBU: .
28. Matheron G: Principles of geostatistics. Economic and Geology 1963,
58:1246-1267.
29. Fahrmeir L, Tutz G: Multivariate statistical modelling based on generalized linear models, Springer 2001.
30. Hastie TJ, Tibshirani RJ: Generalized additive models Chapman & Hall; 1997. 31. Diggle JP, Ribeiro JP: Model-based geostatistics, Springer 2007.
32. Fahrmeir L, Lang S: Bayesian semiparametricregression analysis of multicategorical time-space data. Annals of the Institute of Statistical Mathematics 2001, 53:11-30.
33. Dobson AJ: An introduction to generalized linear models 2nd edition. Chapman & Hall; 2002.
34. Kneib T, Fahrmeir L: Structured additive regression for categorical space-time data: A mixed model approach. Biometrics 2006,
62:109-118.
35. Brezger A, Kneib T, Lang S: Analysing Bayesian structured additive regression models. J Stat Software 2005, 14:1-22.
36. Brezger A, Lang S: Generalized structured additive regression based on Bayesian P-splines. Computational Statistics & Data Analysis 2006,
50:967-991.
37. Stone CJ: Additive regression and other nonparametric models. Ann Statistics 1985, 13:689-705.
38. Huang HC, Chen CS: Optimal geostatistical model selection. J Am Stat Assoc 2007, 102:1009-1024.
39. Belitz C, Lang S: Simultaneous selection of variables and smoothing parameters in structured additive regression models. Computational Statistics & Data Analysis 2008, 53:61-81.
40. Fahrmeir L, Kneib Tand , Lang S: Penalized structured additive regression for space-time data. A Bayesian perspective. Statistica 2004, 14:731-761. 41. Sachs J, Malaney P: The economic and social burden of malaria. Nature
2002, 415:680-685.
42. Lang S, Brezger A: Bayesian P-splines. Journal of Computational & Graphical Statistics 2004, 13:183-212.
doi: 10.1186/1475-2875-9-114
Cite this article as: Nkurunziza et al., Bayesian modelling of the effect of