R E S E A R C H
Open Access
Characterization and tissue-specific expression
patterns of the
Plasmodium chabaudi cir
multigene family
Petra Ebbinghaus and Jürgen Krücken
*Abstract
Background:Variant antigens expressed on the surface of parasitized red blood cells (pRBCs) are important virulence factors of malaria parasites. WhereasPlasmodium falciparumerythrocyte membrane proteins 1 (PfEMP1) are responsible for sequestration of mature parasites, little is known about putative ligands mediating
cytoadherence to host receptors in otherPlasmodiumspecies. Candidates include members of thepirsuperfamily found in the human parasitePlasmodium vivax(vir), in the simian pathogenPlasmodium knowlesi(kir) and in the rodent malariasPlasmodium yoelii(yir), Plasmodium berghei(bir) andPlasmodium chabaudi(cir). The aim of this study was to reveal a potential involvement ofcirgenes inP. chabaudisequestration.
Methods:Subfamilies ofcir genes were identified by bioinformatic analyses of annotated sequence data in the
PlasmodiumGenome Database. In order to examine tissue-specific differences in the expression of cir mRNAs,
RT-PCR with subfamily-specific primers was used. In total, 432 cDNA clones derived from six different tissues were sequenced to characterize the transcribedcirgene repertoire. To confirm differences in transcription profiles ofcir
genes, restriction fragment length polymorphism (RFLP) analyses were performed to compare different host tissues and to identify changes during the course ofP. chabaudiinfections in immunocompetent mice.
Results:The phylogenetic analysis of annotatedP. chabaudiputative CIR proteins identified two major subfamilies. Comparison of transcribedcirgenes from six different tissues revealed significant differences in the frequency clones belonging to individualcirgene subgroups were obtained from different tissues. Further hints of difference in the transcription ofcirgenes in individual tissues were obtained by RFLP. Whereas only minimal changes in the transcription pattern ofcirgenes could be detected during the developmental cycle of the parasites, switching to expression of othercirgenes during the course of an infection was observed around or after peak parasitemia. Conclusions:The tissue-specific expression of cir mRNAs found in this study indicates correlation between expression of CIR antigens and distribution of parasites in inner organs. Together with comparable results for other members of thepirsuperfamily this suggests a role ofcirand otherpirgenes in antigenic variation and
sequestration of malaria parasites.
Background
Antigenic variation is a major characteristic of malaria parasites of the genusPlasmodiumleading to severe and chronic infections in a variety of vertebrates. Malaria parasites have developed strategies to evade host immune responses by expressing a large and diverse repertoire of variant proteins on the surface of
parasitized red blood cells (pRBCs) [1-4]. By rapidly switching between these antigens, the parasites avoid antibody-mediated immunity of the host thus enabling the parasites to proliferate in the host without being completely eliminated by the adaptive immune response. Furthermore, these surface antigens were proposed to be involved in adherence to endothelial cells causing sequestration of late trophozoites and schizonts in post-capillary venules in specific inner organs, which consid-erably contributes to severe pathology in the host [5-8].
* Correspondence: [email protected]
Institute for Parasitology and Tropical Veterinary Medicine, Freie Universität Berlin, Königsweg 67, 14163 Berlin, Germany
In the most virulent human pathogenPlasmodium fal-ciparum, the PfEMP1 protein family encoded by widely studiedvargenes was shown to be expressed at the sur-face of pRBC mediating the parasite binding to endothe-lial cells lining small blood vessels [9,10]. Several in vitroassays with P. falciparumrevealed a tight regula-tion of the expression of the individual variant antigens by silencing, activation and mutually exclusive expres-sion, thus only one variant protein is expressed in para-sites at any given time [10-13]. By switching the expression to another variant, antigenic properties of the surface of pRBCs changes and the parasites prevent their complete clearance [10,14]. Typical waves of para-sitaemia in persistentP. falciparuminfections reflect the repeated switching between different members of the diverse repertoire of variant antigens [10].
Further variant surface antigens encoded by multigene families were found in several otherPlasmodiumspecies infecting humans, monkeys and rodents [4,15-17]. How-ever, homologues of the var genes are not present in Plasmodium vivax or other malaria species [18], with exception of severalvar-like sequences from the chim-panzee parasite Plasmodium reichenowi[19], a close relative ofP. falciparum.
The largest multigene family inPlasmodiumgenomes was described to be formed by the Plasmodium inter-spersed repeat(pir) genes [20,21]. The superfamily of pir genes constitutes the major variant surface antigen family in mostPlasmodiumspecies. They were found in the human pathogenP. vivax (vir) [22], in the simian parasite Plasmodium knowlesi (kir) [18] and in the rodent malaria speciesPlasmodium yoelii(yir), Plasmo-dium berghei (bir) and Plasmodium chabaudi (cir) [15,17,23]. Transcriptional changes of yirgenes modu-lated by host immunity were reported in immunocom-petent mice infected with P. yoelii [24]. In contrast to the exclusive expression of individual var genes and consecutive activation of different genes in P. falci-parum, transcriptional profiling analyses in P. yoelii showed a simultaneous expression of a broad range of different yir genes within different intra-erythrocytic developmental parasite stages [25]. In a single parasite, however, only one to three yirtranscripts were detect-able. Cunningham and colleagues [25] concluded that antigenic variation in P. yoelii probably involves expo-sure of the immune system to many different YIR anti-gens and transcriptional switching takes place without any epigenetic memory. For the variant VIR proteins of the most widely distributed human malaria pathogenP. vivax, a similar differential expression in natural infec-tions could also be detected [26] and for the cir genes of the rodent malaria species P. chabaudi antigenic switching in laboratory mice has already been described [15].
Although the PIR proteins were localised close to the surface of pRBCs infected withP. vivax, P. yoelii, P. ber-ghei, andP. chabaudi[20,22,24,27], less is known about the role of PIR proteins in host/parasite interactions. For instance, a supposed correlation of antigenic varia-tion of the PIRs with sequestravaria-tion in inner organs has not yet been analysed. In P. falciparum, adherence of pRBCs to different host receptor such as CD36, ICAM-1 or chondroitin-sulfate A (CSA) is mediated by the major variant protein PfEMP1 [6,8,28], but no homolo-gues to these proteins were detected in most other malaria pathogens. Therefore, it is conceivable that the PIR proteins, which are also expressed on the surface membrane of pRBCs, are as well involved in adherence to endothelial cells and sequestration of pRBCs in the microvasculature of inner organs.
The complex phenomenon of sequestration is hitherto not completely understood as indicated by the common assumption that sequestration of mature pRBCs in the microvasculature of the host tissues, as found inP. falci-paruminfections, does not occur for P. vivax. Thus, it has been assumed that the human parasite P. vivax must have developed different strategies e.g. adherence to barrier cells in the spleen to avoid spleen clearance [29]. Recently, however,in vitro assays provided new evidence for a cytoadherence of P. vivax pRBCs to endothelial cells and placental cryosections suggesting a cytoadherence comparable to that of P. falciparum pRBCs in vivo[30]. Direct or indirect evidences for an involvement of VIR antigens in binding to host recep-tors are currently still missing. In the most studied rodent model P. berghei, real-time in vivoimaging of transgenic parasites revealed CD36-mediated sequestra-tion of schizonts in adipose tissues and lung as well as an accumulation of schizonts in the spleen [31]. Accu-mulation of other blood stages was also observed in dif-ferent tissues including the brain and placenta of pregnant mice [32-34]. Nevertheless, identification of parasite ligands involved in binding to CD36 or other host receptors are still missing.In vitroadherence ofP. chabaudi infected erythrocytes to purified human CD36 has been observed [35]. Moreover, sequestration to microvascular endothelial cells was reported to appear in an organ specific manner in P. chabaudi infections, predominantly in liver, but also in brain and spleen thus resembling at least partially the sequestration pattern in P. falciparuminfections.
obtained by amplification of a representative sample of transcribedcir genes from different host tissues. Tran-scriptional profiling analyses of cirgenes in different host tissues using RFLP analysis of RT-PCR products provided further evidence of a tissue-specific expression ofcirgenes inP. chabaudiinfections. These results pro-vide first indications for a possible correlation of anti-genic variation of the cir multigene family and sequestration in host tissues inP. chabaudiinfections.
Methods Bioinformatics
All annotated sequence data of putativecirgenes in the Plasmodium Genome Database Resource version 8.0 [36] (PlasmoDB; plasmodb.org) were compiled (Addi-tional file 1). For confirmation of correct annotation, a CD-BLAST [37-39] was performed to identify and locate the conserved domain of the CIR-BIR-YIR superfamily [22,23] (Pfam protein families database accession num-ber [PF06022]). Sequences with a partial CIR-BIR-YIR conserved domain were excluded from all subsequent analyses.
For phylogenetic reconstruction, putative CIR proteins were aligned using ClustalW2 [40] and a phylogenetic tree was calculated with PhyML 3.0 [41] using maxi-mum likelihood estimation and the JTT model [42] for amino acid substitution. The gamma shape parameter and the proportion of invariable sites were estimated and the number of substitution rate categories was set to four. The implemented BIONJ algorithm was used to build the starting tree. Resulting trees (Newick format) were visualised and processed with MEGA4 [43,44].
For validation of structural protein motifs such as transmembrane domains, signal peptides and PEXEL motifs, analyses of the protein sequences were examined with Protscale [45], TMHMM 2.0 [46,47] and SignalP [48]. Results were compared with annotations extracted from PlasmoDB.
Mice
All experiments were performed with 5-8 weeks-old outbred female NMRI mice (Crl:NMRI(Han)) provided by Charles River (Sulzfeld, Germany). The mice were kept in cages with a maximum of five animals per cage and received food and water ad libitum. The experi-ments were planed according to all relevant guidelines for animal protection and approved by German authori-ties responsible for animal protection.
Infection of mice
A non-clonal line of P. chabaudi very similar but not identical to P. chabaudi AS was used [49-51]. Blood stages of P. chabaudi were weekly passaged in female NMRI mice by intraperitoneal injection (i.p.) of a
droplet of tail vein blood diluted in PBS. Parasitaemia was evaluated in Giemsa-stained blood smears and total erythrocytes number was counted in a Neubauer chamber.
For the experiments, blood of an infected NMRI mouse was collected by cardiac puncture under anesthe-sia. For each transcriptional profiling experiment, six mice were infected i.p. with approximately 100 parasi-tized red blood cells (pRBCs). Organs and blood were collected at about 30% parasitaemia, i.e. just before peak parasitaemia.
For transcriptional profiling during the course of an infection, tail vein blood of mice infected i.p. with 100 pRBCs was passaged i.p. into naïve female NMRI mice at days 7 (early infection), 14 (around peak parasitae-mia), 21 (7 days after peak parasitaemia) and 35 (21 days after peak parasitaemia). Expression of cir genes was analysed when parasitaemia reached about 30%.
RNA and DNA extraction
Blood samples ofP. chabaudi infected mice were col-lected by cardiac puncture, rapidly frozen and stored at -80°C. Small pieces of liver, spleen, kidneys, lung and brain were transferred into RNA Later (Sigma Aldrich) and kept at -80°C for long-term storage. Total RNA was extracted using NucleoSpin® RNA II kit (Macherey-Nagel) according to the manufactures instructions. Genomic DNA extraction was performed with the NucleoSpin®Blood kit (Macherey-Nagel).
Verification of completecirgene structures
To verify the complete gene structure of selected cir genes, RT-PCR and genomic PCR were performed in parallel. The primer pairs used for amplification and detailed information about PCR conditions can be found in Additional file 2.
Cloning of RT-PCR products and sequencing
Residual contaminating genomic DNA in total RNA preparations was digested with DNase I (Fermentas). First strand cDNA was synthesised using 1 μg RNA and the RevertAid™Premium Reverse Transcriptase (Fer-mentas) with Oligo dT18primers including reactions
without reverse transcriptase as negative controls for amplification.
highly conserved sequence regions for amplification of a broad range ofcirgenes.
Following cDNA synthesis, amplification with the AccuPrime™ DNA polymerase (Invitrogen) was per-formed using subfamily-specific primers for cir subfam-ily 1 and 2. After an initial denaturation for 30 s at 94° C, 40 cycles of 10 s at 94°C, 30 s at 55°C, 30 s at 72°C followed by a final extension of 10 min at 72°C. RT-PCR products were then isolated from a 0.8% agarose gel and precipitated in the presence of glycogen.
In order to sample a first repertoire of transcribedP. chabaudi cir genes, RT-PCR products of each tissue (blood, liver, spleen, kidney, lung and brain) were gel-purified and cloned into the pCR™4-TOPO®TA vector (Invitrogen). Thirty-six clones for each tissue and sub-family were sequenced (GATC, Constance, Germany) resulting in sequences for 216 independent cDNA clones forcirsubfamily 1 and 2.
Transcriptional profiling of RT-PCR products by RFLP For transcriptional profiling, DNase digestion of RNA and cDNA synthesis was performed as described before and RT-PCR products were amplified with the Phusion® Hot Start II High-Fidelity DNA Polymerase (Fermentas) using subfamily-specific primers forcirsubfamily 1 and 2. After an initial denaturation for 30 s at 98°C, 50 cycles of 10 s at 98°C, 30 s at 55°C, 30 s at 72°C were performed followed by a final extension for 10 min at 72°C.
Gel-purified RT-PCR products (150 ng) were digested withAluI or XapI (Fermentas) in 5 μl for 3 h at 37°C followed by enzyme inactivation for 20 min at 65°C. The restricted fragments (30 ng) were analysed with the Agilent 2100 Bioanalyzer using the DNA 1000 LabChip® kit (Agilent) following the manufactures instructions. In order to ensure reproducibility of the RFLP profiles, both RT-PCR and RFPL were usually repeated at least twice resulting in 4 replicates.
Statistical analyses
In order to evaluate whether clones representing certain cirsubfamilies were significantly more frequently recov-ered from one tissue than from others, frequencies were compared using a Z-test.
Results
Phylogenetic analyses of putative CIR proteins in PlasmoDB
A total of 199 putative CIR proteins had been annotated in the PlasmodiumGenome Database Resource (state September 2011) ascirgenes. For confirmation of cor-rect annotation, the putative CIR sequences were exam-ined regarding the conserved domain of the CIR-BIR-YIR Superfamily (accession number [PF06022] for the
Pfam database). This conserved sequence motif were found in several CIR, BIR and YIR proteins of the Plas-modium species P. chabaudi, P. berghei and P. yoelii (Figure 1) [22,23]. The presence of a complete con-served domain of the CIR-BIR-YIR superfamily could only be confirmed for 186 of them. For the remaining 13 putative CIR proteins, no (four sequences) or only a partial CIR-BIR-YIR conserved domain (seven sequences) could be identified. As there was no evidence for the missing regions in the adjacent genomic sequences, these database entries most like representcir pseudogene fragments. These sequences were excluded from all subsequent analyses. Furthermore, three sequences (PCHAS_040020; PCHAS_000130; PCHAS_000400) showed two hits for the CIR-BIR-YIR conserved domain. In these cases the first hit only represented a partial domain and these partial domains were therefore also excluded. The final 186 putative CIR proteins containing a complete conserved CIR-BIR-YIR domain were used for all following analyses and are listed in Additional File 1. Due to the fact that the P. chabaudi genome is assembled already to 14 (more or less) complete chromosomes whereas theP.yoelii geno-mic sequence is still scattered on 5.617 unassembled contigs, it is highly probable that vast majority of thecir genes in the genome have been identified and annotated in the current PlasmoDB release (8.0) and that the num-ber ofcirgenes is indeed much smaller than the num-ber ofyirgenes (about 838 genes) [52].
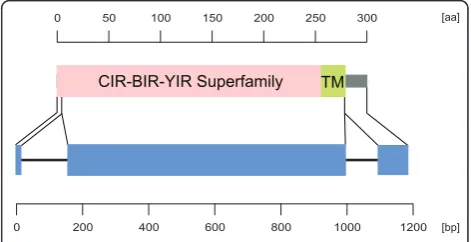
CIR-BIR-YIR Superfamily TM
0 0
200 50
400 100
600 150
800 200
1000 250
1200 300
[image:4.595.304.540.456.577.2][bp] [aa]
Figure 1 Schematic domain architecture and genomic organization of putative CIR proteins. For a representative CIR protein of cir subfmily 1 and 2 the protein domain architecture is shown in the upper and exon/intron structure in the lower panel. The protein and gene sequences are presented by lines, protein domains and exons are indicated by boxes. Separate scale bars are given for protein and gene structure, respectively. The CIR-BIR-YIR Superfamily (pink, accession number [PF06022] for the Pfam database) includes CIR, BIR and YIR proteins of thePlasmodium
speciesP. chabaudi, P. bergheiandP. yoeliiexhibiting a conserved domain of a consensus sequence of 279 amino acids which is encoded by the first and second exon of the conserved three exon structure of thesepirgenes [22,23]. The COOH-terminal
The phylogenetic maximum likelihood analysis of all 186 annotated CIR domains including a selected subset of the related YIR proteins inP. yoeliiusing representa-tives of all different subgroups defined previously in the yir family [52] (Figure 2) identified four distinct branches. Three large branches of CIR proteins were indicated with likelihood ratios of more than 95% as sta-tistical support values at the nodes and one small branch with 92% support. Two of these branches were designated here as subfamily 1 and 2 containing CIR amino acid sequences that show a relatively low variabil-ity within the subfamilies and are very similar to well
known YIR and BIR proteins in terms of size and overall structure. The other two branches with more divergent CIR proteins were not designated as a specific subfamily due to their high heterogeneity. In contrast to subfamily 1 and 2, these unassigned branches include many very long CIRs. In most cases these proteins exhibit an addi-tional highly variable insertion within the CIR-BIR-YIR domain. Such divergent family members have already been described in previous studies of the PIRs superfam-ily [20]. Interestingly, the analysis also reveals important information about the relationship between CIR and YIR proteins. The phylogenetic tree indicated that the
0.5
cir subfamily 1
[image:5.595.60.538.256.633.2]cir subfamily 2
subset of YIR proteins shares similarities only with the predicted subfamily 2 but neither with subfamily 1 nor the unassigned heterogeneous CIR sequences.
For identification of the individual proteins in each branch, the phylogenetic tree of CIR and YIR proteins is given in Newick format in Additional file 3.
Localization motifs found in CIR proteins
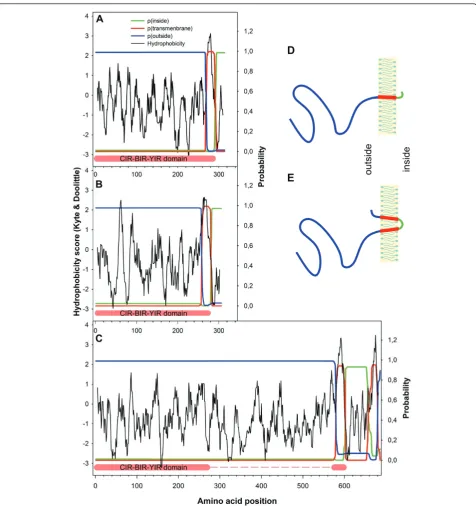
For protein structural analyses, the 186 putative CIR proteins were examined in regard to subcellular localiza-tion characteristics, such as putative signal peptides, transmembrane domains, and the PEXEL motif ( Plasmo-diumexport element) [53,54]. Results were then com-pared to annotations in PlasmoDB. Detailed information on protein motifs identified in all putative CIR proteins can be obtained from Additional file 1. In only one of the 186 sequences (PCHAS_114740) a signal peptide had been annotated, however, the re-analysis with Sig-nalP revealed only a 1.6% probability for the presence of a signal peptide in this particular predicted CIR protein with a maximum cleavage site probability of 1.2% between amino acid position 26 and 27. Moreover, a cDNA sequence encoding a corresponding CIR protein with signal peptide could not be amplified by RT-PCR using primers derived from PCHAS_114740 in the non-clonal P. chabaudi line used throughout this study. Altogether, this indicates that the CIR proteins lack a signal peptide and presumably use alternative pathways for transport out of the parasite cell across the parasito-phorous vacuole to the host cell membrane.
For the vast majority of putative CIR proteins (147 sequences) the presence of one transmembrane domain had been annotated in PlasmoDB. Hydrophobicity plot analyses according to Kyte and Doolittle were performed using Protscale [45] confirming a hydrophobic stretch close to the COOH-terminus of these CIRs. A predic-tion of transmembrane topology using TMHMM 2.0 [47] indicated a transmembrane helix of approximately 23 amino acid residues immediately upstream of the COOH-terminus of the CIR-BIR-YIR conserved domain with a probability of more than 99%. The largest part of the NH2-terminus of CIR proteins was predicted to be
located outside and only less than 30 amino acids inside the cytoplasm. The corresponding hydrophobicity plots as well as the predicted transmembrane topology for representative CIR proteins of subfamily 1 and 2 are shown in Figure 3A and 3B. For a notably lower propor-tion of CIR proteins (37 sequences) two transmembrane helices and for one CIR sequence (PCHAS_011490) even three transmembrane helices had been annotated. The phylogenetic analysis revealed that all these protein sequences were unassigned CIRs and did not belong to subfamily 1 or 2. The hydrophobicity analyses indicated an additional second hydrophobic stretch behind the
CIR-BIR-YIR conserved domain immediately at the COOH-terminus in these CIRs. The predicted trans-membrane topology by TMHMM also suggested the presence of two transmembrane helices, both spanning the membrane with 23 amino acids. In this case not only the large NH2-terminal CIR domain but also a
seg-ment of less than 10 amino acids at the COOH-termi-nus were predicted to be outside (Figure 3C). For the putative sequence PCHAS_011490 with three predicted transmembrane domains, two additional helices were found behind the CIR-BIR-YIR conserved domain by Protscale. The schematic transmembrane topology for selected CIR proteins is given in Figure 3D and 3E.
Finally, the putative CIR proteins were scanned for the conserved five-residue PEXEL motif Rx[L/I]x[E/Q/D] with the Protein Motif Pattern search tool in PlasmoDB. This short hydrophobic peptide has been proposed to be localised 16-24 amino acids downstream of the NH2
-terminus and to mediate the export of proteins across the parasitophorous vacuole to the erythrocyte cyto-plasm [53,54]. Seventeen sequences of the putative CIR proteins were identified to have the specific PEXEL motif but none of these sequences exhibited the PEXEL motif at its canonical position. In the protein sequence PCHAS_114700 the motif is located at amino acid posi-tion 4-8 and in four sequences between posiposi-tion 30-70. In another 10 small CIR proteins and in two large CIR proteins, the PEXEL motif is found between the amino acids 90-300 or 640-660, much closer to the COOH-than to the NH2-terminus. Hence, all annotated putative
CIR proteins only possess an Rx[L/I]x[E/Q/D] stretch in their sequence but lack a functioning PEXEL motif.
Verification of complete gene structures
In several studies, a common three-exon gene structure was postulated for genes of thepirsuperfamily in rodent malaria parasites [15,23,24]. For verification of the com-plete gene structure of selectedcirgenes of subfamily 1 and 2, further bioinformatic analyses and experimental tests such as parallel RT- and genomic PCR were per-formed. The results show that indeed thecirgenes con-sists of three exons like the relatedyir genes ofP. yoelii [25,52]. The coding region of cir cDNAs is unevenly dis-tributed between these exons with about 15 bp of the open reading frame in the first, 800-840 bp (highly poly-morphic but containing highly conserved motifs) in the second, and 80-90 bp in the third exon. The two introns of 100-150 bp are found in conserved positions (Figure 4). Moreover, evidence for the occurrence of minor splice variants of cirgenes was detected by comparison of RT-PCR and genomic PCR products. Transcripts of cir genes were amplified where alternative splicing of the first exon was detected leading to an NH2-terminally
D
[image:7.595.60.537.86.593.2]E
outside insideFigure 3Transmembrane topology of some selected CIR proteins. To examine the predicted transmembrane topology of selected CIR Proteins two different analyses tools were used. With the Protscale analysis, hydrophobicity plots were created according Kyte & Doolite [45]. With the TMHMMM 2.0 server [47], probabilities of predicted transmembrane topologies were calculated. For three different CIR proteins (A-C) the results of the Protscale and TMHMM 2.0 were here compiled in one graph. On the x-axis the amino acid positions are given whereas on the left y-axis the hydrophobicity scores and on the right y-axes the probabilities for extracellular, intracellular and transmembrane localization are shown, respectively. The CIR proteins PCHAS_060060 of subfamily 1 (A) and PCHAS_000320 of subfamily 2 (B) were analysed as well as one of the unassigned CIR protein (PCHAS_010040) (C). For the first two proteins, only one transmembrane helix was predicted with more than 99% probability immediately close to the COOH-terminus of the CIR-BIR-YIR conserved domain, whereas the long NH2-termininal part was assumed
to be located outside. For the longer unassigned CIR protein, an additional second helix was located behind the CIR-BIR-YIR conserved domain close to the COOH-terminus in this CIR. The large NH2-terminus as well as less than 10 amino acids of the COOH-terminus were predicted to be
outside. The individual curves were highlighted by different colours (see graphic legend). Additionally, schematic presentations of the
splice-site within the non-coding region of the first exon was used whereas the 3’splice-site was identical in both transcripts (Additional file 4). Whether this splice iant encodes a functionally important CIR protein var-iant or represents only a mis-spliced product can not finally be decided from the available data. Sequences of genomic DNA and full-length cDNA sequences have been deposited in GenBank with accession numbers [GenBank:JF904729 - JF904735] (Additional file 2).
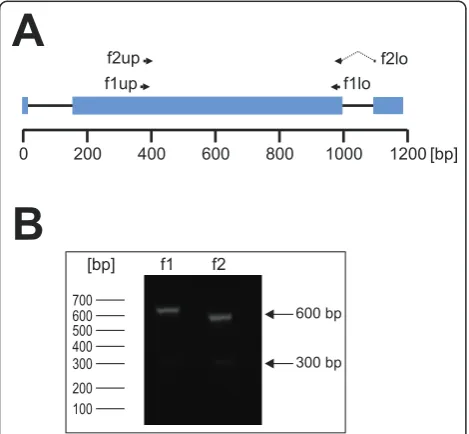
RT-PCR ofcirgenes with subfamily-specific primers For the subsequent transcriptional profiling analyses (see below), subfamily-specific primers for cir subfamily 1 and subfamily 2 were designed spanning the second exon, the essential part of the CIR-BIR-YIR conserved domain. The primer pairs were located at highly con-served sequence regions for amplification of a broad range ofcircDNAs (Figure 4A). The expected RT-PCR
product sizes for subfamily 1 and subfamily 2 were about 600 bp (Figure 4B). In most PCRs, however, an additional smaller but very faint RT-PCR product (approx. 300 bp) appeared. Sequencing analyses indi-cated that this product is a notably smaller cir transcript with a deletion of about 250 bp within the second exon. This cDNA most likely also represents an alternatively spliced cirvariant, in particular since this cDNA [Gen-Bank:JF969288] has an uninterrupted open reading frame.
Cloning of cir cDNAs from individual tissues
To examine whether the expression of certain cir anti-gen mRNAs correlates with the localization of the para-sites in particular internal organs, a first repertoire of transcribedcirgenes was amplified from parasites using RT-PCR and subfamily-specific primers for subfamilies 1 and 2. For this purpose, a single female NMRI mouse was i.p. infected with 100 pRBCs and, at a parasitaemia of 30%, blood, liver, spleen, kidney, lung and brain were collected for RNA isolation. RT-PCR products of about 600 bp from each tissue were excised from agarose gels and directly cloned into the pCR4-TOPO vector. For each tissue, clones were obtained from at least three independent RT-PCR reactions. Thirty-six clones for each tissue and subfamily were sequenced resulting in 216 cir sequences for each cir subfamily. Information about individual sequences with GenBank® accession numbers can be found in Additional file 5. A broad range of different sequences from both subfamilies was amplified as shown by phylogenetic maximum likelihood analysis of the deduced protein sequences in comparison with the 186 putative conserved domains obtained from PlasmoDB (Additional file 6) indicating that the method is able to amplify a representative repertoire of both subfamilies. The facts that (i) the length of the amplified fragments differs only minimally (mean length and SD is 561 bp ± 2.5% for subfamily 1 and 523.7 bp ± 4.4% for subfamily 2) and (ii) the percent identity is very high (mean percent identity and SD is 80.8% ± 8.5% for sub-family 1 and 76.7% ± 10.9% for subsub-family 2) a strong bias introduced by unequal amplification efficacies is at least unlikely.
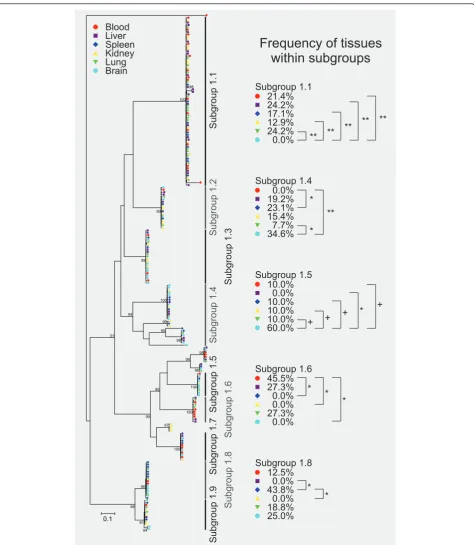
The phylogenetic analyses of the proteins deduced from subfamily 1 cir cDNA sequences identified nine different sequence subgroups within the repertoire of expressed subfamily 1 cirgenes. Branch lengths and likelihood ratios for nodes with at least 90% support indicated that the transcribed cir sequences within these subgroups are very similar or even identical (Figure 5). See in Additional file 7 for the Newick format of the phylogenetic tree of cir subfamily 1.
Statistical analyses using a Z-test were done to identify significant differences in the frequency of different
A
B
0 200
f1up
400 600 800 1000 1200 [bp]
f2up f2lo
f1lo
100 200 300 400 500 600 700
f1
[bp] f2
600 bp
[image:8.595.57.292.326.543.2]300 bp
Figure 4 RT-PCR with subfamily-specific primers. (A) Thecir
gene structure and the location of the subfamily-specific primer pairs for cir subfamily 1 and 2. The f1up/f1lo (subfamily 1) and f2/ f2lo (subfamily 2) primers are indicated as black arrows. Mostcir
98 100
99
99
100
99
98 99 94
98
96 99
100
100 90
97
100 99 91
94 91 99
96
0.1
Subgroup 1.1
Subgroup 1.2
Subgroup 1.4
Subgroup 1.5
Subgroup 1.7
Subgroup 1.9
Subgroup 1.6
Subgroup 1.8
Subgroup 1.3
0.0% 19.2% 23.1% 15.4% 7.7%
34.6% *
* **
10.0% 0.0% 10.0% 10.0% 10.0%
60.0% +
+ + *
+
45.5% 27.3% 0.0% 0.0% 27.3% 0.0%
* * *
12.5% 0.0% 43.8% 0.0% 18.8% 25.0%
* * 21.4% 24.2% 17.1% 12.9% 24.2%
0.0% ** **
** ** **
Subgroup 1.8 Subgroup 1.6 Subgroup 1.5 Subgroup 1.4 Subgroup 1.1
Frequency of tissues
within subgroups
[image:9.595.62.537.86.632.2]Blood Liver Spleen Kidney Lung Brain
tissues represented within those individual subfamilies that are sufficiently represented within the total popula-tion. The method does not allow to detect expression differences for minor cir transcripts. Results are also indicated in Figure 5. Most remarkably, the cir cDNA belonging to subgroup 1.1 could be frequently recovered from liver (24.2% of all subgroup 1.1 clones), lung, (24.2%) blood (21.4%), spleen (17.1%) and kidney (12.9%) but not from brain (0%). The absence of this cir cDNA from our brain samples is statistically significant when compared to all other tissues (p < 0.01). In con-trast, the cir cDNA sequences of subgroup 1.4 were not found in blood cDNA but significantly more often pre-sent in brain (34.6%; p < 0.01) and spleen (23.1%; p < 0.05) samples. Furthermore, a significant difference could be detected between brain and lung (7.7%) in sub-group 1.4 (p < 0.05). The cir cDNAs in subsub-group 1.5 were absent from liver samples (0%) but a higher num-ber (60%) of these clones came from brain samples than from all other tissues investigated (10% for each tissue). While the differences between brain and liver were sta-tistically significant (p < 0.05), differences between brain and the other tissues (10%) did just not reach signifi-cance (p < 0.07). The cDNA sequences of subgroup 1.6 were absent from spleen, kidney and brain samples but were found in blood (45.5%), liver (27.3%) and lung (27.3%). The frequency of clones obtained from blood within the cir subgroup 1.6 were significantly higher when compared to spleen, kidney and brain (p < 0.01). Finally, for subgroup 1.8 no cir cDNAs could be detected in liver and kidney. In contrast, this subgroup was obtained with a high frequency of 43.8% from the spleen and with intermediate frequencies of 12.5% from blood, 18.8% from lung and 25.0% from brain. However, only the differences between the frequencies for spleen, liver and kidney were statistically significant (p < 0.05).
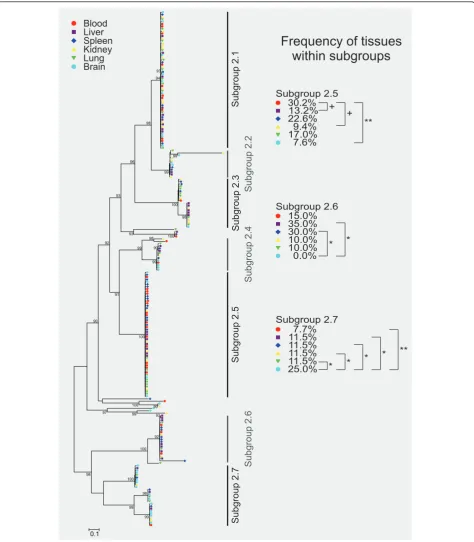
An equivalent analysis was done for thecirsubfamily 2 (Figure 6). However, only minor differences in tissue distribution of cir cDNAs could be found within the 7 subgroups identified in the expressed set of subfamily 2 cir genes. Significant differences in the frequency between tissues were shown only in three subgroups of cir subfamily 2. In subgroup 2.5, a significant difference was observed only between blood with a frequency of 30.2% and brain with a frequency of 7.6% (p < 0.01). Differences between blood and liver (13.2%) as well as blood and kidney (9.4%) did just not reach significance (p < 0.07). In subgroup 2.6, the absence of cDNAs obtained from brain resulted in a statistical difference only to the frequency of clones derived from liver and spleen samples with frequencies of 35.0% and 30%, respectively (p < 0.05). Within the cir cDNA sequences in subgroup 2.7, frequency of clones recovered from brain was significantly increased in brain (25%)
compared to all other tissues with p < 0.01 for blood (7.7%) and p < 0.05 for liver (11.5%), spleen (11.5%), kid-ney (11.5%), and lung (11.5%). See in Additional file 8 for the Newick format of the phylogenetic tree of cir subfamily 2.
All these differences in tissue distribution of the tran-scribed cir cDNAs found in this cloning and sequencing study are first indications for a tissues specific expres-sion of cir genes and were analysed in more detail in the subsequent experiments.
Expression profiling ofcirgenes in different host tissues Due to these first differences in the expression of cir genes, further analyses of different transcription profiles in various host tissues during the infection were carried out using RFLP of RT-PCR products in order to confirm differences in expression ofcir genes between different host tissues for a larger number of mice.
Therefore, six mice were infected i.p. with 100 pRBCs. Only four out of these six mice developed a patent infection indicating that 100 pRBCs i.p. is close to the minimal infectious dose and that the initial diversity of parasites is kept at a minimum using this infection pro-tocol. Organs and blood were again collected at about 30% parasitaemia, i.e. just before peak parasitaemia. After amplification using the subfamily 1 and subfamily 2 specific primers, PCR products were digested with the restriction enzyme AluI and analysed using the DNA 1000 kit for the Agilent 2100 bioanalyzer for accurate and reproducible separation and size determination (Fig-ure 7).
Subgroup 2.5
Subgroup 2.7
Subgroup 2.6
Frequency of tissues
within subgroups
7.7% 11.5% 11.5% 11.5% 11.5% 25.0% Subgroup 2.7
* * *
* **
100
Subgroup 2.1
Subgroup 2.2
Subgroup 2.4
Subgroup 2.3
15.0% 35.0% 30.0% 10.0% 10.0% 0.0%
* *
Subgroup 2.6 30.2% 13.2% 22.6% 9.4% 17.0% 7.6%
+ + Subgroup 2.5
** Blood
Liver Spleen Kidney Lung
Brain 93
94
99
99 98
98 100 96
100 93
93
98 90 99 99
91 92
99 100 90
99 97
100 98
99 99 98
100 92
93
[image:11.595.62.537.88.631.2]0.1
Figure 6Phylogenetic tree representing frequency of tissues within subgroups of the cir subfamily 2. Phylogenetic tree based on maximum likelihood estimation showing 216 protein sequences deduced from cir cDNAs of subfamily 2 amplified from six different host tissues of a single female NMRI mouse infected with 100 pRBCs (parasitaemia about 30%). The RT-PCR products for each tissue (blood, liver, spleen, kidney, lung and heart) were cloned and 36 clones from each tissue were sequenced. Statistical support is indicated as likelihood ratios only for those nodes with at least 90% support. The scale bar represents 0.1 substitutions per amino acid position. The origins of sequences (host tissues) are indicated by different colours as shown in the figure graphic legend. The cir subfamily 2 repertoire expressed here can be divided in 7 subgroups but only three of these subgroups (subgroup 2.5, 2.6, 2.7) showed significant differences of the frequency between tissues. The p-values were calculated by Z-test; **p < 0.01; *p < 0.05;+p < 0.07). Small (rarely occurring) subgroups of cir cDNAs were excluded from the
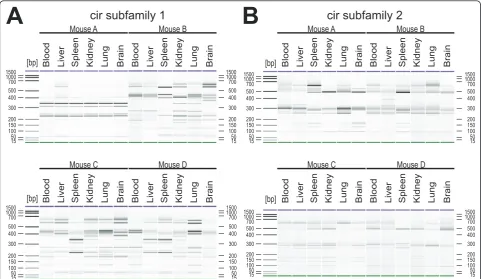
For subfamily 1, no transcriptional differences between the tissues were found in mouse A (Figure 7A). More-over, the restriction pattern obtained for this mouse was highly different in comparison to the restriction profiles of mice B-D and the sizes of the individual fragments did not clearly refer to any in silicofragments of cir sequences obtained in the cloning study. This presence or absence of individual fragments in the RT-PCR RFLP profiles for subfamily 1 are further hints for a differen-tial expression ofcir genes in different host tissues. In particular, in mouse B, additional fragments in restric-tion patterns were observed e.g. in brain (~ 370 bp) or in kidney and lung (~ 340 bp) which were absent from samples of all other tissues (Figure 7A). Further differ-ences within the transcriptional profiles of cir subfamily 1 were detected e.g. in the spleen of mouse C, showing a distinct banding pattern compared to the other five tissues of the same mouse.
Differences - though generally less pronounced - were also found in cir subfamily 2 (Figure 7B). An additional fragment of ~ 400 bp was present e.g. in the liver of mouse B which was absent in blood, spleen kidney, lung, and brain samples from the same mouse.
Furthermore, two additional bands of cir fragments of approximately 100-200 bp appeared in the spleen of mouse B.
In conclusion, the differences in the transcriptional profiles of the different host tissues found in this experi-ment confirmed a correlation between parasite tissue localization on expression of specificcirgenes.
Expression profiling ofcirgenes during the course of infection
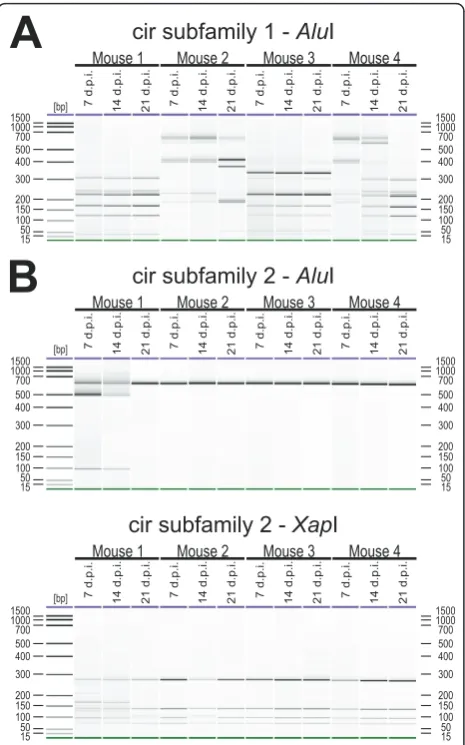
In the blood of mice infected with 100 pRBCs, changes in the expression pattern of cirgenes during the course of infection could also be detected by RT-PCR RFLP (Figure 8). The tail vein blood of mice infected i.p. with 100 pRBCs was passaged into naïve female NMRI mice at days 7 (early infection), 14 (around peak parasitae-mia), 21 (7 days after peak parasitaemia) and 35 (21 days after peak parasitaemia) p.i. For analyses, blood of these passage mice was collected again at about 30% parasitaemia, i.e. just before peak parasitaemia.
Surprisingly, only two out of four immunocompetent mice (mouse 2 and 4) showed changes in expression of subfamily 1 cirgenes in the blood between day 7 (early
15 15 15 15 15 15 15 15 50 50 50 50 50 50 50 50 100 100 100 100 100 100 100 100 150 150 150 150 150 150 150 150 200 200 200 200 200 200 200 200 300 300 300 300 300 300 300 300 400 400 400 400 400 400 400 400 500 500 500 500 500 500 500 500 700 700 700 700 700 700 700 700 1000 1000 1000 1000 1000 1000 1000 1000 1500 1500 1500 1500 1500 1500 1500 1500 [bp] [bp]
Mouse A Mouse B
Blood Blood Liver Liver Spleen Spleen Kidney Kidney Lung Lung Brain Brain Blood Blood Liver Liver Spleen Spleen Kidney Kidney Lung Lung Brain Brain
Mouse C Mouse D
[bp]
[bp]
Mouse A Mouse B
Blood Blood Liver Liver Spleen Spleen Kidney Kidney Lung Lung Brain Brain Blood Blood Liver Liver Spleen Spleen Kidney Kidney Lung Lung Brain Brain
Mouse C Mouse D
[image:12.595.57.539.89.368.2]A
cir subfamily 1
B
cir subfamily 2
infection), day 14 (around peak parasitaemia) and day 21 (after peak parasitaemia) (Figure 8A) p.i. However, the virtually identical patterns produced here provide addi-tional evidence for the reproducibility of the RFLP method. In mouse 2, a completely different restriction fragment pattern was observed at day 21 p.i., seven days
after peak parasitaemia, compared to the profiles of early parasitaemia (day 7 p.i.) and peak parasitaemia (day 14 p.i.). In mouse 4 the first differences in the expression pattern of the cir genes were observed already at peak parasitaemia (day 14 p.i.) and a comple-tely changed RFLP pattern was found at day 21 p.i. (after parasitaemia) compared to day 7 p.i. in the early phase of infection. Surprisingly, however, no changes in the expression pattern could be observed for subfamily 1 in mouse 1 and 3 (Figure 8A) and for all four mice in subfamily 2. The same RFLP pattern of amplified cir cDNAs could be identified throughout the course of an infection (Figure 8B). SinceAluI did apparently not cut the cir subfamily 2 members expressed in this experi-ment, an additional restriction digestion with XapI was then performed (Figure 8B) confirming further that no changes in expression of cir subfamily 2 occurred in the course of an infection in these mice.
At day 35 p.i., all mice had completely resolved the infection irrespectively of changes incirgene expression pattern before. Apparently, a chronic infection of the mice failed to occur after i.p. infection with 100 pRBC whether or not changes in cir gene expression pattern were detectable in the earlier infection.
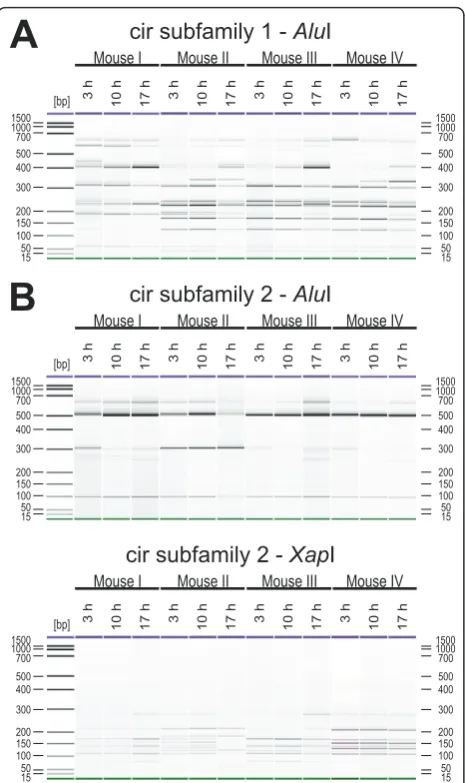
Transcriptional profiling ofcirgenes throughout intraerythrocytic development
For RFLP analyses of transcriptional changes of the cir genes at different life cycle stages, 30μl tail vein blood of female NMRI mice infected with 100 pRBCs was col-lected at 3 h (early trophozoites), 10 h (late tropho-zoites) and 17 h (mature trophozoites and early schizonts) after beginning of the light cycle on day 13 p. i. (parasitaemia about 30%).
For cir subfamily 1, changes in the transcription pro-file could be detected in the course of a life cycle in all four mice (Figure 9A). However, these changes were much smaller than the dramatic transcriptional changes in the course of an infection which were observed for two out of four mice in Figure 8A. Only minimal changes in the fragment pattern were also observed for cir subfamily 2. Because of the very simple and uninfor-mative restriction fragment pattern for cir subfamily 2 cDNAs in all mice, an additional restriction digestion with XapI was again performed (Figure 9B) likewise indicating only minimal differences in the transcription pattern of cir subfamily 2 during the intraerythrocytic life cycle ofP. chabaudi.
Discussion
In order to improve understanding of host/parasite interactions correlating antigenic variation and accumu-lation of parasite localization in different host tissues, expression of theP. chabaudi cir multigene family was 15 15 15 50 50 50 100 100 100 150 150 150 200 200 200 300 300 300 400 400 400 500 500 500 700 700 700 1000 1000 1000 1500 1500 1500 15 15 15 50 50 50 100 100 100 150 150 150 200 200 200 300 300 300 400 400 400 500 500 500 700 700 700 1000 1000 1000 1500 1500 1500 [bp]
Mouse 1 Mouse 2 Mouse 3 Mouse 4
7 d.p.i. 14 d.p.i. 21 d.p.i. 7 d.p.i. 14 d.p.i. 21 d.p.i. 7 d.p.i. 14 d.p.i. 21 d.p.i. 7 d.p.i. 14 d.p.i. 21 d.p.i.
A
cir subfamily 1 -
Alu
I
[bp]
Mouse 1 Mouse 2 Mouse 3 Mouse 4
7 d.p.i.
14 d.p.i. 21 d.p.i. 7 d.p.i. 14 d.p.i. 21 d.p.i. 7 d.p.i. 14 d.p.i. 21 d.p.i. 7 d.p.i. 14 d.p.i. 21 d.p.i.
B
cir subfamily 2 -
Alu
I
[bp]
Mouse 1 Mouse 2 Mouse 3 Mouse 4
7 d.p.i.
14 d.p.i. 21 d.p.i. 7 d.p.i. 14 d.p.i. 21 d.p.i. 7 d.p.i. 14 d.p.i. 21 d.p.i. 7 d.p.i. 14 d.p.i. 21 d.p.i.
[image:13.595.58.291.88.461.2]cir subfamily 2 -
Xap
I
analysed in vivo at the transcriptional level. Despite diversein vitroor in vivoinvestigations regarding anti-genic variation in Plasmodium species, the complete molecular mechanism of antigenic switching in the parasites is, hitherto, far away from being fully
understood. The present study, therefore, examinedP. chabaudi infections in immunocompetent mice to get further insight in the complex phenomenon of antigenic variation and sequestration.
In an initial phylogenetic analysis of the annotated repertoire of putative CIR proteins, two subfamilies and an unassigned group of very long CIRs could be identi-fied. While the subfamily 1 and 2 exhibit the predicted primary structure of common PIR proteins, the unas-signed CIR proteins show more divergence often due to large insertions within the conserved CIR-BIR-YIR domain.
It has already previously been proposed that different subsets within thepirsuperfamily exhibit different func-tions. In P. yoelii and P. berghei, for example, a stage specific role was assumed since not all pir genes are transcribed equally when different life cycle stages were compared [24,55]. Indeed, different roles forP. chabaudi cir subfamily 1 (with changes in expression pattern) and subfamily 2 (with minor or no changes in expression pattern) genes are likely. The large insertions and addi-tional transmembrane domains found within the group of unassigned CIR proteins might also be interpreted as hints for distinct functions of these proteins. Since none of them has been examined in any functional or even localization study, there is still no clue for the role these proteins might play in the Plasmodiumlife cycle or in the pathogens immune evasion strategy. For the VIR proteins in P. vivax diverse protein domain and struc-ture predictions have been suggested to indicate differ-ent functions for differdiffer-ent subsets of these proteins as for example those with PEXEL motif or those with addi-tional transmembrane domains [56]. However, the pre-sence or abpre-sence of the PEXEL motifs might simply result in usage of alternative transport signals or path-ways to the host cell membrane [57] and currently no functional role has been suggested for any of the PIR proteins with more than one transmembrane domain. Since bioinformatic analysis of the CIR proteins revealed not a single strong PEXEL motif, it can be assumed that PEXEL motifs are not an important feature in the func-tion of CIR proteins and that at least the majority of PIR proteins is able to be transported to the pRBC sur-face without an obvious PEXEL translocation signal.
A common ancestry of the gene families forming the pir superfamily has been postulated due to e.g. con-served sequence motifs as well as structural predictions within the PIR sequences [20]. By phylogenetic compari-son of CIR and YIR proteins as performed here, this hypothesis can be further strengthened. The phyloge-netic relationship of the CIR proteins with the widely studied YIRs in P. yoelii shows that the YIR protein sequences only share high similarity to CIR proteins of subfamily 2 and neither to subfamily 1 nor the group of
[bp]
Mouse I Mouse II Mouse III Mouse IV
3 h
10 h 17 h 3 h 10 h 17 h 3 h 10 h 17 h 3 h 10 h 17 h
A
cir subfamily 1 -
Alu
I
[bp] [bp] Mouse I Mouse I Mouse II Mouse II Mouse III Mouse III Mouse IV Mouse IV 3 h 3 h 10 h 10 h 17 h 17 h 3 h 3 h 10 h 10 h 17 h 17 h 3 h 3 h 10 h 10 h 17 h 17 h 3 h 3 h 10 h 10 h 17 h 17 h
B
cir subfamily 2 -
Alu
I
cir subfamily 2 -
Xap
I
[image:14.595.58.291.86.478.2]15 15 15 50 50 50 100 100 100 150 150 150 200 200 200 300 300 300 400 400 400 500 500 500 700 700 700 1000 1000 1000 1500 1500 1500 15 15 15 50 50 50 100 100 100 150 150 150 200 200 200 300 300 300 400 400 400 500 500 500 700 700 700 1000 1000 1000 1500 1500 1500
Figure 9 Transcriptional changes of cir genes during intraerythrocytic development. For expression profiling of thecir
unassigned CIR proteins. Comparison to the YIR anti-gens of the close relativeP. yoelii suggests that most of the CIR sequences in the P. chabaudi genome have evolved by diversification after separation of P. yoelii andP. chabaudifrom a common ancestor. Such a dis-persing evolution of distinctly evolved subfamilies has also been demonstrated by phylogenetic analysis of PIR proteins encoded in P. yoelii and P. berghei genomes [52] and it is likely that the high variability of antigens in the individual malaria species distinctly evolved prob-ably in response of the host immune pressure.
In this study a non-clonalP. chabaudi line very simi-lar to the clonalP. chabaudi AS strain was used. The deduced protein sequences of the amplified cir tran-scripts of these parasites, however, were quite similar but not identical to the annotated putative CIR pre-dicted from the genome sequence of the clonal P. cha-baudiAS strain supposing a high variability of antigens even between closely related strains within the same species.
Cloning and sequencing of a first subset ofcirgenes demonstrated that a broad range of subfamily 1 and sub-family 2cirgenes is transcribed during aP. chabaudi infection in immunocompetent mice infected with a star-ter population of a minimal size. These findings are con-sistent with those described previously for otherpir multigene families, e.g. thevirgenes inP. vivax, theyir genes in P. yoelii and the bir genes in P. berghei [25,26,55]. In contrast to the mutually exclusive expres-sion of only onevargene found inP. falciparum para-sites culturedin vitro[58], it has been shown that inP. vivaxand in several rodentsPlasmodiumspecies many differentpirgenes were transcribedin vivowithin a para-site population in an individual host. Interestingly, exami-nations of naturalP. falciparuminfected human samples has shown that - in contrast to the limited transcription pattern in culturedP. falciparumparasites - many tran-scripts ofvarandstevorgenes are also transcribed simul-taneouslyin vivo[59,60]. Such contradictoryin vivoand in vitrofindings make clear thatin vivomodels such asP. chabaudior other rodent malaria parasites are essential for complex investigations of antigenic variation.
In accordance with previous studies of theyirgenes of P. yoelii [24], switching ofcirgene expression could be detected around peak parasitaemia in the course of infection suggesting that antigenic variation might be modulated by selective forces exercised by the host immune system. However, these transcriptional changes were not observed in all infected mice and, moreover, were not detectable to the same extent for all cir subfa-milies. Most marked differences in mRNA expression patterns could be observed for cir subfamily 1 whereas no or obviously less transcriptional switching was detected for cir subfamily 2 during the infection.
Completely different cir gene expression patterns of the progenies derived from 100 pRBCs starter popula-tions originating from the same parental population strongly suggest that a large parasite population can be extremely heterogeneous. In micromanipulated P. yoelii pRBCs, it has been shown that only one to three differ-entyirtranscripts were transcribed within an individual cell but many different transcripts were detected within a whole parasite population [25]. In addition, rapid switching in the transcribed repertoires of yir genes between different clonal host parasites populations and parasite developmental stages has been described. Although no infections with single pRBCs were per-formed in the present study, the initial diversity of para-sites was apparently kept at a minimum using the minimal infectious dose resulting in patent infections by intraperitoneal infection as revealed by the substantial differences in RT-PCR RFLP patterns between mice infected with 100 pRBCs. Therefore, the number of transcribedcirgenes per pRBC is presumably also much lower than that found to be transcribed in a large population.
Previous studies have analysed switching between dif-ferentyirgenes inP. yoeliiinfected mice both in immu-nocompetent [24] and highly immunodeficient [25] mice. Efficient and frequent switching of expressedyir genes could be observed even in the absence of any selecting force of an adaptive immune system [25]. The fact thatcirgene subfamily 1 and subfamily 2 expression patterns apparently do not necessarily change in the course of aP. chabaudiinfection in immunocompetent mice even within three weeks suggests lower on-off switching frequencies at least for these groups of cir genes. This is particularly surprising as adaptive immune responses are well known to effectively select for para-sites expressing new variant antigens in other protozoan parasites [61-63].
experimental hint corroborating the hypothesis that thosepir family members that evolved relatively recently might play a more prominent role for antigenic variation than those showing ancient properties [52]. Future work in both P. yoelii andP. chabaudishould, therefore, no longer neglect these unusualpirmembers from the ana-lyses but should pay special attention to them.
Analysis of changes incirgene expression patterns in the course of one asexual round of multiplication in 24 h revealed only minor changes in gene expression for subfamily 1 and virtually no changes for subfamily 2. In particular, no reduction in the complexity of the cir genes in late parasite stages was observed in comparison to early rings as has been described for vargenes [58]. Since Cunningham et al[25] found evidence that inP. yoeliieven schizonts transcribe at least up to three dif-ferentyirgenes, a mutually exclusive expression of pir genes in late individual parasites or parasite populations appears to be highly unlikely. The same was also shown for vir genes in P. vivax with more than one antigen expressed in a single parasite and different expression patterns between parasites [26]. Transcriptomic analysis ofP. vivaxintraerythrocytic developmental cycle stages also revealed that many vir genes are expressed early during the ring stage and turned off later while others are expressed predominantly in schizonts [64]. These authors could not find any linkage between the position of the virgene within the phylogenetic tree and its pre-dominant expression time. In contrast to these results, only minor changes during the intraerythrocytic cycle were found in the present study. Possible explanations for this discrepancy include the fact that of course the RFLP analysis is less sensitive with regard to the detec-tion of changes in expression of individual genes when compared to the microarray method used by Bozdechet al[64]. In addition, only for about 60% of the virgenes consistent temporal expression patterns could be observed for three different P. vivax isolates. If the highly expressed genes show no temporal expression pattern, such a pattern would clearly not be detectable with the RFLP method used here since it is not able to detect minor cir transcripts at all. Finally, the different experimental designs with only 100 pRBCs as founders in the cir gene study and non-selected parasites from naturally infected patients for theP. vivaxtranscriptome study might well contribute to the observed differences.
Remarkable differences in the mRNA expression pat-terns between pRBCs in blood, liver, spleen, kidney, lung and brain could be observed suggesting a host-tis-sue specific expression of cir genes. It is believed that the PIR proteins, like the Pfemp1 protein family in P. falciparum, are possibly involved in adhesion to host receptors thus mediating accumulation and sequestra-tion in different host tissues. For the BIR or YIR
proteins, for example, an expression of these molecules on the surface of pRBCs has already been demonstrated [24,27] but neither direct nor indirect evidence for a correlation of an adhesion of PIR proteins to host endothelial cells has yet been found. Accumulation of pRBCs in different tissues expressing differentcirgenes, however, can be considered to be a first experimental hint that CIR and maybe also other PIR proteins might indeed be involved in adhesion and sequestration. Whether rapid and dramatic changes in tissue distribu-tion of P. chabaudiparasites at peak parasitaemia, i.e. exclusion from the splenic red pulp [65], has effects on cirgene expression patterns would also be interesting to analyse in the future. SinceP. chabaudiis the only fre-quently used experimental malaria model with synchro-nous development and a strong sequestration phenotype, these results suggest that further studies of CIR proteins will provide important new insights into the interaction of non-P. falciparummalaria pRBC with host epithelia.
Conclusions
The present study has demonstrated for the first time that there are differences in the tissue-specific expres-sion of somecirgenes. These results suggest a possible correlation between the expression of CIR antigens and accumulation of parasites in inner organs of the host. The high agreement in results obtained for transcrip-tional switching and antigenic variation of thecirgenes with that for other members of the pirsuperfamily indi-cate very well that the cir genes are promising candi-dates for further functional studies. For example parasites expressing certain CIRs constitutively as trans-genes might improve understanding of the functional role of thepirsuperfamily in Plasmodiuminfections.
Additional material
Additional file 1: All annotated putative CIR proteins from PlasmoDB. This Excel file contains all 199 putative CIR proteins annotated in the PlasmoDB database (September 2011) including Gene ID numbers and several sequence details such as sequence sizes and protein motifs. The 13 partial CIR proteins excluded of the phylogenetic analysis are shaded in grey. For three proteins containing more than one CIR-BIR-YIR domain, only the complete domain was used. This is indicated by giving the position of this artificial truncation. un, unassigned; N/A, not available.
Additional file 2: Full-lengthcirgenes cloned from the non-clonalP.
chabaudiline. This Exel file contains the GenBank Accession numbers as
Additional file 3: Phylogenetic tree of 186 annotated CIR and selected YIR proteins in Newick format. This text file contains the phylogenetic maximum likelihood tree of the 186 annotated CIR and selected YIR proteins in Newick format including Gene ID numbers and maximum likelihood ratios as statistical support at the nodes.
Additional file 4: Splice variant ofcirgene found by RT-PCR and genomic PCR. The PDF file shows the alignment of twocirtranscripts amplified by RT-PCR with their corresponding genomic DNA sequence. The firstcirtranscript shows the commoncirgene structure with three exons. The secondcirtranscript, in contrast, represents a splice variant in which the usual start codon is eliminated resulting in an NH2-terminally
truncated protein. Start codons and stop codons are highlighted in green and red, respectively. The coding exons are colour shaded in blue and the primer sequences are highlighted in yellow.
Additional file 5: The amplified repertoire of cir cDNAs of the cloning study. In this Excel file all amplified cir cDNAs of the cloning study are given with their GenBank®® Accession numbers. The cir cDNAs are sorted according to their subgroups. The origin of sequences (host tissues) is highlighted by colours: Blood (red), liver (purple), spleen (blue), kidney (yellow) and brain (cyan).
Additional file 6: Phylogenetic relationship of protein sequences deduced from the cloning study with the PlasmoDB CIR domains. This PDF file shows the phylogenetic maximum likelihood tree of the 186 putative conserved domains of CIRs and the 190 deduced CIR protein sequences of the cloning and sequencing study. The cir subfamily 1 and subfamily 2 are highlighted in purple and cyan, respectively. The deduced CIR protein sequences of the cloning and sequencing study are highlighted with dots in the subfamily-specific colour.
Additional file 7: Newick format of the phylogenetic tree of cir subfamily 1. This text file contains the phylogenetic maximum likelihood tree of the deduced proteins from 216 cDNAs of cir subfamily 1 in Newick format. The individual names for each sequence are indicated.
Additional file 8: Newick format of the phylogenetic tree of cir subfamily 2. This text file contains the phylogenetic maximum likelihood tree of the deduced proteins from 216 cDNAs of cir subfamily 2 in Newick format. The individual names for each sequence are indicated.
[image:17.595.303.540.100.730.2]Additional file 9:In silicorestriction of the amplified cir cDNAs of the cloning study. The fragment sizes of the restricted cDNAs sequences of the cloning study,in silicodigested withAluI andXapI, were shown in this Excel file. In the first table sheet the restriction fragments of the cir cDNAs of subfamily 1 were listed, in the second table sheet of subfamily 2, respectively. The tissue origins of sequences are highlighted by colours: Blood (red), liver (purple), spleen (blue), kidney (yellow) and brain (cyan). The cir cDNA sequences are sorted according the subgroups.
Acknowledgements
This study was supported by a research grant from the Deutsche Forschungsgemeinschaft (DFG) (KR 2245/5-1). The authors thank Georg von Samson-Himmelstjerna and Janina Demeler for support and critical revision of the manuscript.
Authors’contributions
JK designed the study, planned and supervised all experiments. PE performed the experiments. JK and PE did bioinformatic and statistical analyses and wrote the manuscript. All authors read and approved the final version.
Competing interests
The authors declare that they have no competing interests.
Received: 14 June 2011 Accepted: 19 September 2011 Published: 19 September 2011
References
1. Brown KN, Brown IN:Immunity to malaria: antigenic variation in chronic
infections ofPlasmodium knowlesi.Nature1965,208:1286-1288.
2. McLean SA, Pearson CD, Phillips RS:Plasmodium chabaudi: antigenic
variation during recrudescent parasitaemias in mice.Exp Parasitol1982,
54:296-302.
3. Barnwell JW, Howard RJ, Miller LH:Altered expression ofPlasmodium
knowlesivariant antigen on the erythrocyte membrane in
splenectomized rhesus monkeys.J Immunol1982,128:224-226.
4. Mendis KN, Ihalamulla RI, David PH:Diversity ofPlasmodium vivax-induced
antigens on the surface of infected human erythrocytes.Am J Trop Med
Hyg1988,38:42-46.
5. Franke-Fayard B, Fonager J, Braks A, Khan SM, Janse CJ:Sequestration and tissue accumulation of human malaria parasites: can we learn anything
from rodent models of malaria?PLoS Pathog2010,6.
6. Miller LH, Baruch DI, Marsh K, Doumbo OK:The pathogenic basis of
malaria.Nature2002,415:673-679.
7. Mackintosh CL, Beeson JG, Marsh K:Clinical features and pathogenesis of
severe malaria.Trends Parasitol2004,20:597-603.
8. Rasti N, Wahlgren M, Chen Q:Molecular aspects of malaria pathogenesis.
FEMS Immunol Med Microbiol2004,41:9-26.
9. Su XZ, Heatwole VM, Wertheimer SP, Guinet F, Herrfeldt JA, Peterson DS, Ravetch JA, Wellems TE:The large diverse gene family var encodes proteins involved in cytoadherence and antigenic variation of
Plasmodium falciparum-infected erythrocytes.Cell1995,82:89-100.
10. Dzikowski R, Templeton TJ, Deitsch K:Variant antigen gene expression in
malaria.Cell Microbiol2006,8:1371-1381.
11. Deitsch KW, Calderwood MS, Wellems TE:Malaria. Cooperative silencing
elements invargenes.Nature2001,412:875-876.
12. Voss TS, Healer J, Marty AJ, Duffy MF, Thompson JK, Beeson JG, Reeder JC, Crabb BS, Cowman AF:Avargene promoter controls allelic exclusion of
virulence genes inPlasmodium falciparummalaria.Nature2006,
439:1004-1008.
13. Recker M, Buckee CO, Serazin A, Kyes S, Pinches R, Christodoulou Z, Springer AL, Gupta S, Newbold CI:Antigenic variation inPlasmodium
falciparummalaria involves a highly structured switching pattern.PLoS
Pathog2011,7:e1001306.
14. Deitsch KW, Moxon ER, Wellems TE:Shared themes of antigenic variation
and virulence in bacterial, protozoal, and fungal infections.Microbiol Mol
Biol Rev1997,61:281-293.
15. Fischer K, Chavchich M, Huestis R, Wilson DW, Kemp DJ, Saul A:Ten families of variant genes encoded in subtelomeric regions of multiple
chromosomes ofPlasmodium chabaudi, a malaria species that
undergoes antigenic variation in the laboratory mouse.Mol Microbiol
2003,48:1209-1223.
16. al-Khedery B, Barnwell JW, Galinski MR:Antigenic variation in malaria: a 3’
genomic alteration associated with the expression of aP. knowlesi
variant antigen.Mol Cell1999,3:131-141.
17. Carlton JM, Angiuoli SV, Suh BB, Kooij TW, Pertea M, Silva JC, Ermolaeva MD, Allen JE, Selengut JD, Koo HL, Peterson JD, Pop M, Kosack DS, Shumway MF, Bidwell SL, Shallom SJ, van Aken SE, Riedmuller SB, Feldblyum TV, Cho JK, Quackenbush J, Sedegah M, Shoaibi A, Cummings LM, Florens L, Yates JR, Raine JD, Sinden RE, Harris MA, Cunningham DA, Preiser PR, Bergman LW, Vaidya AB, van Lin LH, Janse CJ, Waters AP, Smith HO, White OR, Salzberg SL, Venter JC, Fraser CM, Hoffman SL, Gardner MJ, Carucci DJ:Genome sequence and comparative
analysis of the model rodent malaria parasitePlasmodium yoelii yoelii.
Nature2002,419:512-519.
18. Korir CC, Galinski MR:Proteomic studies ofPlasmodium knowlesiSICA
variant antigens demonstrate their relationship withP. falciparumEMP1.
Infect Genet Evol2006,6:75-79.
19. Bull PC, Buckee CO, Kyes S, Kortok MM, Thathy V, Guyah B, Stoute JA, Newbold CI, Marsh K:Plasmodium falciparumantigenic variation. Mapping mosaic var gene sequences onto a network of shared, highly
polymorphic sequence blocks.Mol Microbiol2008,68:1519-1534.
20. Janssen CS, Phillips RS, Turner CM, Barrett MP:Plasmodium interspersed
repeats: the major multigene superfamily of malaria parasites.Nucleic
Acids Res2004,32:5712-5720.
21. Cunningham D, Lawton J, Jarra W, Preiser P, Langhorne J:Thepir
multigene family ofPlasmodium: antigenic variation and beyond.Mol
![Figure 2 Phylogenetic tree of 186 annotated CIR and selected YIR proteinsputative CIR proteins and 14 different putative conserved domains of YIRs representing different YIR subfamily proteins were aligned usingClustalW2 [40] and a maximum likelihood tree](https://thumb-us.123doks.com/thumbv2/123dok_us/8329734.301401/5.595.60.538.256.633/phylogenetic-annotated-proteinsputative-representing-different-subfamily-usingclustalw-likelihood.webp)