Equine Obesity: Concepts
and Mechanisms
Thesis submitted in accordance with the
requirements of the University of Liverpool
for the degree of Doctor of Philosophy
by
Philippa Kate Morrison
i
Abstract
Equine Obesity: Concepts and Mechanisms. Philippa K Morrison
Obesity in the UK leisure population of horses and ponies is a growing problem with major welfare implications. To date, research into the associations between obesity and metabolic disease such as insulin dysregulation and laminitis remain ongoing. To improve our understanding of obesity in this species, the current thesis was designed to address several related objectives ranging from psychological aspects of obesity to the role of key determinants of energy balance in the setting of obesity.
Implementing dietary restriction to reverse obesity requires an owner to correctly recognise obesity in their animal, knowledge of which is lacking for the horse. A two-tier internet-based questionnaire was created and distributed through UK equine-based forums. Tier 1 utilised lateral photographic images of horses and ponies and demonstrated that only 11% of respondents (n = 546 total) correctly identified all overweight animals from a panel of 12 images. When assessing the suitability of horses and ponies for taking part in a range of activities, respondents considered it more appropriate for each animal to carry more weight/condition for competing in affiliated showing classes. Tier 2 (n = 177 responses) provided information regarding current management practices of horse-owners in the UK. The ability to quantify internal adiposity in live animals requires imaging technology which is not yet available for the horse. A semi-quantitative regional adipose-depot specific scoring system (EQUIFAT) was developed and tested. Associations between
ante-mortem body condition score (BCS) and post-mortem EQUIFAT scores (n = 207
animals) revealed that retroperitoneal EQUIFAT score had strong positive associations with BCS, whilst omental had weaker associations and mesenteric and epicardial scores had no associations with BCS, indicating clear functional differences between regional adipose depots in the horse.
Performing in-depth molecular biology studies using abattoir-derived samples requires knowledge of the time-frame of RNA degradation. RNA was found to remain intact up to 30 minutes and 2 hours post-mortem for adipose tissue and skeletal muscle ( n = 3 horses), respectively.
The expression of myostatin, a key regulator of skeletal muscle mass and energy balance was evaluated in lean and obese horses and ponies (n = 6/group). Myostatin gene expression was increased in skeletal muscle of obese animals, with no difference at the protein level. Circulating myostatin concentrations were increased in obese animals.
Adipocyte area was increased in adipose depots (retroperitoneal, omental, crest and tailhead) in obese animals, except for epicardial WAT. The expression of lipolytic proteins PLIN1 and HSL was reduced in retroperitoneal WAT of obese animals, with fewer differences noted between groups for other depots.
ii
Acknowledgements
First and foremost, I must thank Waltham for providing my stipend throughout my PhD studies at the University of Liverpool. Their continued financial support in this area of research has allowed us to further our understanding of equine obesity and associated conditions to ultimately improve the welfare of the horses and ponies under our care.
Secondly, this PhD would not have been possible if it wasn’t for the guidance and support of my team of supervisors. I feel very lucky to have had such a great team behind me. Firstly, to Professor Charlotte Maltin, for if it wasn’t for our chance meetings in the local Tesco car park back in Inverurie that sparked discussions about life after university, I would never have contemplated embarking on a 400 mile move to begin a PhD! So it is her I have to thank for giving me the push in the right direction and her continued enthusiasm and molecular biology wisdom throughout has proved invaluable. To Professor Patricia Harris, who has provided continued support and guidance throughout my studies. To Dr Chen Bing for her molecular biology expertise and for allowing me the use of her laboratory for performing my seemingly endless western blots! Dr Dai Grove-White for his statistical advice, patience, and introducing me to the wonderful world of STATA! Last but by no means least; my heartfelt thanks must go to Professor Caroline Argo, who has been a constant source of support and guidance throughout my PhD – from multiple lengthy trips to the abattoir, made slightly more bearable with a trip to the Wine and Sausage or Snugberrys afterwards (!), to helping me perfect conference presentations and publications. I am so grateful for her unfailing enthusiasm which has undoubtedly spurred me on when things weren’t going to plan.
I would also like to thank the technical support I received from Leif Hunter for his expert primer designing, Dr Dan Guo who got me started with my molecular biology work, Val Tilston for her help in performing numerous H&E stains, Jean Routly for helping me with my ELISA’s, and Michelle Mahoney for her help during a 3 month visit from the USA. Special thanks must also go to the teams at Turners and Potters abattoirs. I am very grateful for their generosity in allowing me to collect samples, as without which would have made this study impossible. To Clare Barfoot and Isabel Harker from Spillers, who helped and guided me in the development and distribution of the questionnaires. A big thanks must also go to Gemma Curtis, not only for her moral support during the PhD but also for her help and company on abattoir trips.
iii
mother who was responsible for buying me my first pony and getting me well and truly hooked on horses from a young age, for that I am eternally grateful.
Finally, I could not have done this without the constant support and encouragement I have received from my husband, Richard. Not only did he up sticks with me and move to the Wirral for me to embark on this PhD, he has helped me through the rollercoaster of emotions that this journey has been. I am incredibly grateful for him for all he has done and put up with and I have promised him that normality will resume and I will return to the cooking and cleaning once I have finished my thesis!
iv
Contents
Page number
Abstract i
Acknowledgements ii
Contents iv
List of Tables viii
List of Figures x
Chapter 1 General Introduction 1-42
1.1 Equine Obesity: Implications for welfare and management
2
1.2 Psychological basis for obesity 4
1.3 Measuring adiposity 7
1.4 Skeletal muscle: A key determinant of energy balance
10
1.5 A role for myostatin in obesity 13
1.6 Lipolysis in the regulation of energy balance 20
1.7 Lipolysis in obesity 24
1.8 References 29
Chapter 2 Thesis in context: Rationales, hypotheses, aims and
objectives
43-50
Chapter 3 Perceptions of obesity and management practices
in a UK leisure-based population of horse-owners and enthusiasts
51-80
3.1 Abstract 52
3.2 Introduction 53
v
3.4 Results 57
3.5 Discussion 72
3.6 Conclusion 77
3.7 References 78
Chapter 4 EQUIFAT: A novel scoring system for the
semi-quantitative evaluation of regional adipose tissues in Equidae
81-106
4.1 Abstract 82
4.2 Introduction 83
4.3 Materials and methods 84
4.4 Results 89
4.5 Discussion 99
4.6 Conclusion 103
4.7 References 104
Chapter 5 Post-mortem stability of RNA in skeletal
muscle and adipose tissue and the tissue-specific expression of myostatin, perilipin and associated factors in the horse
107-137
5.1 Abstract 108
5.2 Introduction 109
5.3 Materials and methods 111
5.4 Results 118
5.5 Discussion 125
5.6 Conclusion 131
5.7 References 132
Chapter 6 Preliminary investigation into a potential role
for myostatin and its receptor (ActRIIB) in lean and obese horses and ponies
vi
6.1 Abstract 139
6.2 Introduction 140
6.3 Materials and methods 142
6.4 Results 148
6.5 Discussion 155
6.6 Conclusion 158
6.7 References 159
Chapter 7 Expression of perilipin and hormone-sensitive
lipase in adipose tissues from lean and obese horses and ponies
163-198
7.1 Abstract 164
7.2 Introduction 165
7.3 Materials and methods 167
7.4 Results 174
7.5 Discussion 187
7.6 Conclusion 194
7.7 References 195
Chapter 8 General Discussion 199-224
8.1 Overview 200
8.2 Equine obesity: can we recognise it? 200
8.3 How important is regional adipose tissue distribution in Equidae?
204
8.4 Prerequisites to molecular biology investigations
207
8.5 A role for the myostatin system in equine obesity
209
8.6 Lipolytic proteins in equine obesity 212
vii
8.8 References 219
Appendix A The Kohnke body condition scoring system 225
Appendix B Questionnaire: Tier 1 227
Appendix C Questionnaire: Tier 2 233
Appendix D EQUIFAT scoring system 244
Appendix E Anatomical locations of skeletal muscles
sampled
247
viii
List of Tables
Table number
Title Page
number
1.1 Summary of key studies evaluating a role for myostatin in obesity
18
1.2 Summary of key PLIN1/HSL studies 27
3.`1 Respondent information for Tier 1 and Tier 2 58
3.2 Number and percentage of professional and non-professional respondents categorising the weight/condition of a Sport horse, pony and cob horse for each discipline
62
3.3 Horse/pony information gathered in Tier 2 65
3.4 Number and percentage of respondents ranking each
maintenance requirement in order of importance
69
4.1 Phenotypic characteristics of animals used to develop (n = 38) and describe associations between EQUIFAT scores and BCS (n = 207)
86
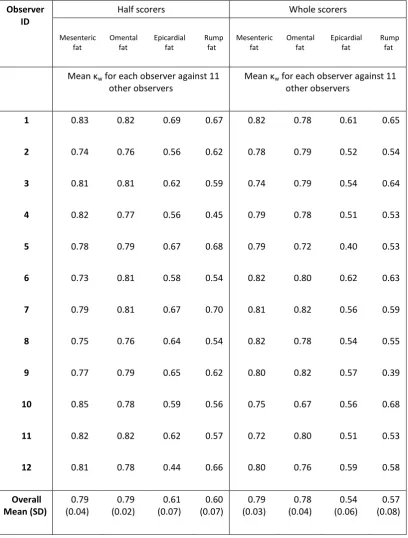
4.2A Intra-observer repeatability of EQUIFAT scores for 4
observers using half scores
92
4.2B Intra-observer repeatability of EQUIFAT scores for 4
observers using whole scores
93
4.3 Inter-observer agreement of EQUIFAT scores 94
4.4A Repeatability of individual EQUIFAT scores between
observers using half scores (n = 12)
95
4.4B Repeatability of individual EQUIFAT scores between
observers using whole scores (n = 12)
96
4.5 Multivariable, random effects linear regression model describing associations between EQUIFAT scores and BCS
98
5.1 Phenotypic descriptors for the 7 Thoroughbred horses
used in the current study
112
5.2 Specific anatomical descriptors of tissue sampling sites 114
ix
5.4 RNA quality assessment by spectrophotometer and 28S:18S ratio obtained from agarose gel electrophoresis (Study 1; n = 3)
120
5.5 Housekeeping gene comparison using GeNorm and Normfinder analysis
121
5.6 RNA quality assessment by spectrophotometer (Study 2; n = 4)
122
6.1 Phenotypic descriptors of animals used in the current study (n =12)
143
6.2 Specific anatomical descriptors of tissue sampling sites 144
6.3 Nucleotide sequences of primers and probes 146
6.4 Median and inter-quartile range (IQR) for myostatin and ActRIIB gene expression across 4 skeletal muscles from lean and obese horses and ponies (n = 6/group)
149
6.5 Median and inter-quartile range (IQR) for myostatin and ActRIIB gene expression across 5 white adipose tissue (WAT) depots from lean and obese horses and ponies (n = 6/group)
151
6.6 Univariate regression analysis for myostatin ELISA data 155
7.1 Phenotypic descriptors of animals used in the current study (n =12)
168
7.2 Specific anatomical descriptors of tissue sampling sites 169
7.3 Median and inter-quartile range (IQR) for adipocyte area and PLIN1 gene expression across 5 WAT depots from lean and obese horses and ponies (n = 6/group)
177
7.4 Protein extracted from internatant and fat cake adipose tissue fractions across 5 WAT depots from lean and obese horses and ponies
179
7.5 Median and inter-quartile range (IQR) for PLIN1 and HSL protein expression data across 5 WAT depots from lean and obese horses and ponies (n = 6/group)
185
x
List of Figures
Figure number
Title Page
Number
1.1 Extremes of body condition score (BCS) and cresty neck score (CNS)
9
1.2 Myostatin signalling pathway 15
1.3 An overview of lipolysis 23
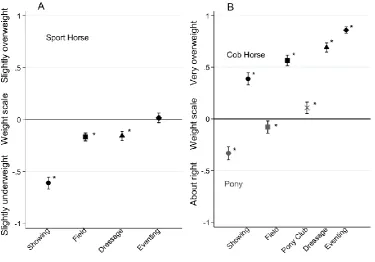
3.1 Ability of respondents to correctly identify overweight horses and ponies from photographic images
56
3.2 Agreement between expert and respondents in the weight suitability of horses and ponies taking part in a range of equestrian disciplines
63
3.3 Owner-reported BCS of their horse/pony 67
3.4 Owner-reported weight/condition of their horse/pony across seasons
68
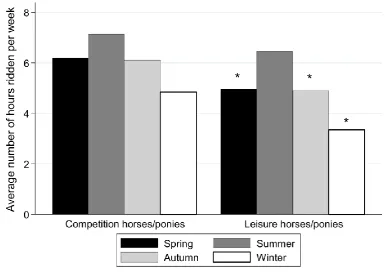
3.5 Owner-reported number of hours ridden per week across seasons
70
3.6 A Hunter horse from 1935 and one from 2008 73
4.1 Mesenteric EQUIFAT scoring system 87
4.2 Population distribution in test animals (n = 38) and the population in which they were nested (n = 207)
90
4.3 Distribution of physical attributes and EQUIFAT scores in population of animals (n = 207)
97
4.4 Marginal mean plots (95% CI) illustrating predicted changes in BCS with omental and retroperitoneal EQUIFAT scores
99
5.1 Gene expression of myostatin, ActRIIB, follistatin and PLIN1 across a range of equine tissues (n = 4)
124
5.2 Protein expression of PLIN1, ActRIIB, and myostatin precursor protein, across a range of equine tissues (n = 4)
125
6.1 Gene expression of myostatin and ActRIIB in skeletal muscles from lean and obese horses and ponies (n =
xi 6/group)
6.2 Gene expression of myostatin and ActRIIB in adipose tissues from lean and obese horses and ponies (n = 6/group)
150
6.3 Protein expression of myostatin precursor protein in skeletal muscles from lean and obese horses and ponies (n = 6/group)
152
6.4 Protein expression of ActRIIB in skeletal muscles from lean and obese horses and ponies (n = 6/group)
152
6.5 Protein expression of myostatin precursor and ActRIIB in crest white adipose tissue (WAT) from lean and obese horses and ponies (n = 6/group)
153
6.6 Circulating myostatin protein concentration in lean and obese horses and ponies (n = 6/group)
154
7.1 Loading variation of bovine serum albumin (BSA) assessed by MemCode total protein stain
173
7.2 MemCode total protein stain of internatant and fat cake fractions of equine adipose tissue
174
7.3 Adipocyte area measured in adipose tissues from lean and obese horses and ponies (n = 6/group)
176
7.4 Distribution of adipocyte area measured in adipose tissues from lean and obese horses and ponies (n = 6/group)
178
7.5 Associations between adipocyte area and lipid:protein ratios in lean and obese horses and ponies (n = 6/group)
180
7.6 Gene expression of PLIN1 in adipose tissues from lean and obese horses and ponies (n = 6/group)
181
7.7 Protein expression of PLIN1 and HSL in adipose tissues from lean and obese horses and ponies between internatant and fat cake fractions in (A) omental, (B) epicardial, (C) crest, (D) tailhead and (E) retroperitoneal adipose tissues.
182-184
7.8 Protein expression of PLIN1 and HSL in fat cake and internatant fractions between lean and obese horses and ponies (n = 6/group) in (A) omental, (B) epicardial, (C) crest, (D) tailhead and (E) retroperitoneal adipose tissues.
1
1 General Introduction
Chapter 1
2
1.1 Equine obesity: Implications for welfare and management
From the beginnings of equine domestication, horses and ponies have served Man
by fulfilling essential roles as food or working animals, employed in diverse
activities, including agriculture, mining, transport or warfare. Today, the UK
population of horses and ponies is estimated at ~944,000 animals (BETA National
Equestrian survey 2015). Recreational or leisure animals now account for ~60% of
the National equine herd, with leisure riding being reported as the most common
equestrian pursuit (Wyse et al., 2008; BETA National Equestrian survey 2015). This
relatively recent change of use has been accompanied by a significant decrease in
individual animal workloads but has also served to uncouple animal management
from traditional wisdoms in agriculture and nutrition. Not all of the welfare impacts
associated with this move have been beneficial.
Horses and ponies are long–lived and under natural conditions, oscillate
circannually from periods of positive to negative energy balance across successive
summers and winters (Fuller et al., 2001). The degree of negative energy balance
experienced during the predictable winter decrease in both grazing quality and
availability, in combination with increased rates of convective and conductive heat
loss, is naturally attenuated by photoperiodically entrained, seasonally-adaptive
physiological changes. These include a suppression of basal metabolic rate,
catabolism of stored body fats and both physical and behavioural mechanisms to
reduce heat loss across the body surface. By contrast, modern horse management
promotes the year-round maintenance of positive energy balance by ensuring the
availability of high quality forages and supplementary energy-dense feedstuffs,
shelter and artificial thermal insulation in the form of rugs. For many animals, these
factors have attenuated or abolished the natural winter check on body weight gain
and have enhanced the deposition of body fat during summers spent grazing on
cultured swards rich in non-structural carbohydrates (NSC’s, (Longland and Byrd,
2006). Paradoxically, these ‘improved’ husbandry standards commonly culminate in
the development of obesity with its attendant risks to health and performance
3
1 General Introduction
purposes, it could be considered that a ‘mismatch’ exists between their natural
biology and the manner in which we now elect to maintain them.
Epidemiological data continue to report a high prevalence of obesity in the leisure
populations of horses and ponies of industrialised nations (Harker et al., 2011;
Wyse et al., 2008). During the winter months, a time at which body condition score
(BCS) might be expected to be lower than during summer months obesity
prevalence in a population of leisure horses in the South West of England was
~27% and this increased to ~35% in summer (Giles et al., 2014). This study
reinforced earlier data which suggested that the natural,
photoperiodically-entrained suppression of appetite and metabolic rate in winter was insufficient to
prevent weight gain when mature ponies were housed and continued to receive ad
libitum access to moderate quality, fibre-based feedstuffs throughout winter
(Dugdale et al., 2011a). More recent owner-reported data suggested that the
obesity prevalence for animals used in pleasure riding, exceeded 30% (Robin et al.,
2015) and animals in this majority sector were identified as being more at risk of
being obese than animals used in competitive events.
Obesity increases the risk of horses and ponies developing conditions which are
deleterious to their health and performance. Most importantly in terms of
numbers, these conditions include insulin dysregulation and laminitis (Geor, 2008)
but obesity has also been associated with compromised internal organ function,
impairment of athletic and reproductive performance and some strangulating
forms of colic (Argo, 2009). The proportion of horses and ponies with a history of
laminitis has been reported by owners to be ~15% (Ireland et al., 2013; Wylie et al.,
2011). However, not all obese horses and ponies will develop laminitis and many
have normal insulin/carbohydrate dynamics. The precise mechanisms which link
insulin dysregulation, laminitis and obesity remain to be elucidated and it continues
to be an area for further research.
Currently, controlled weight loss management is the mainstay of therapies to
correct obesity and diminish the risk of obesity-associated disease. Strategies to
4
through exercise where possible. However, it is clear that rates of weight loss are
highly variable between animals even when dietary provision is robustly controlled.
This has been demonstrated in a group of 12 overweight horses and ponies, for
which daily dry matter (DM) intakes of forage were restricted to 1.25% body mass
for 16 weeks (Argo et al., 2012). Rates of weight loss varied considerably, to the
extent that the total weight lost by the most weight-loss sensitive animal was 3-fold
that of the most weight-loss resistant animal. Despite consideration of outset body
mass, BCS, body fat content and indices of insulin resistance, random effects linear
regression modelling indicated that 65% of the measured variation in weight-loss
responsiveness could be attributed to individual animal identity. Whilst weight-loss
management is crucial in improving the welfare of obese animals, the initiation of
weight-loss first requires that owners are able to recognise obesity in their animal.
1.2 Psychological basis for obesity
The psychology of obesity development has become a major research focus in
humans (Karasu, 2012). Understanding the mental processes which promote
obesity development is important to direct appropriate education and corrective
advice if this rise in obesity prevalence, both in humans and their companion
animals is to be reversed. Evidence suggests that there is a common misperception
of body weight both among adults (Johnson et al., 2014; Wetmore and Mokdad,
2012) and among parents in the estimation of their child’s weight status (Carnell et
al., 2005; Jones et al., 2011). It is of concern that in the UK, only a quarter of
parents correctly identified their child as being overweight; the same proportion of
parents were reported to be only “a little worried” if their child was overweight
(Jeffery et al., 2004). This latter finding was perhaps predictable, since parents not
only had a poor perception of their child’s weight but they also showed an inability
to identify their own overweight state (Jeffery et al., 2004). However, it is the
responsibility of parents to try and ensure their child remains at a healthy weight as
childhood obesity increases the risk of developing obesity and associated
5
1 General Introduction
As alluded to earlier, the recognition of obesity is a crucial prerequisite for
implementing corrective weight-loss programmes. A more accurate perception of
body weight status has been associated with weight-loss attempts (Bittner Fagan et
al., 2008; Duncan et al., 2011). The social influence on obesity has also been studied
extensively. It was of interest that people who had an obese friend, had an 57%
increased likelihood of becoming obese themselves, Similarly, among siblings and
spouses, the likelihood of obesity was increased by ~40% if the other became obese
(Christakis and Fowler, 2007). More recently, the impact of social influence was
evaluated in terms of weight loss intention. This study identified that among
overweight and obese young adults, having more social contact with individuals
who were also actively trying to lose weight increased the intention to lose weight
(Leahey et al., 2011).
The likeliness of underestimating weight status was increased in children and
youths who had school friends and parents with a high body mass index (BMI)
(Maximova et al., 2008). This would indicate that exposure to an environment with
obese individuals will influence weight perception. In agreement with this, there is
evidence to suggest that the increased exposure to obese body shapes which faces
us in today’s obese society, has led to an upward shift in what is considered
‘normal’ in terms of body weight (Burke et al., 2010). Furthermore, a generational
shift in parents perceptions of their child’s weight has also been documented
recently, with overweight/obese children being less likely to be perceived as
overweight in a study conducted between 2005-2010 compared to one conducted
between 1988-1994 (Hansen et al., 2014).
An inability to accurately perceive our own weight has obvious implications for the
animals in our care. Indeed, a discrepancy between owner and veterinarian
assessment of BCS has been established for both dogs (Colliard et al., 2006) and
cats (Colliard et al., 2009). More recently, 44.1% of dog owners (Courcier et al.,
2011), and 45.8% of cat owners (Courcier et al., 2010) were found to incorrectly
assess their pets body shape, with underestimation being the most common form
6
remain - even with the use of a body condition scoring chart (Eastland-Jones et al.,
2014). Owners of obese dogs have been found to have less interest in their dogs
nutrition and exercise needs compared with owners of non-obese dogs (Kienzle et
al., 1998), whilst owners of overweight cats tended to treat their cat more like a
human in terms of their feeding habits (Kienzle and Bergler, 2006).
With regard to horses, only a few studies have been conducted to assess owner’s
perceptions of obesity. In the UK, only a fair agreement was found between horse
owner and expert assessment of BCS (Wyse et al., 2008), whilst more recently, poor
agreement was noted between the BCS assigned by the horse owner and that
assigned by the researcher (Stephenson et al., 2011).
In combination, these studies suggest that improving our understanding of some
psychological aspects to obesity development in the horse would enable more
tailored nutritional and management advice to be distributed to horse owners in an
attempt to diminish obesity in our leisure population of horses and ponies.
It is worthy of consideration that in evolutionary terms, the ability to store excess
energy efficiently during times of plenty was required for survival during periods of
famine (the ‘thrifty gene’ hypothesis) (Hales and Barker, 2001). However, the
so-called ‘thrifty genes’ are disadvantageous in today’s in modern society with its
sedentary lifestyles and ready access to energy-dense diets. The ‘thrifty gene’
hypothesis has been implicated in the widespread development of obesity and
diabetes in man, and may play a similarly deleterious role for our companion
species. Our ability to further understand the links between obesity and metabolic
conditions requires that we first accurately quantify and measure adiposity. For the
horse, our ability to quantify body fat is somewhat limited by their large body size.
Currently, the definition of obesity in the horse is based on the subjective
evaluation of BCS. Consequently, in addition to evaluating perceptions of obesity,
an improved knowledge of equine adiposity is central to furthering our
7
1 General Introduction
1.3 Measuring adiposity
Whilst it is evident that excessive adiposity can impair health in both humans and
animals, understanding associations between obesity and disease risk relies on our
ability to quantify adiposity. For humans, measurement of BMI provides a useful
indication of weight status, and clear associations have been made between
BMI-defined obesity and mortality rates. However, BMI has clear limitations; perhaps
most notably, it cannot distinguish between lean mass and adipose tissue.
Furthermore, the ability of BMI to diagnose obesity as determined by body fat
percentage is most markedly limited for individuals in the intermediate BMI ranges
(Romero-Corral et al., 2008). Additional anthropometric measurements of central
obesity such as waist circumference and waist/hip ratio, both used as an index of
the accumulation of abdominal fat, have been found to be useful in defining
associations between adiposity and metabolic disease risk (Goh et al., 2014; Pouliot
et al., 1994; Wei et al., 1997). Nevertheless, whilst these straightforward
measurements remain useful and are easy to apply in large population studies,
accurate quantification of regional adiposity in subcutaneous and visceral
compartments can only be obtained from whole-body imaging modalities such as
computed tomography (CT) and magnetic resonance imaging (MRI).
For Equidae, due to their large body size, the use of sophisticated whole body
imaging techniques (e.g. CT, MRI, and DEXA) is precluded at present and
measurements of body adiposity are generally restricted to subjective
measurements. Several different body condition scoring systems exist and are
variously employed by equine researchers. However all systems employ the same
basic principles which include the visual and palpable appraisal of superficial body
fat cover at specific anatomical locations. The most commonly used equine BCS
system is based on a 1-9 scale (where 1 = emaciated and 9 = obese). This system
was initially developed specifically to evaluate the body condition of Quarter horse
mares but its use has been systematically extended to assess adiposity across
horses and ponies of diverse breeds and gender (Henneke et al., 1983). Currently,
8
our group. It involves the visual and palpable assessment of six body areas including
neck, withers, shoulder, ribs, loin and tailhead, assigning a number from 1-9 for
each area (Appendix A). The average of these six numbers equates to the overall
BCS for that animal. Although BCS system is a subjective measure of adiposity, it
has proved to be a useful tool for indicating adiposity in horses and ponies (Dugdale
et al., 2012). Despite this, it has been found to be unreliable in monitoring early
weight loss through dietary restriction in ponies, whereby ~6% loss in body mass
(BM), accompanied by improvements in hyperinsulinemia did not result in
alterations in BCS (Dugdale et al., 2010). The addition of objective, morphometric
measurements such as body circumference (belly girth) may provide useful
indications of changes in internal adipose tissues (visceral/retroperitoneal) during
weight loss.
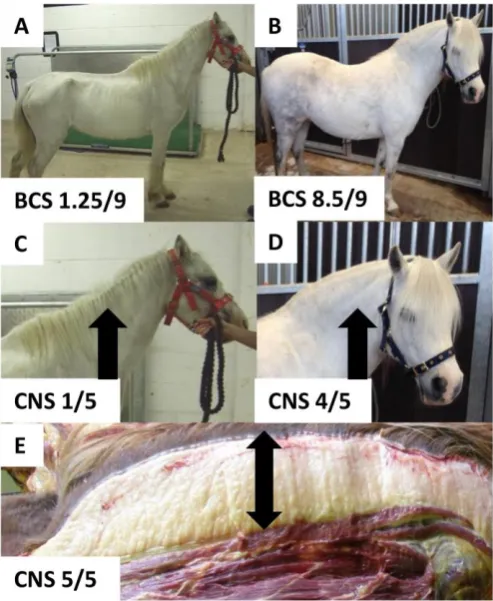
The assessment of fat stored within the nuchal crest (Figure 1.1) of the neck may be
one of the most visually obvious fat depots in the horse and mean neck
circumference has been associated with the magnitude of insulin resistance in
horses (Frank et al., 2006). The Cresty Neck Score (CNS) was developed by Carter et
al. (Carter et al., 2009a), and a score of ≥4/5 has been associated, along with other
variables, with an increased risk of laminitis (Carter et al., 2009b). However, no
difference in neck crest height or thickness was noted between laminitis-prone and
control ponies with similar BCS (Bailey et al., 2008), indicating increased fat
deposition in the neck region may only be relevant when more generalised obesity
is also present. Furthermore, measurements of neck circumference were not found
to be useful indicators of early weight loss in a group of native pony mares (Dugdale
et al., 2010). Moreover, the precise mechanisms linking crest fat with metabolic
9
1 General Introduction
Figure 1.1: Images depicting the range in body condition score (BCS; A and B) and associated cresty neck score (CNS; C and D) in two Welsh Mountain pony mares. For context, a sagittal section through the nuchal crest of a Welsh Mountain pony mare of BCS 8.5/9 (E) is represented to indicate the scale of this regional adipose depot.
The validation of the deuterium oxide (D2O) dilution technique for the
determination of total body fat in horses and ponies has proved to be a useful
research tool (Dugdale et al., 2011c). However, application of this method to
describe associations between total body fat and BCS in a large group of horses and
ponies identified a non-linear relationship between the two variables (Dugdale et
al., 2012). Indeed, BCS became less reliable in estimating the body fat content of
obese animals (>6.8/9), and suggests that whilst BCS is usefully accurate in
estimating the body fat content of non-obese animals, it cannot predict body fat
content of obese animals.
Recently, a method for estimating body fat content of horses and ponies based on
objective, morphometric measurements (heart girth, belly girth, neck
circumference and height) has been proposed and was found to have similar
correlations to total body fat content (measured by deuterium oxide dilution) as
evaluation of BCS, and this may provide a more objective tool for estimating body
[image:21.595.115.362.73.374.2]10
The most obvious problem with current measures of adiposity in horses and ponies
is the inability to discriminate between regional adipose tissue depots. The
contribution of visceral (omental/mesenteric) fat to the metabolic phenotype has
been well characterised in humans (Fontana et al., 2007; Nakamura et al., 1994),
however the precise contribution of regional adipose depots to insulin
dysregulation and laminitis in the horse remains unclear. Until we have the ability
to quantify regional adiposity in large animals in vivo, further work is required to
establish how regional adipose tissue depots are altered in obesity.
The long-term regulation of body weight is under the control of several crucial
adiposity signals that circulate in proportion to adipose tissue mass and interact
with satiety signals in the brain. Perhaps the best characterised of these signals in
humans are insulin and leptin (Baskin et al., 1999; Havel et al., 1996; Yannakoulia et
al., 2003), both capable of modulating the response of the brain to satiety signals
(Woods and D'Alessio, 2008). Furthermore, leptin has been already been associated
with body fat mass in the horse (Kearns et al., 2006). For the current thesis, the
molecular focus was centred upon other key pathways involved in energy
homeostasis that have been implicated in states of energy imbalance in humans but
have not yet been investigated in the horse. To this end, whilst adipose tissue
undoubtedly plays a major role in adipose tissue dysfunction in obesity, the amount
of excess energy available to deposit as fat is dependent on whole body energy
requirements. As the major determinant of whole body resting energy expenditure
and comprising around 40% of body mass (Dugdale et al., 2011b; Webb and
Weaver, 1979; Zurlo et al., 1990), skeletal muscle has a considerable role to play in
obesity development (Houmard et al., 2011; Maltin, 2008).
1.4 Skeletal muscle: A key determinant of energy balance
For Equidae, the wide range in body conformation, including the shape and size of
muscle mass evident between breeds of horses and ponies, is likely to reflect a
11
1 General Introduction
domestic selection to fulfil diverse athletic or aesthetic roles. This diversity of
selective pressures could be expected to result in wide variations in muscle mass
and fibre composition between and within the breeds. Thoroughbred horses
selectively bred for speed and endurance will have increased proportions of their
body mass as skeletal muscle when compared to other breeds of horse (Gunn,
1987). Similarly, having increased proportions of the body as fat-free mass was
beneficial to exercise performance in both Standardbred horses (Kearns et al.,
2002) and humans (Slater et al., 2005; Stöggl et al., 2010). By contrast, it could be
suggested that mountain and moorland breeds of horses and ponies (Welsh
Mountain, Highland, Shetland, Exmoor, Dartmoor etc.) have a greater proportion of
adipose tissue to aid survival in their naturally challenging habitats. Taken together,
alterations in skeletal muscle metabolism and / or between-animal differences in
the mass, efficiency and composition of skeletal muscle, would be important in
determining energy balance and by inference, in dictating the amount of excess
energy available for storage in adipose tissue.
Skeletal muscle is comprised of distinct muscle fibre types. Muscle fibres are
classified according to their contraction speed and oxidative capacity. Type I or
slow-twitch fibres are oxidative and highly fatigue resistant. Type II muscles fibres
are further distinguished into Type IIA fibres, which are fast-twitch, oxidative fibres
and show a moderate resistance to fatigue, and Type IIB/X fibres which are
fast-twitch fibres that largely rely on glycolytic metabolism to generate energy and are
rapidly fatigued. Interestingly in Man, relative proportions of skeletal muscle fibre
types have been associated with the propensity for obese subjects to lose weight.
Human subjects who were sensitive to weight-loss through dietary restriction alone
had a higher proportion of Type I fibres in the vastus lateralis muscle and a
corresponding up-regulation of genes associated with oxidative phosphorylation in
comparison to subjects who proved resistant to weight loss (Gerrits et al., 2010).
The development of skeletal muscle fibres occurs during the early stages of
myogenesis and motor nerve stimulation controls the activity of diverse sets of
12
1997; Wu et al., 2000). Fibre type composition of skeletal muscle differs between
individuals and this can be partially attributed to genetic factors. The heritability of
Type I fibre proportions is estimated to be around 45% in humans (Simoneau and
Bouchard, 1995) and in horses; the heritability of Type I fibres is greater than for
Type IIA and Type IIX fibres (Rivero and Barrey, 2001). However, skeletal muscle
demonstrates post-natal plasticity. Subtle alterations in the relative proportions of
fibre types may occur throughout adult life as a result of the modifying effects of
disease (Gosker et al., 2002) and exercise training in both humans (Aagaard et al.,
2011; Coggan et al., 1992) and horses (Kim et al., 2005; Serrano et al., 2000).
However, there are challenges associated with measuring fibre type in large
animals such as equines due to the considerable variability of fibre types distributed
both between and within individual muscles. It has been demonstrated that within
the gluteus medius muscle of the horse, a lower percentage of type I fibres were
identified at the superficial region of the muscle compared to the deeper region,
highlighting the necessity to be accurate and consistent when sampling skeletal
muscle for fibre typing (López-Rivero et al., 1992). Therefore, although fibre type
proportions are clearly of importance, it is inappropriate to attempt to study fibre
type proportions via use of muscle biopsy or other sampling techniques unless the
precise anatomical location of the sample sites is possible.
The relative proportions of different fibre types in human skeletal muscle have also
been associated with obesity. The proportion of Type I muscle fibres was inversely
related to both body fat content (Helge et al., 1999; Wade et al., 1990) and body
mass index (BMI) (Hickey et al., 1995). These findings are supported by the later
observation that obese subjects had significantly lower proportions of Type I
muscles fibres when compared to lean subjects (Tanner et al., 2002). Further, in a
19 year follow-up study, subjects with relatively lower proportions of Type I fibres
had increased weight gains, increased body fat percentages and higher BMI’s
relative to people who had greater proportions of Type I fibres (Karjalainen et al.,
2006). This decreased contribution of the highly oxidative Type I fibres in the
metabolically dominant skeletal muscle mass of obese phenotypes, may offer an
13
1 General Introduction
decreased in obese subjects (Kelley et al., 1999; Kim et al., 2000).
Skeletal muscle also plays a major role in glucose uptake, with 80% of postprandial
glucose disposal occurring in this tissue alone (Blaak, 2005). To this end, alterations
in skeletal muscle insulin-mediated glucose uptake have been extensively studied in
the context of insulin resistance in humans (Goodpaster et al., 2014; Sylow et al.,
2014), and in horses (de Laat et al., 2015; Waller et al., 2011).
As discussed, alterations in skeletal muscle mass and efficiency have clear
implications on whole body energy balance. With this in mind, key regulators of
skeletal muscle mass have received significant attention as potential therapeutic
targets for the treatment of obesity and insulin resistance. One such protein is
Myostatin, a myokine secreted from skeletal muscle. Whilst perhaps it is better
known as a negative regulator of skeletal muscle mass, it has also been clearly
implicated in the regulation of whole body metabolism in the development of
obesity.
1.5 A potential role for myostatin in equine obesity
Myostatin (also known as growth differentiation factor-8, GDF-8), is a member of
the transforming growth factor β family, a group of secreted growth factors which
regulate body tissue growth and differentiation (McPherron et al., 1997). Since its
discovery, myostatin has been well characterised as a potent negative-regulator of
skeletal muscle mass (Joulia et al., 2003; Whittemore et al., 2003). Whilst myostatin
expression may be largely genetically determined, expression levels can be
modulated by both strength and endurance training in humans (Hittel et al., 2010;
Hulmi et al., 2007). Natural mutations in the myostatin gene rendering it
non-functional have resulted in the ‘double muscling’ phenotype observed in certain
breeds of cattle (Grobet et al., 1997). Furthermore, single nucleotide
polymorphisms (SNPs) in the myostatin gene have been identified and associated
with optimal race distance in Thoroughbred horses (Hill et al., 2010) and between
14
2010). In addition to this, a promoter variant and intronic SNP of the myostatin
gene were each significantly associated with greater proportions of Type IIB and
lower proportions of Type I skeletal muscle fibre proportions in Quarter horses
(Petersen et al., 2013). Whilst it is not known whether these genetic variants result
in direct changes in myostatin expression, the magnitude of myostatin expression
has been shown to be significantly greater in murine muscles largely composed of
fast twitch fibres compared to those predominantly slow twitch muscles (Kawada et
al., 2001). Cloning and sequencing the equine myostatin gene revealed a high
degree of homology with other species, including that of bovine, mouse and human
(Hosoyama et al., 2002).
Myostatin is synthesised as a 376 amino acid precursor protein, which is
subsequently cleaved twice to reveal the active form of the protein. The first
cleavage removes the signal peptide from the precursor protein to leave the
N-terminal propeptide domain and the C-N-terminal domain. The final cleavage
produces the N-terminal propeptide domain (myostatin propeptide) and mature
myostatin, comprised of a disulphide-linked dimer of C-terminal domain (Huang et
al., 2011). Mature myostatin is bound noncovalently to its propeptide and
circulates in serum as an inactive complex (Hill et al., 2002). Members of the bone
morphogenetic protein-1/tolloid (BMP-1/TLD) family of metalloproteinases have
been implicated in the activation of myostatin in vivo (Wolfman et al., 2003). Upon
activation, myostatin binds selectively to the activin type II receptor kinase
(ActRIIB), causing phosphorylation of the type I receptor, ALK5. Initiation of an
intracellular signalling cascade follows, involving both SMAD and non-SMAD related
pathways (Figure 1.2) allowing myostatin to regulate the expression of several
15
1 General Introduction
Figure 1.2: An overview of the myostatin signalling pathway. Abbreviations: IGF-1 insulin-like growth factor 1, IGFR insulin-like growth factor 1 receptor, P13K phosphoinositide 3-kinase, AKT/PKB protein kinase B, FoxO forkhead box O, mTOR mechanistic target of rapamycin, mTORC1/C2 mechanistic target of rapamycin complex 1/2, p70s6k ribosomal p-70-s6 kinase, MURF-1 muscle ring-finger protein-1, SMAD cytoplasmic signalling molecules,
ActRIB/ActRIIB activin type I/2 receptor kinase, MEK1/MAP2K1 mitogen-activated protein 2
kinase, ERK1/2 extracellular signal-related kinase 1/2, TAK-1 transforming growth factor beta-activated kinase 1, MKK4/6 MAP kinase kinase 4/6, p38 MAPK p38 mitogen-activated protein kinase, JNK c-JUN N-terminal kinase.
Early studies demonstrated that despite having similar planes of food intake in
relation to body mass, myostatin knock-out (KO) mice possessed significant
increases in muscle mass in comparison to their wild-type littermates, and they
were also found to have significantly decreased fat accumulation (70% reduction in
mean total body fat mass) (McPherron and Lee, 2002). Whilst it could be suggested
that the absence of myostatin from birth reduced the capacity for adipose tissue
accrual during development, myostatin KO mice challenged with a high-fat diet also
demonstrate significantly decreased gains in body fat compared to wild-type mice
[image:27.595.117.514.79.365.2]16
investigating the role of myostatin in obesity is summarised for clarity in Table 1.1.
In addition to a lack of body fat, loss of myostatin function in mice has also been
found to confer additional metabolic benefits by improving insulin sensitivities
(Choi et al., 2011; Guo et al., 2009). This may be unsurprising since, as discussed
earlier, the majority of glucose uptake occurs in skeletal muscle, therefore it is
biological probable that increased skeletal muscle mass would result in
improvements in glucose metabolism and insulin dynamics over that observed in
obesity. Conversely, a lack of adipose tissue might be protective against insulin
resistance through a reduction in the secretion of pro-inflammatory cytokines that
have been linked to the development of insulin resistance in other species (Gregor
and Hotamisligil, 2011). In agreement with this, loss of function in myostatin in
mice, resulting in a protection against whole-body insulin resistance is considered
to be due to reductions in plasma tumor necrosis factor-α (TNF- α) levels (Wilkes et
al., 2009). Furthermore, improvements in insulin sensitivity through a lack of
myostatin signalling is associated with up-regulation of the AMP-activated protein
kinase (AMPK) signalling pathway in myostatin-null mice (Zhang et al., 2011), whilst
circulating myostatin in plasma has been shown to have an inverse relationship
with insulin sensitivity in human subjects (Hittel et al., 2010). In this context,
myostatin has been suggested as a biomarker of insulin sensitivity and insulin
resistance in a recent review (Park et al., 2015).
More recent studies have investigated the degree by which blocking myostatin
function can reduce fat mass gain in mature mice fed high fat diets. Blocking the
action of myostatin in mature mice in combination with high fat feeding for 22
weeks resulted in these mice gaining only half the weight of control mice during the
first 8 weeks, after which time the rate of weight gain was similar (Burgess et al.,
2011). Overall, cumulative weight gain remained significantly lower for myostatin
deficient mice, despite increased gains in lean body mass combined with similar
gains in intra-abdominal adipose tissue. However, as only intra-abdominal adipose
tissue was evaluated, it could be suggested that other adipose depots were
correspondingly reduced to account for the cumulative reduced weight loss.
17
1 General Introduction
depleted mice and control mice fed a high fat diet (McPherron et al., 2012).
However, mature, myostatin depleted mice in the latter study had significantly
greater gains in lean body mass, accounting for increased body weights of these
mice from weeks 8-12 of the 12 weeks high-fat feeding. This is in contrast to the
decreased cumulative weight gain reported in the former study and may be due to
different study designs as the mice used in the latter study were already obese
prior to blocking myostatin function. Taken together, this could suggest that
blocking myostatin function may be ineffective in reducing body fat content in mice
that are already obese, however it is generally accepted that blocking myostatin
function in mature normal weight mice does confer protection against diet-induced
obesity (Akpan et al., 2009; Zhang et al., 2012).
Attempts have been made to account for the reasoning behind the resistance to
diet-induced obesity in myostatin deficient mice. It has been suggested that
absence of myostatin indirectly reduces the build-up of fat due to the increased
energy requirements brought about by the relatively greater muscle mass in these
mice, in turn reducing the amount of excess energy available to deposit as fat
(LeBrasseur, 2012). However, myostatin can be detected at low levels in adipose
tissue and a direct association between myostatin and adipose tissue has been
demonstrated, whereby myostatin treatment inhibits pre-adipocyte differentiation
in vitro (Guo et al., 2008; Hirai et al., 2007; Kim et al., 2001). Interestingly, in
addition to protecting against diet-induced obesity, inactivation of myostatin was
found to result in an up-regulation of genes involved in lipolysis and fatty acid
oxidation, in combination with enhancing brown adipose tissue formation in white
adipose tissue (Zhang et al., 2012). This finding generated considerable interest
after the discovery of functional brown fat in adult humans (Cypess et al., 2009) led
to the theory that formation of brown fat could provide a therapeutic treatment for
obesity. Recently, myostatin has been found to inhibit the differentiation of brown
fat by inhibiting the expression of key brown fat genes including uncoupling
protein-1 UCP1) and PRDM16 (Braga et al., 2013), whilst myostatin KO in mice
induces the browning of WAT in mice through activation of the
18
Table 1.1: A summary of the key studies involving myostatin and obesity. Abbreviations: SNP single nucleotide polymorphism, MSTN Myostatin, KO knock-out, BM body mass, LBM lean body mass, BMI body mass index, HFD high fat diet, WT wild type, VLvastus lateralis,
RArectus abdominis, SC subcutaneous, TAtibialis anterior
STUDY MAJOR FINDINGS AUTHOR
H
UM
A
N
MSTN secretion and expression increased in skeletal muscle cells derived from extremely obese relative to lean healthy human subjects and positively correlated to severity of insulin resistance.
Hittel et al. (2009)
MSTN expression decreased in quadriceps muscles around 18 months following biliopancreatic division.
Milan et al. (2004) SNP (rs3791783). AA genotype linked with increased
susceptibility to obesity in a population of Chinese North Han people.
Pan et al. (2012)
MSTN gene expression decreased around 1 year following gastric bypass surgery in VL muscle and increased expression of MSTN associated with obesity in RA muscle of cross-sectional group (lean vs. morbidly obese).
Park et al. (2006)
SNP’s associated with obesity, abdominal obesity and low LBM in population of non-diabetic Asian Indians in North India. Subjects with Thr/Thr genotype of A55T polymorphism high risk for high % body fat, truncal subcutaneous adiposity and low LBM. Subjects with R/R genotype of K153R polymorphism high risk for obesity, abdominal obesity and low LBM.
Bhatt et al. (2012)
Serum MSTN increased in diabetic compared to non-diabetics and serum MSTN decreased with increasing components of metabolic syndrome
Han et al. (2014)
Serum MSTN increased in overweight patients compared to normal weight controls and was positively correlated with BMI
Zhu et al. (2014)
OB
ES
E
M
ICE
MSTN gene expression increased in SC and visceral fat and TA muscle in obese mice vs. WT mice. In response to 1 month HFD (60% kcal fat), MSTN gene expression increased in TA muscle.
Allen et al. (2008)
M STN K O M ICE N O HF D
At 6-8 wks age, MSTN KO mice had increased energy expenditure, decreased total body fat mass and decreased % fat mass compared to WT mice.
Choi et al. (2011)
12 wk old MSTN KO mice decreased retroperitoneal, epididymal, parametrial & inguinal fat pad weights vs. WT mice.
Lin et al. (2002)
KO mice found to have 70% less body fat vs. WT mice McPherron & Lee (2002) M STN K O M ICE + HF D
Diet = 60% kcal fat for 4 weeks. Decreased body fat content in MSTN KO mice: decreased weights of gonadal & retroperitoneal fat pads. Incorporation of MSTN mutation with mice with genetic obesity (leptin db/db) did not alter obese state.
Dilger et al. (2010)
Diet = 45% kcal fat for 10 weeks. MSTN KO HFD mice gained less weight than WT HFD mice. Improved insulin sensitivity in
[image:30.595.111.534.140.731.2]19
1 General Introduction
KO HFD mice. Blocking MSTN function specifically in adipose tissue resulted in no effect on body composition or weight gain on standard or HFD. Blocking MSTN function specifically in skeletal muscle resulted in increased lean mass & decreased fat mass on standard and HFD.
Diet = 45% kcal fat for 8 weeks. Fat mass and % body fat decreased in KO mice vs. WT HFD mice.
Hamrick et al.
(2006) PO ST -D EVE LOP M EN TA L M ST N INHI B ITI ON + H FD
Diet = 45% kcal fat for 10 weeks. 4 weeks treatment to block MSTN in combination with HFD resulted in BM and lean mass increased in mature MSTN null mice vs. vehicle treated mice. 10 week treatment in combination with HFD resulted in increased lean mass and decreased fat mass in mature MSTN null mice vs. vehicle treated mice.
Akpan et al. (2009)
Diet = 60% kcal fat for 22 weeks. Decreased cumulative weight gain in mature MSTN KO mice vs. control HFD mice. No difference in epididymal and retroperitoneal fat pad weights.
Burgess et al.
(2011) Diet = 60% kcal fat 12 weeks prior to MSTN inhibition
treatment then further 12 weeks on HFD in combination with treatment. No difference in fat gain vs. vehicle treated mice. Increased gains in lean mass vs. vehicle treated mice 4-12 weeks after MSTN function blocked.
McPherron et al.
(2012) M STN K O M ICE + H FD PO ST -D EVE LOP M EN TA L M ST N INHI B ITO N + HF D
Diet = 45% kcal fat for 12 weeks. MSTN KO mice on HFD increased energy intake but BW similar to KO mice on chow diet. Up-regulation of genes associated with fatty acid oxidation and lipolysis in MSTN KO mice in peripheral tissues, along with up-regulation of uncoupling protein 1, 2, & 3 and other genes involved in BAT specification and thermogenesis in WAT.
Post-developmental blocking of MSTN in combination with HFD resulted in lesser gains in WAT mass vs. vehicle treated HFD mice & resulted in similar gene expression profile to MSTN KO mice + HFD.
Zhang et al. (2012)
With regards to obesity in humans, myostatin gene expression was found to be
significantly reduced in skeletal muscle in women following weight loss induced by
gastric bypass surgery (Park et al., 2006) and biliopancreatic division (Milan et al.,
2004). Furthermore, extremely obese women were found to have a significantly
increased secretion and expression of myostatin in skeletal muscle samples which
was positively correlated to the severity of insulin resistance (Hittel et al., 2009).
This finding fits into the association between skeletal muscle fibre type, myostatin
expression and obesity as myostatin expression is greater in Type II fibres, whilst
reduced proportions of Type I fibres predisposes to obesity. It could therefore be
suggested that the increased expression of myostatin in obese humans is due to
20
concentrations have been identified in overweight human subjects (Zhu et al.,
2014). Conversely, serum myostatin levels were found to be reduced in individuals
with the metabolic syndrome (Han et al., 2014). Differences in the method for
measuring myostatin may attribute the differing results, as different ELISA kits were
used to measure circulating myostatin levels, with the latter study measuring full
length myostatin peptide. Furthermore, a SNP in the human myostatin gene has
been recently linked with increased susceptibility to obesity in a group of Chinese
North Han subjects (Pan et al., 2012), and two further SNPs have been associated
with increased adiposity in Asian Indians (Bhatt et al., 2012).
Taken together, data presented here clearly suggests that although definitive
mechanisms for myostatin signalling in equine obesity have yet to be established,
myostatin is likely to have an important role in whole body energy homeostasis. In
addition to the key role played by skeletal muscle in maintaining energy balance,
maintaining the balance between fat deposition and mobilisation is also crucial in
the regulation of energy balance.
1.6 Lipolysis in the regulation of energy balance
Traditionally viewed primarily as an inert storage site for excess energy, WAT is now
widely acknowledged as a highly metabolically active tissue, specialised in the
storage of excess energy as triglycerides in intracellular lipid droplets within
adipocytes (Brown, 2001). Under basal conditions, adipose tissue regulates the
balance between triacylglycerol (TAG) synthesis (lipogenesis) and TAG breakdown
(lipolysis). The ability of adipose tissue to store TAG enables it to provide the body
with energy during periods of negative energy balance, such as during fasting or
prolonged physical exercise. The complete hydrolysis of TAG results in the
production of three molecules of free fatty acids (FFA) and one molecule of glycerol
which are released into the circulation to be metabolised by other organs.
Adipose tissue is innervated by sympathetic and sensory nerve fibres which are
21
1 General Introduction
the activity of the autonomic nervous system and the hormonal influences of
insulin. The ratio between lipolytic β- and antilipolytic α2-adrenoceptors will
ultimately determine the net outcome of catecholamine-induced lipolysis. In the
postprandial state, elevated circulating insulin facilitates glucose uptake into
tissues, whilst concomitantly suppressing lipolysis. Insulin’s inhibitory actions on
both basal and catecholamine-induced lipolysis are considered to occur through the
phosphorylation and activation of phosphodiesterase 3B, which in turn catalyses
the breakdown of cAMP into inactive 5’-AMP, thereby reducing protein kinase A
(PKA) activation. The actions of the catecholamines, adrenaline and noradrenaline
exert their lipolytic functions through binding to adrenergic receptors (β1- and β2- in
humans) located on the plasma membrane of adipocytes (Arner, 2005). This leads
to a subsequent increase in intracellular cyclic AMP (cAMP) production, which in
turn activates PKA. Hormone-sensitive lipase (HSL) appears to be the major target
of activated PKA, whereby PKA-induced phosphorylation of HSL initiates its
translocation from the cytosol to the surface of the lipid droplet to initiate lipolysis
(Egan et al., 1992). At the lipid droplet surface, the hydrolysis of triglycerides occurs
through the sequential actions of three lipases. Adipose triacylglyceride lipase
(ATGL) converts TAG to diacylglycerol (DAG), whilst HSL converts DAG to
monoacylglycerol (MAG). Finally monoglyceride lipase (MGL) cleaves MAG into
glycerol and FFA. Although both ATGL and HSL exhibit the capacity to hydrolyse
triglycerides in vitro, ATGL appears to have higher substrate specificity for TAG than
DAG (Frühbeck et al., 2014), whilst only HSL demonstrates the ability to hydrolyse
DAG (Haemmerle et al., 2002). Furthermore, complete activation of AGTL requires
its binding with the co-activator comparative gene identification 58 (CGI58). Taken
together, between them, ATGL and HSL are thought to be responsible for over 95%
of TAG lipase activity (Schweiger et al., 2006). An overview of lipolysis is provided
in Figure 1.3. Regional differences in catecholamine lipolysis have been observed in
humans, with a more marked response to catecholamine stimulation in visceral
adipose tissue in comparison to subcutaneous adipose tissue, whilst basal lipolytic
activity is noted to be higher in subcutaneous compared to visceral depots (Arner,
22
expression and function of the catecholamine receptors.
In addition to the function of the lipases, lipid-droplet associated proteins also have
significant functional roles in the control of lipolysis. Lipid droplets contain a core of
neutral lipid surrounded by a phospholipid monolayer which is coated with specific
proteins, including members of the PAT family of proteins. Perilipin-1 (PLIN1) is the
founding member of the PAT family (named after the first three members, perilipin,
adipocyte differentiation-related protein (ADRP) and tail-interacting protein of
47kDa (TIP47)), all of which share sequence similarities and the ability to bind to
lipid droplets. PLIN1 is expressed almost exclusively in adipocytes, and within
adipocytes it is generally restricted to lipid droplets, however recently it has also
been shown to localize in the endoplasmic reticulum (Skinner et al., 2013). In the
basal state, PLIN1 is associated with CGI58, however maximal phosphorylation of
PLIN1 results in the dissociation of CGI58 from the lipid droplet, allowing it to
interact with ATGL in the initiation of lipolysis (Yamaguchi et al., 2007). In addition
to HSL, PLIN1 is also phosphorylated by PKA in response to catecholamine
stimulation. It has been demonstrated in vitro that that PKA-mediated
phosphorylation of PLIN1 is not essential for HSL translocation to the lipid droplet,
but it is essential for lipid droplet interactions between PLIN1 and HSL to allow