Memory-guided tracking through physical space and feature
space
Alexis D. J. Makin
Department of Psychological Sciences,University of Liverpool, Liverpool, UK#
$
Tushar Chauhan
Department of Psychological Sciences,University of Liverpool, Liverpool, UK#
$
People can estimate the current position of an occluded moving target. This is called motion extrapolation, and it has been suggested that the performance in such tasks is mediated by the smooth-pursuit system. Experiment 1 contrasted a standardposition extrapolation taskwith a novelnumber extrapolation task. In the position extrapolation task, participants saw a horizontally moving target become occluded, and then responded when they thought the target had reached the end of the occluder. Here the stimuli can be tracked with pursuit eye movements. In the number extrapolation task, participants saw a rapid countdown on the screen that disappeared before reaching zero. Participants responded when they thought the hidden counter would have reached zero. Although this stimulus cannot be tracked with the eyes, performance was comparable on both the tasks. The response times were also found to be correlated. Experiments 2 and 3 extended these findings, using extrapolation through color space as well as number space, while Experiment 4 found modest evidence for similarities between color and number extrapolation. Although more research is certainly needed, we propose that a common rate controller guides extrapolation through physical space and feature space. This functions like the velocity store module of the smooth-pursuit system, but with a broader function than previously envisaged.
Introduction
The visual scene is full of moving objects that often become temporarily occluded behind other things. Judgments about occluded moving targets have been studied in the laboratory, usingmotion extrapolation tasks (also known as prediction-motion tasks; Tresi-lian,1995). In many motion extrapolation experiments, participants attempt to press a button when the moving
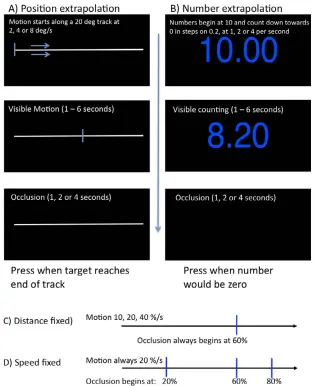
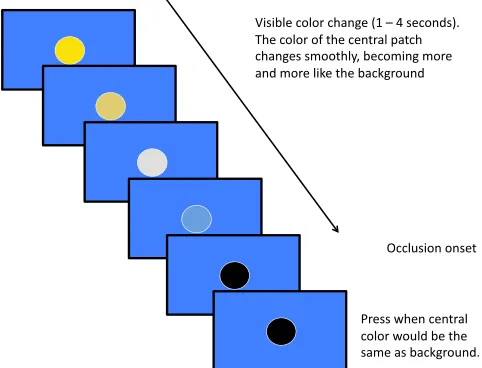
occluded target reaches a particular point, often the end of the occluder (Battaglini, Campana, & Casco, 2013; Benguigui & Bennett, 2010; Benguigui, Broder-ick, & Ripoll, 2004; DeLucia & Liddell, 1998; Makin & Poliakoff, 2011; Makin, Poliakoff, Chen, & Stewart, 2008; Makin, Stewart, & Poliakoff, 2009; Peterken, Brown, & Bowman, 1991; Rosenbaum, 1975). This standard form of motion extrapolation task is shown in Figure 1A.
Motion extrapolation performance can be explained by two distinct models—clockingand tracking (DeLu-cia & Liddell,1998). According to theclocking account, people estimate the time-to-contact (TTC) before occlusion onset using optic invariants (the Tau hypothesis; Lee, 1976), and then countdown this duration before initiating a response. There is no need to track the target or mentally simulate hidden target motion (Tresilian, 1995). Alternatively, the tracking hypothesis claims that people track the target with spatial attention or pursuit eye movements, and continue tracking the hidden target as accurately as possible across the occluder. They then respond when the gaze or spatial attention reaches the end of the occluder. DeLucia and Liddell (1998) presented evi-dence in favor of the tracking hypothesis.
Makin and Poliakoff (2011) elaborated on the tracking hypothesis. They noted that the oculomotor system is relatively well understood on cognitive and neural levels (for reviews see Barnes, 2008; Lisberger, 2010), and this knowledge can be used to help
understand motion extrapolation. One putative feature of the pursuit system is that velocity information can be retained in a short-term velocity memory store when targets disappear. Stored velocity representations can be used to guide pursuit eye movements prior to predictable motion onsets (Barnes & Asselman, 1991) or across occlusion periods (Bennett & Barnes, 2006). A second important feature is that premotor pursuit
Citation: Makin, A. D. J., & Chauhan, T. (2014). Memory-guided tracking through physical space and feature space.Journal of Vision, 14(13):10, 1–15. http://www.journalofvision.org/content/14/13/10, doi: 10.1167/14.13.10.
commands can be covertly active during fixation, with pursuit execution blocked at a low level in the
descending motor pathways (Barnes, Grealy, & Collins, 1997; Rizzolatti, Riggio, & Sheliga, 1994). Makin and Poliakoff (2011) concluded that velocity memory and premotor modules guide tracking of occluded targets during motion extrapolation, even if fixation is
required, and that the only remaining question is about the causal role of mental imagery, which may
sometimes accompany pursuit (de’Sperati & Deubel, 2006; Huber & Krist, 2004; Jonikaitis, Deubel, & de’Sperati, 2009).
It is worth noting that all the above models of motion extrapolation assume that some kind ofrate control mechanismis employed during the occlusion period. The rate controller could guide ocular tracking
across occlusion, and in this case, the rate controller would function in exactly the same way as the velocity store described by Makin and Poliakoff (2011). Alternatively, the rate controller could update mental imagery or just a representation of time-to-contact. All of these models of motion extrapolation assume a rate controller, even though they differ in their proposals as towhat is updated(i.e., eye position, mental images, or TTC estimates).
[image:2.612.149.463.57.443.2]The motion extrapolation literature has primarily focused on object motion through physical space, which can be tracked with eye movements. The current work introduces novel kinds of motion extrapolation tasks where the dynamic stimulus cannotbe tracked with pursuit eye movements. Several studies have explored perception of motion through feature space
(Blaser, Pylyshyn, & Holcombe,2000; Blaser & Sperling, 2008; Sheth, Nijhawan, & Shimojo, 2000), however extrapolation of ‘‘motion’’ through these feature spaces has not been widely considered (with the exception of a recent paper by Makin & Bertamini, 2014).
In Experiments 1 and 2, participants extrapolated through number space, while in Experiments 3 and 4, participants extrapolated through color space. We contrasted two hypotheses about how people produce accurately timed responses on the different extrapola-tion tasks. It could be that separate rate control systems mediate performance on each task (separate rate control hypothesis [SRC]). Alternatively, a common rate controller could mediate the performance on each extrapolation task. We refer to this as the common rate control hypothesis (CRC; Makin & Bertamini, 2014).
We measured completion time estimates (CTEs) on the different extrapolation tasks. To compare CRC and SRC models, we exploited the fact that CTEs are linearly related to occlusion duration (Benguigui et al., 2004; Makin & Bertamini, 2014; Tresilian, 1995). We computed the slope of this relationship in each task.
The SRC hypothesis predicts that differences be-tween tasks will grow with occlusion duration, resulting in different slopes. Conversely, the CRC predicts that slopes will be the same in both tasks (while allowing for differences in intercept, which do not necessarily reflect the functioning of the rate controller). This kind of analysis is common in the literature on cognitive timing, where it is used to distinguish influences on the central pacemaker modules from uninformative re-sponse biases (e.g., Wearden, Edwards, Fakhri, & Percival,1998). We also analyzed variable error (VE),
which is the standard deviation of response times in a condition. Makin and Bertamini (2014) found that VE also increased linearly with occlusion duration. This scalar component of CTE variance reflects noise within the rate control system. The SRC predicts different VE versus occlusion duration slopes in different extrapo-lation tasks, while the CRC predicts similar slopes across tasks.
Finally, we also investigated a secondary prediction of the CRC account—that the performance should be correlated, so participants who respond earlier in one kind of extrapolation task will tend to respond early in others.
Experiment 1
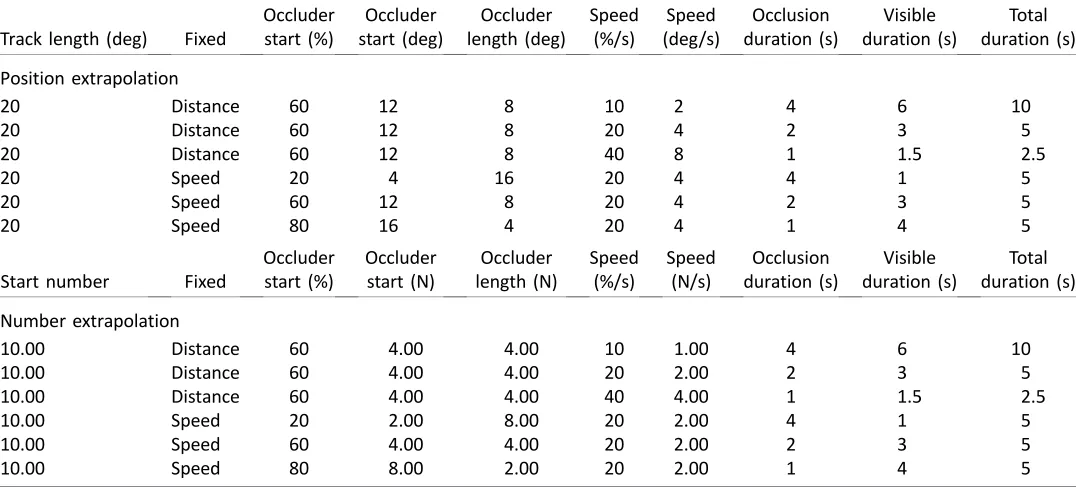
Experiment 1 compared performance on a standard position extrapolation task (Figure 1A) with a non-standard number extrapolation task (Figure 1B). In the number extrapolation trials, participants observed numbers counted down from ten towards zero in small, rapid decrements. The counter then disappeared before it reached zero (analogous to occlusion). At this point, participants assumed continued, hidden counting and pressed a button when they thought the counter would have reached zero. The temporal parameters of both position and number extrapolation tasks were matched (Table 1; Figure 1C, D).
The experiment was conducted in the eye tracker, and we contrasted fixation and pursuit conditions (or fixation and free viewing for the number task). This allowed us to replicate the eye movement results of
Track length (deg) Fixed
Occluder start (%)
Occluder start (deg)
Occluder length (deg)
Speed (%/s)
Speed (deg/s)
Occlusion duration (s)
Visible duration (s)
Total duration (s) Position extrapolation
20 Distance 60 12 8 10 2 4 6 10
20 Distance 60 12 8 20 4 2 3 5
20 Distance 60 12 8 40 8 1 1.5 2.5
20 Speed 20 4 16 20 4 4 1 5
20 Speed 60 12 8 20 4 2 3 5
20 Speed 80 16 4 20 4 1 4 5
Start number Fixed
Occluder start (%)
Occluder start (N)
Occluder length (N)
Speed (%/s)
Speed (N/s)
Occlusion duration (s)
Visible duration (s)
Total duration (s) Number extrapolation
10.00 Distance 60 4.00 4.00 10 1.00 4 6 10
10.00 Distance 60 4.00 4.00 20 2.00 2 3 5
10.00 Distance 60 4.00 4.00 40 4.00 1 1.5 2.5
10.00 Speed 20 2.00 8.00 20 2.00 4 1 5
10.00 Speed 60 4.00 4.00 20 2.00 2 3 5
[image:3.612.37.577.57.301.2]10.00 Speed 80 8.00 2.00 20 2.00 1 4 5
Makin and Poliakoff (2011), while also expanding on their conclusions about the oculomotor velocity mem-ory systems. Following Makin and Poliakoff (2011), we anticipated that performance on the position task would differ slightly depending on oculomotor in-structions. We also predicted that, during pursuit trials, eye position and CTEs would be systematically related. This replication aspect of Experiment 1 was important because we wanted to establish that the conclusions of Makin and Poliakoff (2011) were based on reliable evidence before proposing a modification of these conclusions.
Method
ParticipantsTwenty participants (aged 18 to 34, five male, four left-handed) were involved. They all had normal or corrected to normal vision, and were either reimbursed £10 or given course credits. The study had local ethics committee approval and was carried out in accordance with the Declaration of Helsinki.
Apparatus
The experiment was conducted in a dimly lit room. Stimuli were presented on a 41 cm wide LCD monitor updating at 75Hz. Participants sat 57 cm away from the screen, with heads stabilized in a chin rest. Eye position was recorded continuously at 120 Hz with an ASL EYE-TRAC 6 (Applied Science Laboratories, Bedford, MA) desk mounted eye tracker. The experiment was programmed using open source PsychoPy software (Peirce,2007).
Design
Performance metrics were measured in 24 fully counterbalanced conditions (task [position, number]· eye instruction [fixation, free viewing]·fixed param-eter [distance, speed]·occlusion duration [1, 2, or 4 s]). There were six repeats of each condition.
Stimuli and procedure
There were two basic trial types, position extrapo-lation and number extrapoextrapo-lation. In the position extrapolation task, the target was a vertical blue bar that moved leftwards or rightwards along a 208 horizontal grey track (Figure 1A). In the number extrapolation task, the trial began with a large number ‘‘10.00’’ in the center of the screen. The numbers then counted down towards zero in 50 decrements of 0.2 (e.g., 9.80, 9.60, 9.40 . . .n). The numbers updated rapidly, giving the impression of continuous change
(Figure 1B). Number space was chosen for the nonstandard extrapolation task because, like physical space, it is objective, linear, and metric. Half the trials were fixation trials and half were pursuit trials (or free viewing trials in the number extrapolation task). In the fixation trials, a fixation cross was presented just above the dynamic stimuli. In the pursuit and free viewing trials, no cross was presented.
On both tasks, the initial state (i.e., the target in peripheral location, or number 10.00) was presented for 2 s before motion began and a 200 ms auditory beep was presented through headphones to indicate that the trial was about to begin.
Participants were first shown demonstration trials from both extrapolation tasks, and it was explained that the aim was to press the space bar when the occluded process was complete (i.e., the hidden target reached the end of the track, or the hidden numbers reached zero). The participants understood that the visible period would end at an unpredictable point, but they were to assume that the target motion or counting continued at the same speed (albeit hidden from view). After the demonstration trials, a 24-trial practice block, with similar parameters to the main experiment, ensured that participants were competent at the task, and that they could reliably fixate when required. The eye tracker was calibrated with a nine-point calibration screen after the practice block. The experiment was broken into 13 blocks of 16 trials, with an opportunity for rest and recalibration between each block. The experimenter monitored oculomotor behavior on a monitor in the same room, and occasionally reminded participants about task instructions.
Most analysis was done on a tightly controlled set of 144 experimental trials. The parameters of these trials were carefully matched across both extrapolation tasks. More specifically, the tasks were matched in terms of proportion of the process completed per second (%/s; Makin & Bertamini, 2014). In the experimental trials the occlusion period was always 1, 2, or 4 s long. In half the trials, we varied occlusion duration by manipulat-ing target speed (10%, 20%, or 40%per second), while keeping visible distance constant (last 40%occluded). These trials are referred to as the distance fixed trials (Figure 1C). In the other half of the trials, the occlusion durations were produced, keeping speed constant (20% per second), while varying visible distance (80%, 60%, or 20%of total). These are referred to as thespeed fixed
trials (Figure 1D). Table 1 shows the parameters of these trials in detail.
whether these influences would be comparable in position and number extrapolation tasks.
Since we did not want the participants to become too familiar with the 1, 2, and 4 deg/s occlusion durations, we randomly interleaved 64 additional filler trials with the experimental trials. For the filler trials, speed was randomly chosen on a trial-by-trial basis from a uniform distribution between 10%/s and 40%/s, while occlusion onset ranged from 20%to 80%. The position of occlusion onset, speed, and occlusion duration were thus unpredictable. There were an equal number of leftward and rightward position filler trials.
Analysis
In all trials, the computer recorded the time the participant pressed the space bar to indicate that they thought the occluded process was complete. This metric is calledcompletion time estimate(CTE). Completion time estimate was then compared with perfect CTE (i.e., occlusion duration), givingerror. The mean of the CTEs in each condition was obtained (excluding a very small number of fixation trials where participants erroneously produced a pursuit eye movement, ;1.3%). For each participant, the standard deviation of CTEs in each condition was also obtained, giving variable error (VE). Finally, we computed the coeffi-cient of variation (CoV) in each condition (VE/mean CTE). Coefficient of variation is useful because it quantifies the precision of performance. Response metrics were analyzed with repeated measures AN-OVA. The Greenhouse-Geisser factor was used to adjust degrees of freedom when the assumption of sphericity was violated.
For CTE and VE, we obtained the slope of the regression line relating each metric to occlusion duration. The slope values were then compared between tasks with a pair samplest tests. We used a two-tailed test because we did not have any prior expectations about which task would give a steeper slope, if any. We also measured the correlation between tasks. This was done with a one-tailed test, because we predicted positive rather than negative correlations.
Results
Eye movements
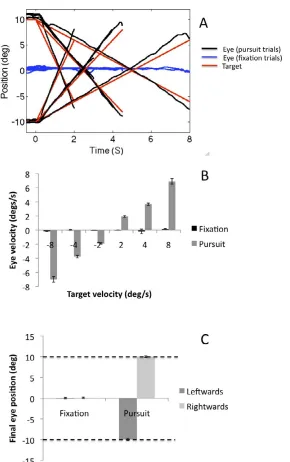
Eye movements in the position extrapolation task are shown in Figure 2. In panel A, eye position is plotted as a function of time. It can be seen that the eye position closely matches target position in the pursuit trials, and remains around screen center in the fixation trials. Eye velocity and target velocity are shown in Figure 2B. Again, the close relationship between eye velocity and target velocity can be seen in the pursuit
condition, while near zero velocity was evident during fixation. These plots confirm that participants were generally obeying oculomotor instructions. All patterns in Figure 2A and B were confirmed statistically, although we do not report all this analysis here for brevity.
Next, we analyzed position of the eyes in the penultimate 200 ms of the presentation, before the participant responded (Figure 2C). This was near zero in the fixation trials, and very close to the left or right end of the track in the pursuit trials (610 deg). This is instructive because it shows a systematic relationship between eye position and response time. In other words, when participants responded, the eyes were close to the end of the occluder (details of eye tracking analysis are in the Supplementary materials).
Behavioral results
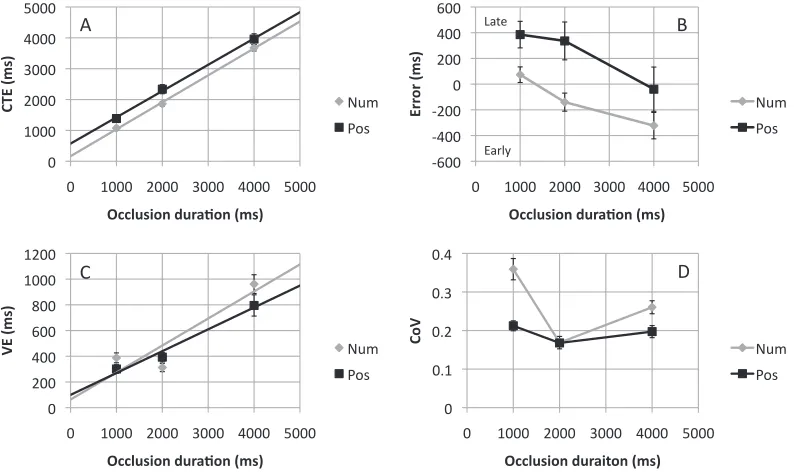
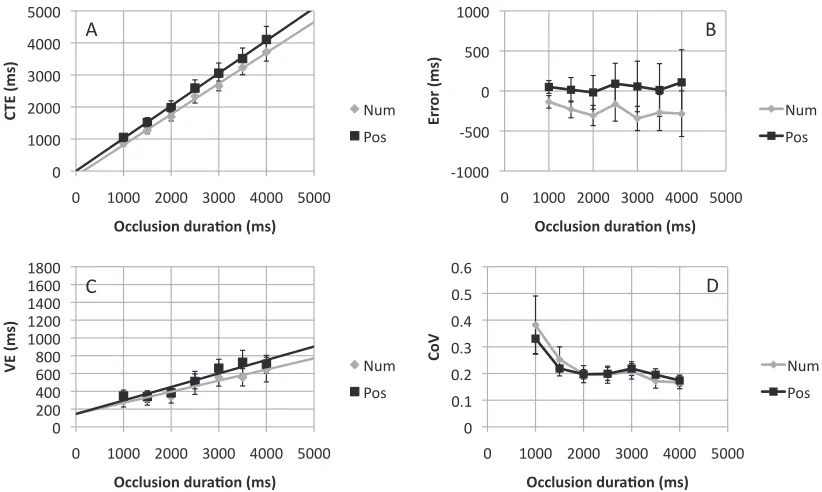
Completion time estimates from each task are shown as a function of occlusion duration in Figure 3A. Completion time estimates linearly increased with occlusion duration in both position and number extrapolation tasks. People responded later in the position task than the number task; however, this difference did not multiply with occlusion duration.
Repeated measures ANOVA found a main effect of task,F(1, 19)¼8.133,p¼0.010, and occlusion
duration, F(1.27, 24.22)¼1,054.937,p,0.001, but no interaction, F(1.54, 29.23)¼3.423,p¼0.057. We next compared the slope and intercept of the CTE versus occlusion duration relationship between tasks (see trend line in Figure 3A). The slope values did not differ between position and number tasks, (0.85 vs. 0.87),
t(19) ,1,ns. The intercept was greater in the position extrapolation task, (573 vs. 165 ms), t(19)¼4.375,p,
0.001. The same data are plotted as error (that is, CTE occlusion duration) in Figure 3B. Statistical analysis of error gives the same results as CTE; however, the additional plot is useful because it shows that participants shift from late to early responses as occlusion duration increases from 1 to 4 s.
Variable error (VE) is shown in Figure 3C (a participant’s VE¼theSDof the 24 CTEs in each condition). Variable error did not differ between tasks,
F(1, 19)¼1.312,p¼0.266, and increased with occlusion duration,F(1.24, 23.50)¼86.201,p,0.001. There was also a task·occlusion duration interaction, F(2, 38)¼ 8.712, p¼0.001, although the slope of the VE versus occlusion duration relationships did not differ between tasks, (0.17 vs. 0.21), t(19)¼1.736,p¼0.099, and neither did the intercept, (100 vs. 63 ms),t(19),1,ns.
task at the 1 and 4 s occlusions. ANOVA revealed main effects of task,F(1, 19)¼19.845,p ,0.001; occlusion duration,F(2, 38)¼30.356,p ,0.001; and a task· occlusion duration interaction,F(2, 38)¼17.745,p ,
0.001.
In Experiment 1, the 1, 2, and 4 s occlusions were produced by either varying speed or distance (Table 1; Figure 1C, D). In addition, there were fixation and pursuit/free viewing trials. These factors had subtle effects on CTE and VE, which are described fully in the Supplementary materials section. To summarize, dis-tance fixed trials were largely responsible for the range effect (people responded late at short occlusions and
early at long occlusions). This pattern was present in both tasks, but was more pronounced in the number extrapolation task. In the position task, eye instructions were involved in complex interactions with other factors, while there was no effect of eye instruction in the number task.
Correlation analysis
[image:6.612.165.455.52.514.2]Next we explored correlations between CTEs in position and number tasks. The common rate control account predicts that participants who respond earlier in the position extrapolation task should respond
earlier in the number extrapolation task and vice versa. This prediction was confirmed, although the effect was not strong (r¼0.43,p¼0.030, one-tailed). There was a positive correlation between CTEs in both tasks in all 12 conditions (maxr¼0.51, minr¼0.20). There was a nonsignificant positive correlation between VE in the position and number tasks (r¼0.238, p¼0.157, one-tailed).
Discussion
Experiment 1 replicated evidence that the oculomo-tor system mediates the position extrapolation task (Makin & Poliakoff, 2011). First, when participants were allowed to pursue the targets, they tracked to the end of the occluder before pressing the button. This implies that the eyes and button press were guided by the same representation of occluded motion. Second, there were subtle differences in button press response time in fixation and pursuit tasks. The dynamic countdown stimuli in the number task could not be tracked with eye movements, so one may argue that a different, non-oculomotor, rate controller should be recruited (SRC account). However, we found that performances on the tasks were closely related. We thus propose that a common rate control system guides performance in both tasks (CRC account). This putative rate controller can be functionally coupled to the premotor components of the oculomotor system in
the position task (where it functions like the velocity store described in Makin & Poliakoff, 2011), but can also be coupled to other representations, such as number in the number extrapolation task.
Evidence for common rate control account was threefold. First, although CTEs were lower in the number task than the position task, this difference did not grow with occlusion duration (there were intercept differences between tasks, but no slope differences). This implies that the same rate controller, with the same properties, guided tracking on the position task and mental counting on the number task. Second, VE was scaled to occlusion duration, and the slope of the VE versus occlusion duration relationship was similar in both tasks. Third, we found that participants who responded early on the position task also did so on the number task, and vice versa.
Experiment 2
In addition to theoretically interesting results, Experiment 1 showed that inclusion of distance fixed trials results in differential sensitivity to stimulus speed. This secondary effect complicates patterns that allow us to distinguish CRC and SRC accounts (see
[image:7.612.110.510.63.300.2]Supplementary materials). In Experiment 2, we repli-cated the position and number extrapolation tasks, but used only speed fixed trials. In order to prevent speed
from being too predictable, we increased the number of fillers, where parameters were randomized, to 50%of all trials (from 31%in Experiment 1). Furthermore, we recognized that analysis of slope effects based on just three levels in Experiment 1 was not ideal, so we increased the number of levels of occlusion duration to seven (1, 1.5, 2, 2.5, 3, 3.5, and 4 s). Experiment 2 was not conducted in the eye tracker lab, and there were no fixation instructions. Experiment 2 was thus optimized to distinguish SRC and CRC hypotheses with slope analysis.
Method
Stimuli were similar to Experiment 1. There were 12 participants (aged 19–35, three male, one left-handed) and 10 trials in each experimental condition: task (position, number)·occlusion duration (1, 1.5, 2, 2.5, 3, 3.5, and 4 s), giving 140 experimental trials in total. The seven levels of occlusion duration were produced by varying occluded distance (20%, 30%, 40%, 50%, 60%, 70%, or 80%), while keeping stimulus speed at 20%/s. In addition, there were 140 filler trials where occluded distance was randomized between 20%and 80%and speed was randomized between 10%/s and 40%/s (as in Experiment 1). Stimuli were presented on a 36-deg-wide CRT monitor updating at 60Hz. Partici-pants were 57 cm from the screen, with head stabilized in a chin rest. The static period before motion onset was reduced from 2 to 0.5 s. There were 20 blocks of 14 trials, and participants first completed a practice block
of 12 trials to familiarize themselves with the task. We obtained the same performance metrics as in Experi-ment 1, after removing one trial where CTE was more than four times the occlusion duration.
Results
Figure 4A shows CTE as a function of occlusion duration in the position and number tasks. The corresponding ANOVA revealed no main effect of task,F(1, 11)¼2.766,p¼0.124, a strong effect of occlusion duration,F(1.22, 13.40)¼110.889,p,0.001, and no task· occlusion duration interaction,F(2.37, 26.02),1,ns. The slopes of the CTE versus occlusion duration relationship were comparable in both position and number tasks, (1.02 vs. 0.96), t(11) ,1,ns. Although the intercept was higher in the position task, this did not reach significance, (2 vs.148 ms),t(11)¼ 1.286, p¼0.225. The same data are shown as error in Figure 4B. Again we see that participants responded earlier in the number extrapolation task, but this difference did not grow with occlusion duration. Unlike Experiment 1, there was no evidence of a range effect because all trials were conducted at a fixed speed of 20%/s.
Variable error is shown in Figure 4C. The general increase in VE found in Experiment 1 was still evident, although it was flattened at extreme occlusions. ANOVA revealed no main effect of task,F(1, 11),1,
[image:8.612.101.512.61.307.2]ns, a strong effect of occlusion duration,F(2.34, 25.75) ¼12.525,p,0.001, and no task·occlusion duration
interaction,F(2.76, 30.31) ,1,ns. We measured slope and intercept of the regression lines for these relation-ships (although this is slightly less appropriate given the apparent nonlinearity) and found no differences in slope, (0.15 vs. 0.12),t(11) ,1.023,p¼0.328) or intercept, (146 vs. 145 ms),t(11),1,ns. Coefficient of variation (CoV) is shown in Figure 4D. There was no main effect of task,F(1, 11) ,1,ns, a main effect of occlusion duration,F(1.47, 16.19)¼6.326,p¼0.014, and no interaction,F(1.80, 19.46), 1,ns. The main effect of occlusion duration reflected larger CoV at short occlusions of 1 and 1.5 s.
As with Experiment 1, we tested whether CTE on both tasks was correlated. This prediction was con-firmed. Participants who responded early on the position task also responded earlier on the number task (r¼0.70,p¼0.006, one-tailed). Positive correlations were obtained at all seven levels of occlusion duration (r¼0.16, 0.27, 0.46, 0.71, 0.72, 0.86, 0.68). Variable error also correlated between tasks (r¼0.54,p¼0.036, one-tailed), and this was evident at most levels of occlusion duration (r¼0.1, 0.31, 0.42, 0.71, 0.63, 0.26, 0.22).
Discussion
Experiment 2 found a linear relationship between CTE and occlusion duration in both the position and number extrapolation tasks. Variable error also scaled
to occlusion duration, and again, this effect was comparable in both tasks. Correlation analysis revealed that participants who responded early on the position task tended to do so on the number task as well. Experiment 2 thus provided further evidence in support of the CRC model initially laid out in Experiment 1.
Experiment 3
Experiment 2 supported the CRC account, showing that performance was closely related on position and number extrapolation tasks. However, one may argue that number extrapolation might be an unusual case, because there are known links between spatial atten-tion, numerical cognition and oculomotor control (reviewed in Hubbard, Piazza, Pinel, & Dehaene, 2005). It is thus necessary to test the CRC account with other kinds of feature-motion. In Experiment 3 we intro-duced a novel color extrapolationtask, where the participants performed a task analogous to the position and number extrapolation tasks, but through color space.
In this task, a central, circular patch changed smoothly from yellow to blue (or vice versa). The background color was always the other extreme of this color dimension (so the presentation showed a central area becoming more and more like the background). At a certain point, the central color turned black
(analogous to occlusion), but participants imagined continued but hidden color change, and responded when they judged the process to be complete (Figure 5). We contrasted performance on the color extrapolation task with position extrapolation task identical to that used in Experiment 2.
Method
[image:9.612.46.287.65.249.2]Twelve participants were involved in Experiment 3 (aged 19–44, five male, one left-handed). They were screened for color-blindness using the Ishihara color plates (1917). The experiment was conducted in a dark room to avoid ambient illumination. The apparatus was the same as Experiment 2, except the CRT monitor was color calibrated and gamma-corrected using the Photo Research PR-650 Spectrascan spectroradiometer (Photo Research, Inc., Chatsworth, CA) and the built-in PsychoPy monitor calibration module. The central circular stimulus had a diameter of 5 deg, with a thin white contour delineating it from the background. The color of the stimulus was restricted along the yellow– blue unique hue lines (Xiao, Wuerger, Fu, & Karatzas, 2011) on a;41.3cd/m2 (maximum deviation of 0.3cd/ m2) isoluminance plane.
The stimulus moved along one unique hue direction (yellow or blue), desaturating until it reached a neutral grey (Chauhan et al.,2014), and then saturating again along the other unique hue direction. The starting and ending points were kept at the same saturation level. The motion was programmed in the perceptually uniform CIELAB space (CIE, Colorimetry, CIE 15:2004, Commission Internationale de l’Eclairage, Vienna, 2004), with 50 equally spaced colors spanning the entire motion (analogous to the 50 decrements of the number extrapolation task). These 50 colors were shown sequentially for the visible period on each trial, producing perceptually smooth motion through the color space. The speed of color motion was altered by varying the delay between one sample and the next. At the beginning of each trial, the initial color was shown for 500 ms.
As with Experiments 1 and 2, stimulus parameters were matched in terms of proportions. For all trials, the distance from start of the process to the end of the occluder was always same (the length of the track in the position task or the starting and ending colors in the color task). These dimensions were extremely well learned, and the endpoints were always apparent throughout the trial (i.e., the track or the color of the background). There was no ambiguity about the character of the occluded process or what the endpoint was because the background acted as a constant anchor. Pretesting showed that it was not difficult for participants to imagine how the hidden stimulus was supposed to be moving in color space after occlusion.
As with Experiment 2, all experimental trials were speed fixed at 20%per second. There were seven levels
of occlusion duration (1, 1.5, 2, 2.5, 3, 3.5, and 4 s), determined by the point of occlusion onset (20%to 80%). There were 10 repeats of each condition. In addition, there were 140 filler trials, where stimulus speed and occlusion onset were randomized. Again there were 20 blocks of 14 trials, and a 12-trial practice block. We obtained the same performance metrics as Experiments 1 and 2. Twelve trials where CTE was more than four times occlusion duration were removed prior to analysis (0.35%).
Results
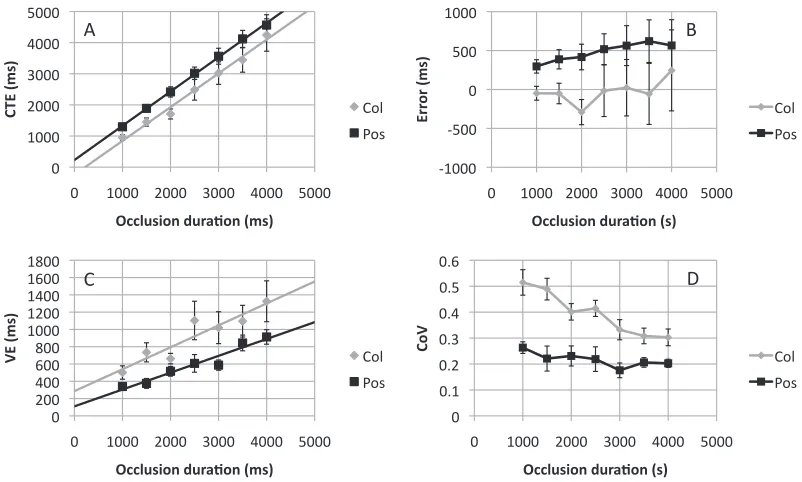
Figure 6A shows that CTE increased with occlusion duration, and the slope was similar in both tasks. Repeated measures ANOVA confirmed this. The main effect of task did not reach significance, F(1, 11)¼ 4.029,p¼0.070. There was a strong effect of occlusion duration, F(1.17, 12.87)¼75.414,p ,0.001, but no task·occlusion duration interaction,F(1.72, 18.91),
1, ns. There were no differences in the CTE versus occlusion duration slopes in the position and color tasks, (1.10 vs. 1.08), t(11) ,1,ns. The intercept was higher in the position task, (228 vs.239 ms), t(11)¼ 2.296,p¼0.042. Figure 6B shows error in both tasks. It can be seen that the color extrapolation task was relatively free from error here, but this group of participants responded systematically later in the position task.
[image:10.612.106.507.60.301.2]Variable error results are shown in Figure 7C. VE was higher in the color extrapolation task,F(1, 11)¼ 7.096, p¼0.022, and was scaled to occlusion duration
in both tasks,F(2.19, 24.04)¼12.469,p,0.001. There was no task ·occlusion duration interaction,F(2.39, 26.31)¼1.259,p¼0.305. The slope of the VE versus occlusion duration relationship was similar in both tasks, (0.19 vs. 0.25),t(11) ,1,ns, while the apparent intercept difference in Figure 6C was not significant, (111 vs. 286 ms),t(11)¼1.235,p¼0.243. Coefficient of variation results are shown in Figure 6D. The
corresponding ANOVA found main effects of task,
F(1, 11)¼49.054, p,0.001, and occlusion duration,
F(6, 66)¼7.017,p ,0.001, and a task ·occlusion duration interaction,F(6,66)¼2.739,p¼0.019, due to a significant decrease in CoV with occlusion duration in the color task,F(6, 66)¼6.023,p ,0.001, but not in the position task,F(2.16, 23.71)¼1.752,p¼0.194.
Correlation analysis found a positive relationship between CTE in the position and color tasks, although this did not reach significance (r¼0.41,p¼0.096, one-tailed). There was a positive correlation at all levels of occlusion (r¼0.06, 0.38, 0.25, 0.52, 0.22, 0.40, 0.53). Variable error was also weakly correlated between tasks (r¼0.27, p¼0.201, one-tailed).
Discussion
Experiment 3 partially replicated the results of Experiment 2, using a novel color extrapolation task. CTE was linearly related to occlusion duration in the position and color tasks, and the slope of these
relationships was very similar. Variable error was again scaled to occlusion duration. The slope of this relation-ship was similar in both tasks, although responses were
more variable in the color task. In summary, Experiment 3 provides evidence that a common rate controller guides position and color extrapolation. However, unlike Experiments 1 and 2, performance metrics between tasks were correlated positively, but not significantly. Therefore the correlation analysis in Experiment 3 does not support the CRC hypothesis.
Experiment 4
Experiment 4 was very similar to Experiment 3, except the number extrapolation task was used in place of the position extrapolation task. The number
extrapolation task was identical to Experiment 2, while the color task was identical to Experiment 3. As usual, both kinds of trials were interleaved. We reasoned that if a common rate controller guides position and number extrapolation (suggested by Experiments 1 and 2), and a common rate controller guides position and color extrapolation (suggested by Experiment 3), then a common rate controller mustguide number and color extrapolation as well. Experiment 4 thus completes the triangle.
Another 12 participants were involved (aged 19–43, four male, one left-handed). Data were processed in the same way as Experiments 2 and 3, and 14 trials were removed because CTE was more than four times occlusion duration (0.41%).
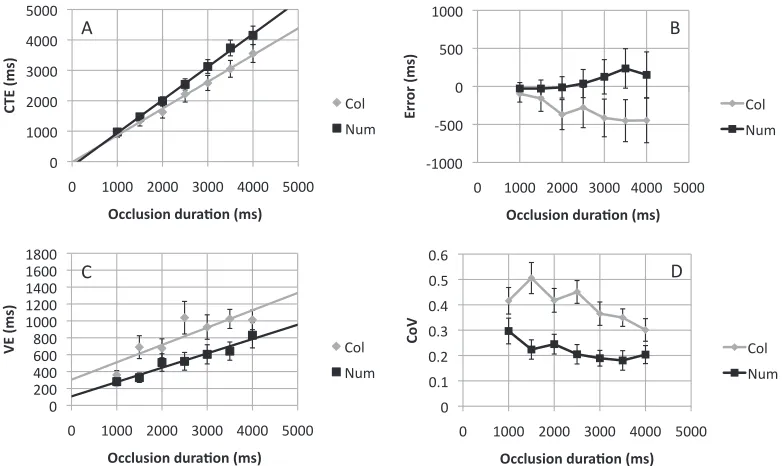
[image:11.612.111.502.62.295.2]Completion time estimate results are shown in Figure 7A and error in 7B. There is some indication that the slope of the CTE versus occlusion duration
relationship is steeper in the number task than the color task, supporting the alternative SRC hypothesis. However, this impression was not confirmed statisti-cally. There was a main effect of task,F(1, 11)¼5.661,
p¼0.037, and occlusion duration,F(1.78, 19.52)¼ 110.153,p,0.001, but no interaction,F(1.87, 20.58)¼ 2.794,p¼0.087. The apparent slope differences in Figure 7A did not reach significance, (0.88 vs. 1.09),
t(11)¼2.050,p¼0.065. There was no difference in intercepts, (18 vs.147 ms),t(11) ,1,ns.
Variable error is shown in Figure 7C; these data were characterized by a main effect of task,F(1,11)¼22.662,
p¼0.001, and occlusion duration,F(6, 66)¼12.201,p
,0.001, but no interaction,F(2.95, 32.47)¼1.638,p¼ 0.200. There was neither a slope effect, (0.17 vs. 0.21),
t(11) ,1,ns, nor an intercept effect, (305 vs. 107 ms),
t(11)¼1.309,p¼0.217. Coefficient of variation results are shown in Figure 7D. There was a main effect of task,F(1, 11)¼51.139, p, 0.001, and occlusion duration,F(3.66, 40.23)¼3.411,p¼0.020, but no interaction,F(6, 66)¼1.969,p¼0.083.
As hypothesized, CTEs from the color and number extrapolation tasks were positively correlated (r¼0.62, p¼0.017, one-tailed). There were positive correlations at all but one occlusion duration (r¼0.09, 0.09, 0.46, 0.70, 0.67, 0.56, 0.57). Variable error was also
correlated between tasks (r¼0.76,p¼0.002, one-tailed). There were positive VE correlations across tasks at all levels of occlusion duration (r¼0.18, 0.03, 0.75, 0.68, 0.75, 0.05, 0.32).
In summary, Experiment 4 largely replicated Ex-periment 3, but with color and number extrapolation tasks. There were some unexpected borderline slope differences in CTE analysis that are not predicted by the CRC account (Figure 7A). On the other hand, the predicted correlations were found in Experiment 4, so participants who responded earlier, or were more variable on the number task were likely to show the same tendency on the color task.
Combined analysis
Overall, the current work supports the CRC hypothesis ahead of the alternative SRC hypothesis.
[image:12.612.314.576.59.153.2]However, the results were not uniformly supportive. Table 2shows a breakdown of evidence across the four experiments, where borderline effects are conservatively interpreted as goingagainstthe CRC. Nevertheless, 12 of the 16 analyses support the CRC hypothesis.
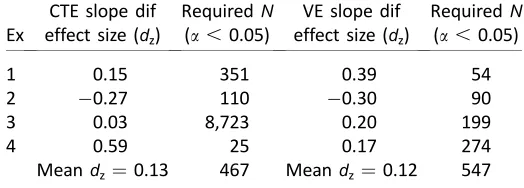
Another potential concern is that we make theoret-ical claims based on the absence ofsignificant slope differences. We thus need to guard against statistical Type II errors (retaining a false null hypothesis) that can arise from lack of statistical power. To explore this, we obtained effect size of the CTE slope differences (Cohen’s dz, Mean 1Mean 2/pooledSD). Table 3
shows that effect sizes were small in most experiments: The mean effect for CTE slope differences was 0.13, while for VE slopes, the mean effect size was 0.12, (where 0.2 is conventionally small, 0.5¼medium, 0.8¼ large). To put this in perspective, Table 3 also shows results of a power analysis (G-Power software, www. gpower.hhu.de) used to ascertain the sample size needed for 80% chance of reaching significance with a conventional alpha level of 0.05 (1-b¼0.8; see Lakens, 2013 for an introduction to effect size and power analysis).
Finally, we note that loosely related experiments have reported much larger slope effects, for instance, effect size was 0.76 in a ‘‘time dilation’’ experiment by Makin et al. (2012). It is thus appropriate to conclude slopes of the regression lines relating performance metrics to occlusion duration were similar across different extrapolation tasks in this work.
General discussion
Previous work has suggested that the motion extrapolation is mediated by the oculomotor system (Makin & Poliakoff, 2011). Although the oculomotor account of motion extrapolation proposed by Makin and Poliakoff (2011) was based on reliable evidence, replicated in our Experiment 1, the current studies point towards the possibility of a more general explanation of their results. We now propose that the
Ex
Same slope CTE?
Same slope VE?
Correlations CTE?
Correlations VE?
1 Yes Yes Yes No
2 Yes Yes Yes Yes
3 Yes Yes No No
4 No Yes Yes Yes
Table 2. Evidence in favor of the CRC hypothesis across the different experiments.
Ex
CTE slope dif effect size (dz)
RequiredN
(a, 0.05)
VE slope dif effect size (dz)
RequiredN
(a,0.05)
1 0.15 351 0.39 54
2 0.27 110 0.30 90
3 0.03 8,723 0.20 199
4 0.59 25 0.17 274
[image:12.612.37.295.60.141.2]Meandz¼0.13 467 Meandz ¼0.12 547
velocity store component of the smooth-pursuit system (Barnes, 2008), central to the Makin and Poliakoff (2011) account, could be reconceptualized as a common rate control mechanism.
The strongest evidence for the common rate control (CRC) account comes from analysis of the slope of the relationship between CTEs and occlusion duration. The slope of CTE versus occlusion duration function was never significantly different between any pair of extrapolation tasks (although there was a borderline effect in Experiment 4). We sometimes found small intercept differences, but this is unlikely to result directly from the function of the rate controller.
In recent work, Makin and Bertamini (2014) compared a position extrapolation task and a novel
accumulation extrapolationtask, where participants viewed small Gabors filling an empty matrix, and then extrapolated further, occluded accumulation. Makin and Bertamini (2014) also analyzed the slope and intercept effects and again found no slope differences of the type predicted by the alternative SRC account. The current work adds to the results of Makin and
Bertamini (2014), but with more conclusive findings. We also considered variability around mean CTE in different extrapolation tasks (recall that VE¼SDof CTEs in a condition). Some of this variability must result from noise in the rate controller. Importantly, variability in the rate controller should accumulate as occlusion progresses, producing a positive slope in the VE versus occlusion duration plot (scalar variation is ubiquitous in tasks where timed responses are required, and reflects noise in central timing mechanisms; Buhusi & Meck,2005; van Rijn, Gu & Meck, 2014). Different rate controllers could have different levels of internal noise, resulting in differences in VE versus occlusion duration slope. However, the VE versus occlusion duration slope was always comparable between pairs of extrapolation tasks. This is consistent with the CRC hypothesis. Other sources of VE, such as motor variability in executing the button press (Wing, 2002) do not scale with occlusion duration, but may produce intercept effects (for further analysis of proportional and constant noise, see Supplementary materials of Makin & Bertamini, 2014).
Further support for the CRC account came from correlation analysis. Participants who responded earlier in one extrapolation task tended to do so in another, and participants who were more variable in one extrapolation task tended to be variable in others. However, there are many reasons performance metrics could correlate between two interleaved tasks. Al-though it is indeed possible that some of this shared variance results from individual differences in rate control, we cannot establish the extent of this contribution. It is also important to note that in Experiment 3these effects were weak, and the expected
correlation between CTEs in position and color tasks was not significant.
Although some revision of the smooth-pursuit-based models of motion extrapolation is warranted, the current work isnot an attempt to resuscitate tau and cognitive clocking models of extrapolation of the type considered by Tresilian (1995) and DeLucia and Liddell (1998). Indeed, these models cannot readily explain extrapolation through number space or color space. A scene with dynamic number changes certainly contains information that can be used to guide judgments, but the visual system isnotdirectly tuned to counting (as it is supposedly tuned to optic flow fields and tau). After all, this kind of feature motion is ecologically infre-quent, and it does not provide invariants that can be used for fast motor control and coordination. It is more likely that observers mentally simulate ongoing change throughout the occlusion period, and the rate of the simulation is controlled by a common mechanism.
The ideas presented in this paper resemble those in other work and it is important to discuss the nature and extent of this overlap. First, as mentioned, there is now strong evidence that mental representation of number and distance are closely linked (Hubbard et al., 2005). Because the number task is quasi-spatial, it is perhaps no surprise that it linked to oculomotor control mechanisms. However, the same cannot be said of the color extrapolation task in Experiments 3 and 4. We can thus rule out the possibility that there is a common rate controller for updating position and number representations only. Second, there is evidence that the brain codes a common representation of magnitude across many dimensions, such as weight, size, and speed (Walsh, 2003). All our extrapolation tasks involveabstract reductionalong a particular dimension (i.e., closer to the end of the track, zero, or to the background color). However, the theory of magnitude does not consider rate control specifically, or how representations can be updated at the right speed. We think that the common rate controller can be coupled to different representations, not just the common magnitude representation, although this requires more research. Finally, there is important work on rate control using the synchronization-continuation para-digm (Collins, Jahanshahi, & Barnes, 1998; Rao et al., 1997; Wing, 2002) that shows that central timing mechanisms are necessary to pace tapping during the continuation phase. This may be another function of the rate control systems used in different forms of motion extrapolation.
Arnold, & Nishida,2006). However, we note that a rate controller is conceptually different from a pure clock. A rate controller guides dynamic, online updating of representations (e.g., color, number) or motor outputs (e.g., eye movements), while a clock provides a
reportable representation of how much time elapsed. Therefore, arguments against the supramodal clock model do not necessarily count against the CRC model.
Conclusions
Previous work has shown that standard motion extrapolation tasks involve visuospatial tracking, and that this is probably a function of the smooth-pursuit system. Supporting evidence for this was replicated here. However, performance was comparable on the position extrapolation task, and the novel number and color extrapolation tasks, in which the stimuli couldnot be tracked with eye movements. These preliminary findings point toward the possibility of a common rate control mechanism that guides updating across a range of dynamic mental simulations and motor outputs. This hypothetical rate controller has a function similar to the velocity store in pursuit control, but with a broader range of cognitive and motor functions.
Keywords: motion extrapolation, time-to-contact, feature tracking, velocity, smooth pursuit eye movements
Acknowledgments
A Leverhulme Trust Early Career Fellowship (ECF 2012-721) awarded to Alexis Makin sponsored this work.
Commercial relationships: none.
Corresponding author: Alexis D. J. Makin. Email: [email protected].
Address: Department of Psychological Sciences, Uni-versity of Liverpool, Liverpool, UK.
References
Barnes, G. R. (2008). Cognitive processes involved in smooth-pursuit eye movements. Brain and Cogni-tion, 68, 309–326.
Barnes, G. R., & Asselman, P. (1991). The mechanism of prediction in human smooth-pursuit eye move-ments. Journal of Physiology, 439,439–461. Barnes, G. R., Grealy, M., & Collins, S. (1997).
Volitional control of anticipatory ocular smooth pursuit after viewing, but not pursuing, a moving target: Evidence for a re-afferent velocity store. Experimental Brain Research, 116, 445–455. Battaglini, L., Campana, G., & Casco, C. (2013).
Illusory speed is retained in memory during invisible motion. i-Perception, 4,180–191.
Benguigui, N., & Bennett, S. J. (2010). Ocular pursuit and the estimation of time-to-contact with acceler-ating objects in prediction motion are controlled independently based on first-order estimates. Ex-perimental Brain Research, 202, 327–339.
Benguigui, N., Broderick, M., & Ripoll, H. (2004). Age differences in estimating arrival-time. Neuroscience Letters, 369, 197–202.
Bennett, S. J., & Barnes, G. R. (2006). Combined smooth and saccadic ocular pursuit during the transient occlusion of a moving visual object. Experimental Brain Research, 168, 313–321. Blaser, E., Pylyshyn, Z. W., & Holcombe, A. O. (2000).
Tracking an object through feature space. Nature, 408, 196–199.
Blaser, E., & Sperling, G. (2008). When is motion ‘‘motion’’? Perception, 37, 624–627.
Buhusi, C. V., & Meck, W. H. (2005). What makes us tick? Functional and neural mechanisms of interval timing.Nature Reviews Neuroscience, 6, 755–765. Chauhan, T., Perales, E., Xiao, K., Hird, E., Karatzas,
D., & Wuerger, S. (2014). The achromatic locus: Effect of navigation direction in color space. Journal of Vision, 14(1):25, 1–11, http://www. journalofvision.org/content/14/1/25, doi:10.1167/ 14.1.25. [PubMed] [Article]
Collins, C. J. S., Jahanshahi, M., & Barnes, G. R. (1998). Timing variability of repetitive saccadic eye movements. Experimental Brain Research, 120, 325–334.
DeLucia, P. R., & Liddell, G. W. (1998). Cognitive motion extrapolation and cognitive clocking in prediction motion tasks. Journal of Experimental Psychology: Human Perception and Performance, 24, 901–914.
de’Sperati, C., & Deubel, H. (2006). Mental extrapo-lation of motion modulates responsiveness to visual stimuli. Vision Research, 46, 2593–2601.
Hubbard, E. M., Piazza, M., Pinel, P., & Dehaene, S. (2005). Interactions between number and space in parietal cortex.Nature Reviews Neuroscience, 6, 435–448.
Journal of Experimental Psychology: Human Per-ception and Performance, 30, 431–444.
Ishihara, S. (1917).Test for colour-blindness. Tokyo: Hongo Harukicho.
Johnston, A., Arnold, D. H., & Nishida, S. (2006). Spatially localized distortions of event time. Cur-rent Biology, 16, 472–479.
Jonikaitis, D., Deubel, H., & de’Sperati, C. (2009). Time gaps in mental imagery introduced by competing saccadic tasks. Vision Research, 49, 2164–2175.
Lakens, D. (2013). Calculating and reporting effect sizes to facilitate cumulative science: a practical primer for t-tests and ANOVAs. Frontiers in Psychology, 4, 863.
Lee, D. N. (1976). Theory of visual control of braking based on information about time-to-collision. Perception, 5, 437–459.
Lisberger, S. G. (2010). Visual guidance of smooth-pursuit eye movements: Sensation, action, and what happens in between. Neuron, 66,477–491. Makin, A. D. J., & Bertamini, M. (2014). Do different
types of dynamic extrapolation rely on the same mechanism? Journal of Experimental Psychology: Human Perception and Performance, 40,1566–1579. Makin, A. D. J., & Poliakoff, E. (2011). Do common
systems control eye movements and motion ex-trapolation? Quarterly Journal of Experimental Psychology, 64, 1327–1343.
Makin, A. D. J., Poliakoff, E., Chen, J., & Stewart, A. J. (2008). The effect of previously viewed velocities on motion extrapolation. Vision Research, 48, 1884–1893.
Makin, A. D. J., Poliakoff, E., Dillon, J., Perrin, A., Mullet, T., & Jones, L. A. (2012). The interaction between duration, velocity, and repetitive auditory stimulation. Acta Psychologica, 139,524–531. Makin, A. D. J., Stewart, A. J., & Poliakoff, E. (2009).
Typical object velocity influences motion extrapo-lation. Experimental Brain Research, 193, 137–142. Peirce, J. W. (2007). PsychoPy—Psychophysics
soft-ware in Python. Journal of Neuroscience Methods, 162, 8–13.
Peterken, C., Brown, B., & Bowman, K. (1991).
Predicting the future position of a moving target. Perception, 20, 5–16.
Rao, S. M., Harrington, D. L., Haaland, K. Y., Bobholz, J. A., Cox, R. W., & Binder, J. R. (1997). Distributed neural systems underlying the timing of movements. Journal of Neuroscience, 17,5528– 5535.
Rizzolatti, G., Riggio, L., & Sheliga, B. M. (1994). Space and selective attention. In C. Umilta & M. Moscovitch (Eds.), Attention and performance XV: Conscious and nonconscious information processing. (Vol. 15,pp. 231–265). Cambridge MA: MIT Press. Rosenbaum, D. A. (1975). Perception and
extrapola-tion of velocity and acceleraextrapola-tion.Journal of Experimental Psychology: Human Perception and Performance, 1,395–403.
Sheth, B. R., Nijhawan, R., & Shimojo, S. (2000). Changing objects lead briefly flashed ones. Nature Neuroscience, 3, 489–495.
Tresilian, J. R. (1995). Perceptual and cognitive-processes in time-to-contact estimation: Analysis of prediction-motion and relative judgment tasks. Perception & Psychophysics, 57, 231–245.
van Rijn, H., Gu, B., & Meck, W. H. (2014). Dedicated clock/timing circuit theories of time perception and timed performance. In H. Merchant & V. de Lafuente (Eds.), Neurobiology of interval timing. New York: Springer-Verlag.
Walsh, V. (2003). A theory of magnitude: Common cortical metrics of time, space, and quantity.Trends in Cognitive Sciences, 7, 483–488.
Wearden, J. H., Edwards, H., Fakhri, M., & Percival, A. (1998). Why ‘‘sounds are judged longer than lights’’: Application of a model of the internal clock in humans. Quarterly Journal of Experimental Psychology Section B. Comparative and Physiolog-ical Psychology, 51, 97–120.
Wing, A. M. (2002). Voluntary timing and brain function: An information processing approach. Brain and Cognition, 48, 7–30.