Article
Prediction of Higher Heating Value, Lower Heating
Value and Ash Content of rice Husk Using FT-NIR
Spectroscopy
Natrapee Nakawajana
1,a, Jetsada Posom
2,3,b,*, and Jaruwat Paeoui
11 Department of Agricultural Engineering, Faculty of Engineering, King Mongkut’s Institute of Technology
Ladkrabang, 1 Chalongkrung Road, Ladkrabang, Bangkok 10520, Thailand
2Applied Engineering for Important Crops of the North East Research Group, Khon Kaen University,
Khon Kaen 40002, Thailand
3 Department of Agricultural Engineering, Faculty of Engineering, Khon Kaen University, Khon Kaen
40002, Thailand
E-mail: a[email protected], b[email protected] (Corresponding author)
Abstract. Rice husk is the significant waste residue to be used as renewable energy. The
growth of the use on rice husk for generating electricity lead to the verification of its properties. This research aimed to predict higher heating value (HHV), lower heating value (LHV), and ash content (A) of rice husk using Fourier Transform near infrared (FT-NIR) spectroscopy. Rice husk samples used in this experiment were collected from variable areas in Thailand in order to improve the model and get the robust model. The models were built using partial least squares (PLS) regression and validated by unknown sample collected from different area to calibration set. The prediction of HHV, LHV and A were represented the root mean square error of cross validation (RMSECV) of 119 J/g, 119 J/g, and 0.859%wb, respectively. The calibration model can predict the unknown sample successfully with the relative standard error of prediction (RSEP) of 1.104 %, 1.159 %, and, 5.975 %, which implied good performance of NIR model for future prediction. The results suggested that HHV, LHV, and A models should be able to assess the properties of rice husk samples and showed that NIR was reliable and suitable method for combustion system to screening material.
Keywords: Higher heating value, lower heating value, ash content, near infrared
spectroscopy, rice husk.
ENGINEERING JOURNAL Volume 22 Issue 5
Received 1 May 2018 Accepted 9 July 2018
1.
Introduction
Rice has been the second important agricultural crop as the main food worldwide [1]. Rice husk is considered as one of the source of renewable energy generated from residue of rice. The energy potential from rice husk per year, reported that Asia established about 121,940×1000 ton from 134,000×1000 ton of worldwide, while energy potential was 1828 (PJ) from 2010 (PJ) of worldwide [2]. It can be seen that Asia is the source of rice husk. Rice husk is the main byproduct of industrial rice mill plant. It is widely used as energy resource in Thailand. Under Thailand 4.0 policy as an Alternative Energy Development Plan: AEDP2015 (2015-2036), Ministry of Energy wants to increase the use of biomass for generating the heat combustion (5,144.00 ktoe to 22,100.00 ktoe) and electricity (2,451.82 MW to 5,570.00 MW) [3]. The agricultural residues such as rice husk, bagasse, straw, and cassava rhizome, have been pointed to be renewable energy. Especially in rice husk, there were reports that rice production was about 21,083×103 ton per year [4], the rice husk was around 8,145×103 ton per year [3]. Rice husks are significant renewable energy resources for bioenergy industries in Thailand. The electric energy consumption of approximately 1,183,271 kWh/year was used for rice mills process [5], then around 99.24% of rice husk has been used in rice mill plant for generating heat combustion [3]. Hence the rice husks could be applied as a renewable energy resource for the rice milling process.
The major aspect of waste residue properties to be renewable energy is the energy content or heating value (HV) [6], and ash (A) content [7]. HV is total energy in biomass released during burning process [8]. Heating value (HV) and A content are necessary factor for designing and controlling the combustion system [9]. In thermal conversion process, the knowledge of HV and A content is used to achieve the burner efficiency. In the power plant, used the rice husk gotten from different area, specie, and harvesting time. Therefore, its chemical properties were different. Especially, the old rice husk kept for many years lead to its properties is changed, the volatile and HHV become to low. As we known, low volatile lead to high ignition point and low HHV, and then the boiler trips over. Therefore, the knowledge of rice husk characteristics is essential before burning.
HV is divided into higher heating value (HHV) and lower heating value (LHV) [10]. The HHV represents the amount of heat released when mass is burnt completely [11] and ‘the combustion products was cooled under standard conditions’ [12], meanwhile, LHV is the energy of material without the heat of vaporization of the moisture content in the material. Then HHV can be converted to LHV directly. The A content is the solid residue after burn, which does not give energy. It affects the combustion efficiency, leading toward the problems of burner and heat exchange devices as well [13-14].
improve the efficiency of the thermal combustion system and should be incorporated into a commercial biomass facility. To our knowledge, there have been no published information existing on HHV, LHV and A modeling of rice husk biomass using FT-NIR spectroscopy. So, the objective of this study was to predict the HHV, LHV, and A of global rice husk as an alternative to current methods. In order to achieve this result, the model was developed with the variable spectral preprocessing technique and the rice husk sample was collected from the variable area from Thailand. Next, to confirm the performance of model, the unknown sample kept from different area were predicted its properties by calibration model again. The global models would offer benefits to commercial agricultural waste i.e. rice husk, and their knowledge could be used for effective screening to select the high-quality rice husk before it is burn in factory.
2.
Material and Method
2.1. Sample
In the first step, the rice husk samples were randomly obtained from different mill rice plants (10 mill rice plants). Fifty samples were used for calibration model. In the second step, 2 months later, 15 samples were obtained from another mill rice for unknown sample set (5 mill rice plants). The performance of the model on validated unknown samples was determined to ensure whether the developed model can be used suitably because their results will be the real performance for future sample. The samples were formed by crushing 200 g of rice husk in a blender (FRITSCH, 14.3000/10857, Germany) for 5 min, followed by passing the blended powder through a perforated screen with hole sizes of 2.00 mm. Each sample was kept in an aluminum bag until experiment.
2.2. NIR Spectral Acquisition
Each milled sample was poured into a quartz bottom sample cup (43 mm in diameter and 50 mm in height). The height of cup must be ensured that there is no NIR radian leaked for measurement in diffuse reflectance mode. Fourier-transform infrared spectroscopy (FT-NIR) (MPA, Bruker, Germany) was used for scanning. The NIR spectra were obtained in a diffuse reflectance mode using log 1/R unit. Scanning conditions: resolution was 8 cm−l, wavenumber range was 12500-4000 cm-1, and the number of scanning
was 32. Each reported spectrum was obtained by averaging 32 repeat spectra.
2.3. Reference Data
After the rice husk samples were scanned, the samples at the bottom of cup were used for reference analysis because of direct illumination by NIR radiation. They were separated into two parts. The first part
was used for determining moisture content (MC) by dry oven method. The samples were dried at 105 ๐C
and weighted in every 6 hrs until constant weight is obtained. Three replicates were used per sample. The second part was used to determine HHV, about 0.5 g was compressed into a pellet. After that, the HHV and A were determined using a bomb calorimeter (C200, IKA, Germany) in isoperibol mode. Before operation, the sample vessel was calibrated using pelletized benzoic acid (IKA C 723, IKA, Germany). The pelleted sample was placed within the vessel and heated. After burning, residue mass was weighted by digital balance (Adventure AR2140, OHAUS, resolution of 0.0001 g) and A was calculated as (mi-mf)
×100/mi where mi represents the initial weight of rice husk sample and holder sample together, and mf
represents the final weight of rice husk and holder sample together after burn. The HHVwb (J/g) can
convert to LHVwb directly when moisture content (%wb) is known, LHVwb was then determined as follows
[25]:
LHVwb=HHVwb-2433×MC
where LHVwb was the lower heating value (J/wet g), HHVwb was the higher heating value (J/wet g), 2443
was the latent heat of the vaporization of water at 25 ๐C (J/g), and MC was the moisture content on a weight wet basis (%wb) obtained from air drying oven. After the HHV, LHV, and A were measured, the outliers were then calculated as (Xi−X̅)
average and standard deviation of the measured values of all samples, respectively. When the samples were an outlier, it was then removed from the measured data set.
2.4. Repeatability and Maximum Coefficient of Determination (𝐑𝐦𝐚𝐱𝟐 )
After the HHV, LHV, and A were determined, the precision of reference method and NIR spectra acquisition were calculated. The repeatability was the absolute standard deviation of the difference between duplicates. The repeatability of measured value can be used to calculate the maximum coefficient of determination (Rmax2 ). It was calculated using following formula[26]:
R2max=SDy2− Rep2 SDy2
where SDy is the standard deviation of reference value. Rmax2 is possible only when there are no errors in
the spectra or the model. Rep was the repeatability and was calculated by √∑ (|𝑑|−
∑ |𝑑|𝑚1 𝑚 )
2 𝑚
1
𝑚−1 , when d is the
difference between duplicate, m is number of sample.
2.5. Data Processing and NIR Spectroscopy Modelling
The NIR spectroscopy models for predicting the HHV, LHV, and A of the rice husk were established using PLS (partial least squares) regression and were validated via full cross validation (leave one out strategy). Both spectral pre-processing and model development were performed by OPUS software, version 7.0.129, Germany. Before the modelling, the NIR spectra were pretreated using constant offset elimination, straight line subtraction, vector normalization, min-max normalization, MSC (multiplicative scatter correction), first derivatives, second derivatives, first derivatives + straight line subtraction, first derivatives + vector normalization and first derivatives + MSC, were used for pretreating the NIR spectra. These spectral pre-processing were used based on the previous study by the same authors [21].
The optimum model that presented the lowest root mean squares error of cross validation (RMSECV) was selected, including numbers of latent variables (numbers of PLS factor), spectral pre-preprocessing methods, and wavenumber range. The regression coefficient and X-loading plot versus wavenumber were illustrated. Any wavenumber that shows a high regression and X-loading value means that this wavenumber has the high influence for predicted value and model development, respectively.
2.6. Performance Analysis
The performance of the HHV, LHV, and A model were represented by determination of the coefficient of determination (R2), bias, root mean square error of cross validation (RMSECV) and ratio of standard error
of cross-validation to deviation (RSCD), and relative standard error of prediction (RSEP), which can be calculated with the equations:
R2= 1 −∑ (y𝑚𝑖 i− 𝑦̂𝑖)2 ∑ (y𝑚𝑖 i− y̅)2
RMSECV = √∑ (yi− 𝑦̂𝑖)2 n
1 m
Bias =∑ (yi− 𝑦̂𝑖) 𝑚
1 m
RSCD = SD
RSEP = √∑(𝑦𝑖− 𝑦𝑝𝑟𝑒)2 ∑ (𝑦𝑚1 𝑖)2 𝑚
1
where 𝑦 is the reference value, 𝑦̂ is the predicted value, 𝑦̅ is the average of reference value, and m is the number of sample. R2 stated the percentage of proportion of the variance in reference data that can be
counted by variance in absorption data [2 7 ]. For example, the R2 equals to 0.92 means that 92 % was
explained variance by NIR spectra, meanwhile 8 % was unexplained variance which could not be explained by NIR spectra. For the RMSECV, the value was the average of uncertainly error which will be judged for predicting the future sample [28]. Bias defined the overall accuracy of the developed model [27]. For RSCD, low value means the reference data is narrow or model gives a high SECV, then that modelling is not necessary [27].
After that, the performance of calibration model was validated again using unknown samples set, which were collected from another mill rice plant, which must be different resource from calibration set to ensure that developed model can be used for future sample. The prediction performance of unknown samples was represented by standard error of prediction (SEP) bias and, RSEP.
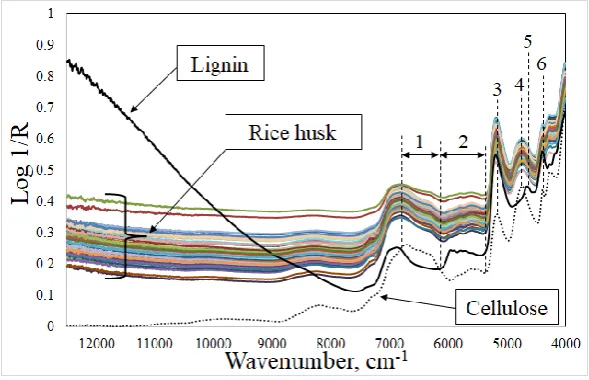
Fig. 1. Rice husk spectra compared to lignin and cellulose.
3.
Results and Discussions
3.1. Rice Husk Spectra
The near infrared spectra of 65 ground rice husk biomass samples, pure cellulose, and pure lignin in range of 12500-4000 cm-1 were demonstrated in Fig. 1. Peaks in ranges 1 and 2 represented the different
absorptions between cellulose and lignin. It was observed that the vibration band of the range 1 was the cellulose band (low absorption for lignin), meanwhile the range 2 was the lignin band (low absorption for cellulose), corresponding to the fact that the rice husk contains of cellulose and lignin. In the raw spectra of rice husk, the main absorption bands were observed at 6897 cm-1 (1450 nm) related to O-H stretch first
overtone of water and starch [17, 29], at peak 3 (at around 5250-5106 cm-1 (1905 -1958 nm)) related to
vibration band of starch (1930 nm) and water (1940 nm) [29]. Peak 4 (4771 cm-1 (2100 nm)) was high
absorption for rice husk and cellulose, which corresponded to starch [29], meanwhile peak 5 (4632 cm-1
(2158 nm)) was high absorption for lignin only. At peak 6 (4397 cm-1 (2274 nm)) and 7 (4254 cm-1 (2351
nm)) corresponded to O−H stretch/C−O stretch combination and CH2 bend second overtone of cellulose
[image:5.595.150.445.305.495.2]3.2. Reference Data of the HHV, LHV and A
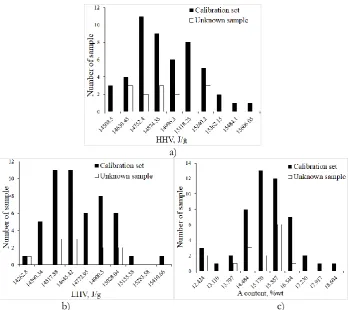
Statistical data of total data set and unknown sample set for HHV, LHV and A content of rice husk was demonstrated in Table 1, it listed the number of sample, range, maximum, minimum, and standard deviation (SD). HHV, LHV, and A of calibration set were in a range of 14508.5 to 15728 J/g, 14262.8 to 15538.2 J/g, and 12.0595 to 19.290 %wb, respectively. Figure 3 displayed the histograms of the all parameters (HHV, LHV, and A contents) for calibration set and unknown sample set, which were normally distributed.
a)
b) c)
Fig. 2. Frequency histograms of reference parameters, a) HHV, b) LHV, and c) A content.
The repeatability (Rep) and maximum R2 (R2max) of HHV, LHV, and A contents are equal to 61.496 J/g,
61.496 J/g and 0.469 %wb; and 0.941, 0.940, and 0.900, respectively. The R2max stated the maximum performance of NIR model if there were no error from NIR spectra [26]. Hence, the unexplained variance got from reference method were 5.9, 6 and 10 %, respectively, which was acceptable. These NIR models should be developed.
Table 1. Statistical data of HHV, LHV and A content of rice husk biomass for model development and unknown sample.
Data set Parameters N Range Max Min Average SD
Total sample set
HHV (J/g) 50 1219.5 15728 14508.5 15000.56 254.456
LHV (J/g) 50 1275.4 15538.2 14262.8 14777.678 256.740
Ash (%wb) 50 6.866 19.290 12.424 15.702 1.262
Unknown sample set
HHV (J/g) 15 718 15345 14627 14963.6 246.728
LHV (J/g) 15 712.7 15092.9 14380.2 14729.753 237.234
Ash (%wb) 15 4.717 16.777 12.0595 15.166 1.381
[image:6.595.124.474.187.497.2] [image:6.595.66.533.647.732.2]3.3. Near Infrared Spectroscopy Models for HHV, LHV and A of Rice Husk
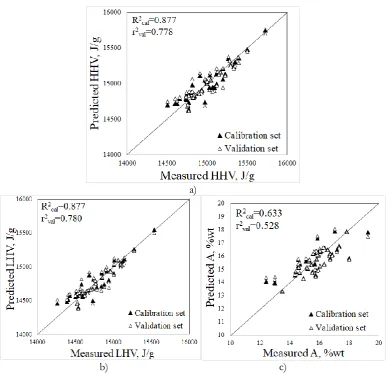
The performance of calibration model for predicting HHV was demonstrated in Table 2. The effective calibration model was established using the wavenumber range of 7425-5446.3 and 4601.6-4246.7 cm-1. The
spectral preprocessing of MSC and the number of PLS factor listed from 1 to 7 was utilized. The effective model was selected due to the lowest RMSECV. The PLS model validated using leave-one-out cross-validation (LOOCV) provided R2cal, RMSE, r2val, RMSECV, bias, and RSCD of 0.877, 96.5 J/g, 0.778, 119 J/g, -2.49 J/g, and 2.12, respectively. For LHV model, the best model was established using the wavenumber range of 7425-5446.3 and 4601.6-4246.7 cm-1 with spectral preprocessing of MSC and the
number of PLS factor of 7 was used. The PLS model provided R2cal, RMSE, r2val, RMSECV, bias, and RSCD of 0.877, 97.2 J/g, 0.780, 119 J/g, -2.52 J/g, and 2.13, respectively. Zornoza et al. [31] indicated the if R2 and RPD between 0.66 to 0.80 and 2.0 to 2.5, it permitted only approximate prediction and could be
used with screening and some other “approximate” calibrations [27]. However, the ratio of bias to mean of reference value were 0.0165 % (-2.49 J/g÷ 15000.56 J/g) for HHV and 0.0170 % (-2.52 J/g÷14777.678 J/g), which were very small. The author opinioned that the models were acceptable for estimation of the HHV and LHV of rice husk.
a)
b) c)
Fig. 3. Scatter plot between measured value and predicted value for calibration set and validation set for a) HHV, b) LHV, and c) A content.
For A content, the wavenumber range of 4763.6-4246.7 cm-1 and the number of PLS factor of 4 and
spectral preprocessing of straight line subtraction were utilized to establish the PLS model. The
performance of PLS model provided R2cal, RMSE, r2val, RMSECV, bias, and RSCD of 0.633, 0.799 %wb,
0.528, 0.859 %wb, -0.0101 %wb and 1.46, respectively. The R2 and RPD provided were less than 0.66 and 2,
[image:7.595.104.493.284.657.2]0.50 and 0.64 could be used for rough screening. In the author’s opinion, with a low bias of approximately 0.0643 % of the mean value (-0.0101 %wb/15.702 %wb), it was possible for prediction of the A ash content of rice husk.
The models by Saha et al. [6] to predict the gross calorific value, net calorific value, and A content of pine biomass samples gave a comparable result. They reported the R2 of 0.84, SECV of 67.5 Cal/g, and
RSCD of 2.31 for net calorific value; the R2 of 0.83, SECV of 68 Cal/g, and RSCD of 2.32 for gross
calorific value; and the R2 of 0.87, SECV of 0.50 %, and RSCD of 2.65 for A content.
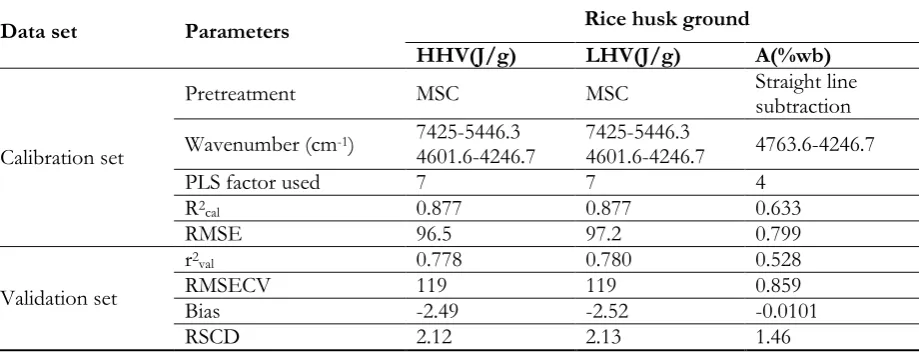
Table 2. Results for the calibration set and validation set for HHV and ash content of rice husk and rice husk milled.
Data set Parameters Rice husk ground
HHV(J/g) LHV(J/g) A(%wb)
Calibration set
Pretreatment MSC MSC Straight line subtraction
Wavenumber (cm-1) 7425-5446.3
4601.6-4246.7 7425-5446.3 4601.6-4246.7 4763.6-4246.7
PLS factor used 7 7 4
R2cal 0.877 0.877 0.633
RMSE 96.5 97.2 0.799
Validation set
r2val 0.778 0.780 0.528
RMSECV 119 119 0.859
Bias -2.49 -2.52 -0.0101
RSCD 2.12 2.13 1.46
MSCis Multiplicative scattering correction, R2cal is coefficient of determination for calibration set, r2val is coefficient of determination for validation set, HHV is higher heating value, LHV is lower heating value, A is ash content, RMSE is root mean square of estimation, RMSECV is root mean square of cross validation, RSCD is ratio of standard error of cross-validation to deviation.
The regression coefficient and X-loading plot of HHV and LHV were similar and they were illustrated in Fig. 4a and b; and Fig. 5a and b, respectively. The obvious peaks occurring on regression coefficient plot were at 5982 cm-1 (1671 nm), 4602 cm-1 (2172 nm), and 4443 cm-1 (2250 nm). The wave band at 2170 nm
corresponds to Asym C−H stretch/C−H deformation combination of HC=CH [29]. A high absorption for X-loading plot at LV_1 were around 5805 cm-1 (1722 nm), and 7085 cm-1 (1411 nm) related to C-H stretch
first overtone of CH2 [32] and C−H combination of CH2 [29], respectively. The major component of
biomass including hemicellulose, cellulose, and lignin was the source of energy. As seen in the result, the vibration band of HC=CH and CH2 were the important peak because they were structure of lignin and
cellulose, respectively. This result was in good agreement with Posom and Sirisomboon [15]. They reported that the molecule of CH2, CH3, HC=CH had high effect on the prediction of the lower heating value of
bamboo. Posom and Sirisomboon [33] reported the vibration band of cellulose and fiber had high influence on the prediction of the heating value of the oil extracted residue of Jatropha curcas kernels. Zhang et al. [20] suggested the important vibration band in order to assess HHV of sorghum was the C-H stretching of aromatic and CH3 structure.
The regression coefficient, X-loading plot of A content model were illustrated in Fig. 4c and 5c, respectively. The distinct peaks were found in range of 4763.6-4246.7 cm-1 (2100-2355 nm) corresponded
to C-H stretching/bending and O-H stretching/bending of starch and cellulose [29]. Although A content cannot be predicted directly because of inorganic containing SiO2, Al2O3, TiO2, Fe2O3, CaO, MnO, MgO,
Na2O, K2O, SO3, P2O5, and other [2], NIR does not interact with them. The authors opinioned that NIR
[image:8.595.68.528.219.395.2]a)
b) c)
Fig. 4. Regression coefficient of a) HHV, b) LHV, and c) A content in PLS model.
a)
b) c)
[image:9.595.86.513.76.365.2] [image:9.595.81.517.402.685.2]a)
b) c)
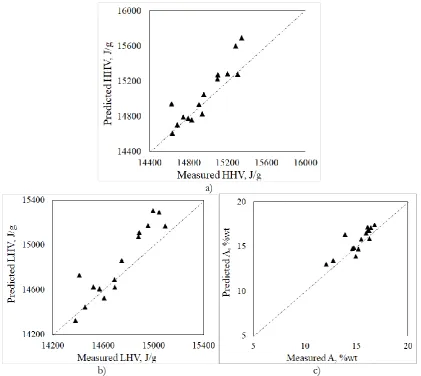
Fig. 6. The scatter plots between measured value and predicted value obtained from NIR measurement of unknown sample for a) HHV, b) LHV and c) A.
Table 3. Results for the unknown for HHV and ash content of rice husk and rice husk milled.
Rice husk milled
Parameters HHV LHV Ash
SEP 146 (J/g) 137 (J/g) 0.796 (%wb)
Bias -86.5 (J/g) -108 (J/g) -0.486 (%wb)
RSEP 1.104 (%) 1.159 (%) 5.975 %
SEP is standard error of prediction.
RSEP is relative standard error of prediction, %.
3.4. Re-validated via Unknown Sample
[image:10.595.88.510.77.453.2] [image:10.595.86.506.528.596.2]4.
Conclusions
The results showed that NIR spectroscopy could be used as a nondestructive technique for quality assurance and the prediction of HHV, LHV, and A content of rice husk. The model for HHV and LHV gave a high performance with the validation set and unknown sample set. Although A content model provided low R2 when validated by cross validation, the performance of calibration model for the
prediction of unknown sample set gave a low SEP, bias and RSEP, meaning that the calibration model was acceptable. It implies that the unknown sample was the representative population for future, hence the
result of predicted unknown sample should be considered. The vibration band of CH2 and HC=CH which
was in the cellulose and lignin structure had high impact on the HHV and LHV model. Our knowledge could be used to optimize the heat combustion process for rice husk power plant. In addition, this rapid measurement and non-destructive method could be used to set a fair price instead of weight for commercial.
Acknowledgments
The authors thank the Near Infrared Spectroscopy Research Center for Agricultural Product and Food (www.nirsresearch.com) at King Mongkut’s Institute of Technology Ladkrabang, Bangkok, Thailand, for the use of their instruments. We also acknowledge the financial support from the King Mongkut’s Institute of Technology Ladkrabang Research Fund.
References
[1] I. J. Fernandes, D. Calheiro, A. G. Kieling, C. A. M. Moraes, T. L. A. C. Rocha, F. A. Brehm, and R. C. E. Modolo. “Characterization of rice husk ash produced using different biomass combustion techniques for energy,” Fuel, vol. 165, pp. 351–359, 2016.
[2] I. Quispe, R. Navia, and R. Kahhat, “Energy potential from rice husk through direct combustion and fast pyrolysis, A review,” Waste Management, vol. 59, pp. 200–210, 2017.
[3] Thailand Ministry of Energy, Department of Energy. (2015). Alternative Energy Development Plan:
AEDP2015 [Online]. Available: http://www.dede.go.th/download/files/
AEDP2015_Final_version.pdf
[4] Thailand Ministry of Agriculture and Cooperatives, Office of Agricultural Economics. (2016).
Agricultural Statistics of Thailand [Online]. Available:
http://www.oae.go.th/download/download_journal/2560/yearbook59.pdf
[5] A. Pachanawan, S. Chuan-Udom, K. Saengprachatanarug, and S. Wongpichet, “Electrical energy consumption and energy conservation of rice mills in the northeastern of Thailand,” Engineering Journal, vol. 21, no. 4, pp. 73-82, 2017.
[6] U. K. Saha, L. Sonon, and M. Kane, “Prediction of calorific values, moisture, ash, carbon, nitrogen, and sulfur content of pine tree biomass using near infrared spectroscopy,” J Near Infrared Spectroscopy, vol. 25, no. 4, pp. 242–255, 2017.
[7] C. D. Everard, K. P. McDonnell, and C. C. Fagan, “Prediction of biomass gross calorific values using visible and near infrared spectroscopy,” Biomass Bioenergy, vol. 45, pp. 203–211, 2012.
[8] S. Hosseinpour, M. Aghbashlo, M. Tabatabaei, and M. Mehrpooya, “Estimation of biomass higher heating value (HHV) based on the proximate analysis by using iterative neural network-adapted partial least squares (INNPLS),” Energy, vol. 138, pp. 473-479, 2017.
[9] A. Friedl, E. Padouvas, H. Rotter, and K. Varmuza, “Prediction of heating values of biomass fuel from elemental composition,” Anal Chim Acta, vol. 544, pp. 191–198, 2005.
[10] C. Y. Yin, “Prediction of higher heating value of biomass from proximate and ultimate analyses,” Fuel, vol. 90, pp. 32-1128, 2011.
[11] H. Uzun, Z. Yıldız, J. L. Goldfarb, and S. Ceylan, “Improved prediction of higher heating value of biomass using an artificial neural network model based o proximate analysis,” Bioresour Technol, vol. 234, pp. 122–130, 2017.
[13] I. Lewandowski and A. Kicherer, “Combustion quality of biomass: Practical relevance and experiments to modify the biomass quality of Miscanthus x giganteus,” Eur J Agron, vol. 6, no. 3-4, pp. 77-163, 1997.
[14] M. K. Misra, K. W. Ragland, and A. J. Baker, “Wood ash composition as a function of furnace temperature,” Biomass Bioenergy, vol. 4, no. 2, pp. 16-103, 1993.
[15] J. Posom and P. Sirisomboon, “Evaluation of lower heating value and elemental composition of bamboo using near infrared spectroscopy,” Energy, vol. 121, pp 147-158, 2017.
[16] Energy for Environment Foundation. (2018). Biomass price [Online]. Available:
http://www.efe.or.th/efe-book.php?task=25
[17] B. G. Osborne and T. Fearn, Near Infrared Spectroscopy in Food Analysis. London: Longman Science and Technical, 1986.
[18] J. Workman and J. R. L. Weyer, Practical Guide to Interpretive Near-Infrared Spectroscopy. Boca Raton, FL: Taylor and Francis, 2007, pp. 240-262.
[19] J. Posom and P. Sirisomboon, “Evaluation of higher heating value, volatile matter, and ash content of bamboo using near infrared spectroscopy,” J Near Infrared Spectrosc, vol. 25, no. 5, pp. 301-310, 2017.
[20] K. Zhang, L. Zhou, M. Brady, F. Xu, J. Yu, and D. Wang, “Fast analysis of high heating value and
elemental compositions of sorghum biomass using near-infrared spectroscopy,” Energy, vol. 118, pp. 1353-1360, 2017.
[21] J. Posom, A. Shrestha, W. Saechua, and P. Sirisomboon, “Rapid non-destructive evaluation of moisture content and higher heating value of Leucaena leucocephala pellets using near infrared spectroscopy,” Energy, vol. 107, pp. 464-472, 2016.
[22] J. Xue, Z. Yang, L. Han, Y. Liu, Y. Liu, and C. Zhou, “On-line measurement of proximates and lignocellulose components of corn stover using NIRS,” Appl Energ, vol. 137, pp. 18–25, 2015.
[23] G. E. Acquah, B. K. Via, O. O. Fasina, and L. G. Eckhardt, “Non-destructive prediction of the properties of forest biomass for chemical and bioenergy applications using near infrared spectroscopy,”
J. Near Infrared Spectroscopy, vol. 23, pp. 93–102, 2015.
[24] G. D. Gillespie, C. D. Everard, and P. K. McDonnell, “Prediction of biomass pellet quality indices using near infrared spectroscopy,” Energy, vol. 80, pp. 582-588, 2015.
[25] D. Komilis, K. Kissas, and A. Symeonidis, “Effect of organic matter and moisture on the calorific value of solid wastes: an update of the Tanner diagram,” Waste Manag, vol. 34, pp. 55-249, 2014.
[26] P Dardenne, “Some considerations about NIR spectroscopy: Closing speech at NIR-2009,” NIR News,
vol. 21, pp. 8–14, 2010.
[27] P. Williams, Near-Infrared Technology Getting the Best Out of Light Edition 5.0. A Short Course in the Practical
Implementation of Near-infrared Spectroscopy for the User. Nanaimo, Canada: PDK Grain, 2007.
[28] B. M. Nicolaï, K. Beullens, E. Bobelyn, A. Peirs, W. Saeys, K. I. Theron, and J. ‘Lammertyn, “Nondestructive measurement of fruit and vegetable quality by means of NIR spectroscopy: A review,”
Postharvest Biol. Technol, vol. 46, pp. 99-118, 2007.
[29] S. S. John, J. W. Jerome, Jr., and O. W Mark, “NIRS Applications in Agricultural Products,” in
Handbook of Near-Infrared Analysis, 3rd ed. CRC press, 2007, pp. 347-386.
[30] N. Zhao and B. X. Li, “The effect of sodium chloride on the pyrolysis of rice husk,” Appl Energ, vol. 178, pp. 346–352, 2016.
[31] R. Zornoza, C. Guerrero, J. Mataix-Solera, K. M. Scow, V. Arcenegui, and J. M. Beneyto, “Near infrared spectroscopy for determination of various physical, chemical and biochemical properties in Mediterranean soils,” Soil Biol Biochem, vol. 40, no. 7, pp. 30-1923, 2008.
[32] H. Baillères, F. Davrieux, and F. Ham-Pichavant, “Near infrared analysis as a tool for rapid screening of some major wood characteristics in a eucalyptus breeding program,” Annal Forest Sci, vol. 59, pp. 90–479, 2002.
[33] J. Posom and P. Sirisomboon, “Evaluation of the moisture content of Jatropha curcas kernels and the heating value of the oil-extracted residue using near-infrared spectroscopy,” Biosyst Eng, vol. 130, pp. 52-59, 2015.