This is a repository copy of
A methodical approach to word class formation using
automatic evaluation
.
White Rose Research Online URL for this paper:
http://eprints.whiterose.ac.uk/82271/
Proceedings Paper:
Hughes, J and Atwell, ES (1994) A methodical approach to word class formation using
automatic evaluation. In: Evett, L and Rose, T, (eds.) Proceedings of the 1994 AISB
Workshop on Computational Linguistics for Speech and Handwriting Recognition. 1994
AISB Workshop on Computational Linguistics for Speech and Handwriting Recognition, 12
April 1994, University of Leeds, UK. AISB , 41 - 48.
[email protected]
https://eprints.whiterose.ac.uk/
Reuse
Unless indicated otherwise, fulltext items are protected by copyright with all rights reserved. The copyright
exception in section 29 of the Copyright, Designs and Patents Act 1988 allows the making of a single copy
solely for the purpose of non-commercial research or private study within the limits of fair dealing. The
publisher or other rights-holder may allow further reproduction and re-use of this version - refer to the White
Rose Research Online record for this item. Where records identify the publisher as the copyright holder,
users can verify any specific terms of use on the publisher’s website.
Takedown
If you consider content in White Rose Research Online to be in breach of UK law, please notify us by
Formation Using Automatic Evaluation
John Hughes and Eric Atwell
CentreforComputerAnalysisofLanguageand Sp eech e-mail: [email protected]
Scho olofComputerStudies eric@scs .leeds.ac.uk
Leeds University phone: +44(0)532335430
Leeds LS29JT,UK fax: +44(0)532335468
Abstract
Automaticinferenceofaclassicationofwordshasb eencarriedoutbyseveralresearchersrecently.
Although they use a variety of metho ds they all exploit the statistical redundancy inherent in the
structure oflanguagetodierentiatewords; theassumptionb eing thatwordsofsimilarr^oleso ccurin
measurablysimilarcontexts.
Thispap erdescrib esageneralmetho dbywhichclusteringschemescanb equalitativelycompared.
Thisallowsasystematicapproachtondingtheb estwordclassformationschemetob eadopted. The
pro cess by whichwords are automatically group edinto classes involves anumb erof decision p oints.
Theseinclude: thecontextualpattern inthelanguageb eingmeasured;themetricbywhichwordsare
comparedaccordingtothepattern;andthemechanismbywhichitemsjudgedtob esimilararemerged.
Alternativesarepresented foreachof thesefactors. Theexp erimentsrated eachcombinationso that
themostsuccessfulapproachcanb efound. Previously,researchersreliedonalooks-good-to-memetho d
ofselfevaluationtojudgethequalityoftheirderivedwordclassications. Thispap erdirectlycompares
someoftheiradopted approacheswithalternativeclusteringschemes notpreviouslyattempted. This
allowsustoformallydemonstratewhenourapproachtoclusteringis moresuccess ful. Theevaluation
metho disalsoshowntob eavaluableaidto highlightingapproachesthat areinecient.
Amongstthepatternsinvestigatedwerethemorphologicalcontextsuppliedbythepreviouswords.
Bigramcounts ofthe collo cationof the wordsto b e clustered with thelast three letters of the word
immediatelyb eforewerefoundtob earemarkablygo o ddierentiationcriteria. Theevaluationmetho d
demonstratedthatthecontextofthelastthreeletters(whichonaveragecontainalotofmorphological
informationinEnglish)isevenb etterthatthecontextsuppliedbyusingthewholeofthepreviousword
incollo cationcounts. Resultssuchasthisshouldproveusefultohandwritingrecognitionresearch. The
authors b elievethis metho dprovidesasensiblerststep forhandwriting recognitionresearchers who
wish to use statistical mo dels of language to aid the disambiguation pro cess; prop osed contextual
mo delscan b e evaluated relativeto previouslyinvestigatedmo delsto indicate the likelysuccess rate
ofemployingthem. Thisallowsaprop osed p o ordisambiguationmetho dtob eruled outearlyonand
thusisavaluableaidtosavingvaluabletimeandresources .
We end by considering some further applications of automatic word class formation techniques.
Although ourexp erimentsare exclusively with Englishcorpus text, thegeneral clustering and
word-classifyingalgorithmsshouldb eapplicabletotext inotherlanguages. Thisislikelytob eparticularly
usefulindevelopmentoflinguisticengineeringtechnologiesforemergingnationsandtheirnewmother
tongues, which have little or no computational linguistics resources or computationallinguistics to
\hand-craft"them.
1 Introduction
Hierarchical clustering is a way to pro duce a taxonomic classication of items such
that, for a given cut-o p oint, the cut-o groups contain homogenous objects whilst
the groups are as heterogeneous amongst themselvesas p ossible. The itemsmust have
initiallyb een compared with each other in such a wayas there is a standard measure
of similarity b etween each pair. The pro cess b egins by nding the closest two items
and replacing them by a measurement which represents the union of the two in some
twonew items. The itemsare collapsed in this way,iteratively,until all itemsb ecome
merged intothe samegroup. As twoitems(or groups of items)merge a record iskept
of their similarity and a dendrogram forms. The metho d is describ ed in further detail
in[Hughes 94], [Hughesand Atwell93, 94].
There are several patterns in language that can provide a measure of similarity
for words. N-gram counts of words have traditionally b een the most commonly used
measure but others such as the p ositional distribution of words might supply a useful
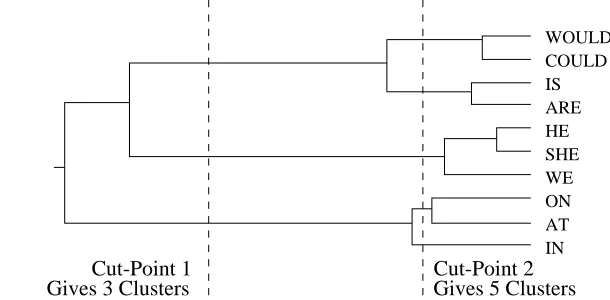
[image:3.612.200.505.181.331.2]context also. An exampledendrogramis displayedingure 1, b elow.
Figure 1:
An Example
Dendogram
Showing
Cut-Points
Cut-Point 1
Gives 3 Clusters
Gives 5 Clusters
Cut-Point 2
WOULD
IN
COULD
IS
ARE
ON
AT
SHE
HE
WE
The cut-p ointlinesare added forexplanation (seesection 2.2) but the remainderof
the diagram isof the formautomatically generatedby the clusteringprogram.
The choice of algorithm to calculate the distance of the twonewly clustered items
to the otheritemsas wellas the distancemetrictoinitiallycomparevectorscan havea
profoundinuenceon theclustering. Eachcombinationofmetricandclusteringmetho d
was tried inthe exp eriments to see which derived the strongest syntactic classication
of wordsin comparison to an intuitivelinguisticclassication (bythe evaluation
mech-anisms describ ed b elow). Three metrics were considered here: Manhattan, Euclidean
and Sp earman Rank Correlation Co ecient. The latter follows the mo died denition
givenby [Finch 93] so that our results can b e directlycompared. Likewise,the choice
of clustering metho d can greatly alter the resultant dendrogram after clustering; eight
metho ds were included in the exp eriments describ ed here. [Zupan 82] gives iterative
formulae for seven of the metho ds. The other clustering metho d uses the geometric
centreofgravitytocalculatethe dissimilarityb etweenthe mostrecentlyjoinedpairand
allother items.
2 Automatic Evaluation
The last essential part of the automatic word classication pro cess is some means of
rating the quality of the alternative clustering schema for their accuracy. Other word
classication projectshavefailedto includethis vitalpro cedure.
2.1 Looks Good to Me
Evaluating a clustering is typically done by the programmer using a looks good to me
an-However, the programmer also has a vested interest in making his/her program lo ok
go o d. Amoreworthyevaluation canb e done byan \indep endent"exp ert-inthis case
alinguist. Itisrareto ndonethathasnobiasinsomewaybutthelinguist'sjudgement
based onexp eriencemustrate his/herappraisal ab ovethatof theprogrammerwho has
a vestedinterestto b e seen to havedone go o d work.
Theseevaluationsarealldonewithsomepreconceivedintuitiveclassicationinmind.
The actual question of whatmakesa go o d classication is not asimpleone to answer.
There are many alternatives and deciding which is sup erior comes down to p ersonal
judgement. Two rival clusterings may pro duce one winnerwhen judged byone exp ert
linguistbuttheotheraccordingtoadierentlinguist'sintuition. Thelinguist'sintuition
do es not involvequantitative,measurable criteria, onlyqualitativeoverallimpressions.
The looksgoodto me approachmayb eneif theaimisto merelydemonstratethat
patternsintextcanclassifywords. Thisinitselfisalaudableaimbutiftheb estp ossible
classication isdesired then somewayof comparingclustering schemes isneeded.
2.2 The LOB Benchmark Clustering
If itis acceptedthat a classication should conform closelyto a syntacticintuitiveone
then there is a way it can b e evaluated automatically thus resolving the problems of
subjectivityamongstprogrammersandexp ertlinguists. Abenchmark classicationcan
b e derived which requires no input from the programmer nor a linguist but can b e
created empirically using a tagged corpus. A b enchmark was derivedfrom the tagged
LOB corpus using a reduced tag-set [Hughes 94]. The novelty of the techniqueis that
it yields a quantitative comparison against an existing corpus-based b enchmark. In
principlethe algorithmcould equallyb e appliedusinganother tagged corpus as a base.
The evaluation to olworks by cuttingthe dendrogram at a certainp oint to pro duce
a numb er of clusters. The memb ers of the clusters can then b e examined to see how
they are tagged in the reduced LOB tag-set. A score can b e calculated by classifying
eachgroupas the mostcommontyp eamongst itsmemb ersand countingup how many
memb ersconform to this typ e.
The cut-p oint chosen will havea b earing on this pro cess. The dendrogram can b e
cutat anyp ointto pro duceanynumb erof clusters. Ifthedendrogramiscutat thero ot
there will b e only one cluster containing all the items. If the dendrogram is cut at the
leavesthere areas manyclustersas there areobjectsto b egin with. Figure1showsthe
dendrogram b eing cut at two p oints to pro duce 3 and 5 clusters. The rst cut divides
the clusteringinto three groups thatmatch intuitiveexp ectations.
The b enchmark consists of 19 `reduced' tags such as noun, past tense verb and
cardinal number. An ideal clustering would match the b enchmark ideally and would
thus have 19 clusters. The dendrogram is cut at the p oint that pro duces 25 clusters
whichisveryclosetotheidealof19butstillallowsalittleleeway. Decidingwheretocut
thedendrogramisobviouslyfairlyad ho candotherresearchersinthisarea haveskirted
the issue and arbitrarily chosena cut p oint that pro duces a relatively large numb erof
groups which are likely to b e homogenous b ecause they do not have many memb ers.
However, some of the exp eriments avoid the cut-p oint issue altogether by cutting the
dendrogramatmanyp ointsthroughout itswidth. Tworivalclusteringschemescanthen
2.3 Automatically Evaluating Any Given Clustering
An alternativeevaluation schemedo es not use the b enchmarkbut instead lo oks at the
tagged LOB corpusto nd howeverywordinthe clusteringistagged. The rules follow
from the b enchmark used in the LOB exp eriments. Each word is compared with the
LOB corpus to examine how it is tagged most often. The scoring regime follows that
for the b enchmarkclustering.
The evaluator written for the 2000 wordexp eriment also evaluateseach group. An
exampleof oneof theleast consistentgroups (on the wholemost groupsare muchmore
consistent than this as will b eshown inthe examplesgivenlater) lo oks likethis:
13) NOUN 85.3261%
.HALF *CHILD *FLAME .SET *FIGURE POSTING RESUME DIE
ROUND *CAT *DREAM *SIGN *ANSWER *COMMENT *DRINK *SLEEP
*CHIP *DOG *REQUEST *WASTE .OFFER *REPLY *SWING .LIE
*BOY *KID *SURPRISE e-mail .GAIN *DEAL *DRESS .FALL
*DOCTOR *STEP *BRAND email *PURCHASE *CONTACT *DANCE *VOTE
*BABY .DAMN MIX *MAIL *POST *TOUCH *TRADE *WORK
If a word was tagged most frequentlyin LOB the samewayas the tag assigned to
its cluster (such as the majority of words in the example) then it was marked with a
\*". If, instead, the second, third or fourth most common tag for the word in LOB
matchedits cluster'sassigned tag (suchas the words half,damn, set, oer gain, lie or
fall inthe example)then thatwordismarkedwith a\.". Wordsthat do notmatchup
(suchas thewordsround mix or die inthe example)aren'tannotatedatall. Thewords
that are not present in LOB (e-mail and email) are printed in lower case whilst the
recognised words are converted to upp er case. The unknown words aren't included in
anyof the evaluationcounts. A score out of 100 iscalculated foreach cluster usingthe
samescoring metho dsforcalculating anoverallscore. Theexamplegroupwasdeclared
a NOUN groupby the evaluator with approximately85% accuracy.
3 Results
This section brieyrecordssomeof the results ofvariousclusteringschemesappliedto
someof the patterns in Englishlanguage. The rst setof exp eriments werecarriedout
on a sample set of the 200 most frequent words in the LOB corpus as they app ear in
the untagged LOB corpus. The evaluation to ol demonstrates which clusteringscheme
pro duces groupings most in linewith intuitive exp ectations and this schemeis used in
exp erimentsto cluster muchlarger groups ofwords.
3.1 Findi ng the Best Clustering Method
Table 1, b elow, contrasts the results for three distributional patterns formed by the
p osition of a word in a sentence and two typ es of bigram counts. Normalized vectors
were derived from statistics sampling the three patterns. Each combination of three
metrics and eight clustering techniques were used to cluster the vectors (except for
resultantdendrogramswereevaluated,forthecut-op ointwheretherewere25clusters,
against the b enchmark clustering. Each cell in the table, then, shows three gures:
the rst, on the left, for the combination of metric and clustering metho d ran on the
statistics derived from sentence p osition distribution; the second, in the centre, from
the distribution ofimmediateneighb our bigrams;the third, on the right,fromthe n{2,
n{1, n+1, n+2 bigramdistribution.
The evaluations reveal that the context implied by sentence p osition distribution
providesap o orrepresentationofthesyntacticr^oleofthe200words. Thehighestscoring
combinationconsistingof the Euclideanmetricand Ward'sclusteringmetho dwas only
judged to b e ab out 45% correct. The second set of exp eriments,on bigram counts of
the 200 most frequent words app earing immediately b efore of after a target set of the
mostfrequent101lexicalitems,scoredagreatdeal b etterthanforthe sentencep osition
distribution. Thehighestscoringcombination,ManhattanmetricandWard'sclustering
metho d scored76%. The p o orrelativep erformanceofsentencep ositiondistribution as
a context measure meant it was not investigated further. However, there was clearly
scop e to investigate bigrams further. A third set of exp eriments, this time on just the
b est p erforming clustering schemes from the earlier exp eriments were carried out for
bigrams covering the closest two neighb ours on either side. These results are detailed
on the rightof the cellsin Table 1.
Table 1: Evaluations for the Following Distributions:
(left) the p osition of a word in a sentence
(centre)bigrams for p ositions n{1, n+1
(right) bigrams for p ositions n{2, n{1,n+1, n+2
Single Complete Group Weighted
Metric
Linkage Linkage Average Grp. Ave.
Manhattan 2538| 426975 387270 407374
Euclidi an 2931| 4260| 3746| 4150|
Sp earmanRank
2329| 417576 367469 417071
Centreof Ward's
Metric
Median Centroid Gravity Metho d
Manhattan 2729| 2326| 2742| 437679
Euclidi an 2831| 2732| 3745| 4564|
Sp earmanRank 2726| 2826| 3267| 427477
3.1.1 Evaluating the Context Supplied by Bigrams
Intuitively wewouldimagine that the context providedbythe nearestwords wouldb e
more valuable than from words further away. This can b e veried by clusteringusing
just the bigramcounts for certainrelativep ositionsto the target words.
Table 2: Results for Experiments on
Each of the Six Bigram Positions
BigramPosition n{3 n{2 n{1 n+1 n+2 n+3
Score
55 60 69 61 53 50
The resultslisted intable 2 conrmthese exp ectations. The immediate neighb ours
supply a b etter context than those further awayand the b est context of allis supplied
To investigate the p ower of morphological context a further exp eriment was initiated
in which the context was calculated using just the previous words' last three letters.
The hundred most frequentthree letter word-endings werefound. Then bigramcounts
were calculated of the numb er of timeseach of the two hundred words to b e clustered
app eared immediatelyafter a wordwhich ended with one of the items inthe reference
set. Usingthis as thesolecontextaclusteringwasmadewhichwasevaluatedto around
73% comparedwith ab out 69% for the evaluation for the clusteringusing the wholeof
the previousword as the context. This impliesthat, in English, the r^oleof a wordcan
b e predictedwith ahigh degreeof accuracy using the endings of words.
This result should b e of particular interest to researchers using parts of words as
context forsuch tasksas handwriting recognition. [Hanlon and Boyle92], for example,
areusing theendingsofwordsto suggestthe likelysyntacticr^oleforhandwrittenwords
that have more than one p ossible derivation according to a handwriting recogniser.
Thusthealternativeswhichwouldseemunlikelyinthe contextofthe wordendingscan
b e given a lower rank than the alternatives that t more naturally with the syntactic
context.
0
100
90
80
70
60
50
40
30
20
10
0
10
20
30
40
50
60
70
80
90
100
Evaluation Score (%)
Number of Items in the Frequency-Sorted Comparison Set.
180
200
160
140
120
100
80
60
40
20
Alternative Clustering Schemes
Sets of Varying Size
100
90
80
70
60
50
40
30
20
10
0
Spearman Rank Correlation Coefficient Metric & Group Average Clustering Method
Evaluation Result (Percentage of Ideal ‘Benchmark’ Clustering)
Number of Clusters at which the Dendrogram is Cut
[image:7.612.87.288.307.528.2]Manhattan Metric & Ward’s Clustering Method
Figure 2: Evaluation Graphs for Two
Figure 3: Evaluations for Comparison
3.1.3 Varying the Cut-Points in the Dendrograms
One factor ofthe exp erimentalpro cedurewhichmaylead to falsebias wasthe p ointat
whichthe dendrogramwascutto formn clusters. Anybias dueto thehighdendrogram
cut-op ointusedintheevaluatorcanb eside-stepp edifagraphisplottedforevaluations
over a range of values. Figure 2 compares the highest scoring combination from our
exp eriments, Manhattan metric and Ward's clustering metho d, with the combination
that Finch b elieved to work b est in his exp eriments, the Sp earman Rank Correlation
Co ecientmetricand the Group Average clusteringmetho d. Clearly the combination
[image:7.612.315.507.324.526.2]3.1.4 Varying the Size of the Comparison Set
To investigatethe eect of the numb er of itemsin the comparison set ten exp eriments
werecarriedout, eachusing tenmoreitemsthan the previousone with the itemsb eing
added inorder of frequency. The results of these ten exp erimentsare plotted inFigure
3. Just theten mostfrequentlexicalitemsleadtoan evaluationofalmost70%. Adding
in moreand more items into the comparison set makesno signicant dierence to the
qualityof the clusteringas measuredbythe evaluation to ol. The reasonthe expressive
p owerof the most frequentlexicalitemsisso go o d isb ecause they are mainlyfunction
words. [Powers 92] suggests that as these words are relatively unaected by domain
they act as markersfor other words,hence indicating the categories of those words. In
Sch utze's exp eriments to cluster 5000 words he used the context of bigram counts in
the p ositions n-2, n-1, n+1 and n+2 as they co-o ccurred with the same 5000 words
[Sch utze 93]. As the b est contextualinformation seemsto b e provided bythe function
words - which make up the major part of the most frequent words in the corpus - it
seemswastefulon resources to havesuch alarge comparison set.
4 A Clustering of 2000 words
Now that the factors leading to a go o d clustering of words had b een investigated we
could selectthe b est clusteringschemeanduse itto cluster amuchlargersetof words.
The distributional contextof n02, n01, n+1, n+2 bigram counts,the Manhattan
metricand Ward's clustering algorithm were used to cluster 2000 words When scored
according to the evaluator the results were demonstrably go o d. For corp ora of size 16
million and 35 million words the evaluations are very similar. When the dendrograms
are cut at the p oint wherethere are 25 clusters(a verytightlyconstrained set for2000
words) b oth scores are inthe region of 80%. This impliesthat the corpusof 16 million
words (a third the size of Finch's corpus) is representative of the bigram distribution
and there is little to gain from using larger corp ora. The large-scale clustering was
shown to not only group itemsof similar syntax but also to partially cluster items on
their semantic or morphological similarity. When the dendrogram was cut to make
100 clustersthe groups listed on the next page were amongst the cut-o clusters. The
numb ersinthe listare lab els to identifythe lo cation of the groups inthe dendrogram.
20 DayNightAfterno onMorning SummerWeekendCenturySeasonMonthWeekYear
22 DaysHoursMinutesWeeksMonthsYears
28 FeetHandsFingersEyesLegs ClothesHairArmsTeethMindOpinionChestMouth
AssBreath TongueFo otArmShoulderFaceHeadHeartMemoryNameVoice
29 BrotherSisterFatherMotherDaughterSonMomHusbandWife
36 AustraliaCanadaAmericaEurop eCubaLebanonCaliforniaBoston ChicagoVietnam
75 SaidSaysKnowsFeelsBelievesThinks AssumedBelievedClaimedMeantStated
SuggestedFeltKnew RealizedFiguredThought
79 AddingAllowingCausingLeavingLettingBringingGivingPuttingSendingFinding
KeepingHavingBuyingMakingTakingUsing
we have restricted our exp eriments to English, but in principle the techniques could
apply to otherlanguages;weareparticularlyinterestedinhelpingtheemergingnations
ofEasternEurop e (includingformerSovietUnion)to developlinguistictechnologiesfor
`new' national languages. These languages, e.g. Ukranian, haveno Machine Tractable
Dictionaries of computational grammars akin to, for example, LDOCE and ANLTfor
British English; to create these would require much eort by exp ert native-sp eaker
linguists,so techniques forlearning classicationsand language mo delsfroma training
Corpus are veryattractive. Note that word-classication learningalonewillnot supply
acomp ostionalmo delofsyntaxandsemanticsofthesortusedinmanynaturallanguage
pro cessingor understandingsystems(e.g. ANLT);but`learnt'wordclasseswillb euseful
innon-comp ositional language mo delsas used in sp eech and handwritingrecognition.
A common linguistic constraint mo del for sp eech and handwriting recognition is
the n-p os or Markov mo del of word-tags. If a word-class clustering is computedusing
immediate neighb our collo cation countsas the contextualdistribution criterion,then a
word-tagset willb e derivedwhichis purelyMarkovian. [Atwell87] suggested that such
a \pure Markovian"tagset shouldp erform b etter in n-p os syntacticconstraint mo dels
than linguistically-derived tagsets such as LOB or Brown for English; and certainly
b etter than the absence of anytagset and tagged corpusfor, say,Ukranian.
It remains to b e shown how much of the structure of language can b e uncovered
with empiricisttechniques;however,inferenceofword-classication isausefulrststep
towardsthe p ossibilityp osedby[Chomsky57] ofa\discoverypro cedureforgrammars".
References
Eric Atwell. A Parsing Expert System which Learns fromCorpus Analysis. In W.Meijs (editor)
-Corpus LinguisticsandBeyond. Ro dopi,Amsterdam.1987
NoamChomsky. Syntactic Structures. Mouton,TheHague. 1957
StevenFinch. Finding StructureinLanguage. PhDThesis. DepartmentofCognitiveStudies,
Edin-burghUniversity. 1993.
SteveHanlonand RogerBoyle. SyntacticKnowledgeinWordLevelTextRecognition. InR.Beale
andJ.Finlay(editors) -NeuralNetworksandPatternRecognitioninHCI.EllisHorwo o d. 1992.
JohnHughes. AutomaticallyAcquiringaClassicationofWords. PhDThesis. Scho olofComputer
Studies,UniversityofLeeds. 1994.
JohnHughes andEricAtwell. Acquiringand Evaluating aClassication of Words. Pro ceedings
ofIEEGrammaticalInference Collo quium. UniversityofEssex, Colchester. 1993.
JohnHughes andEricAtwell. The AutomatedEvaluation of InferredWord Classications.
Pro-ceedingsof11thEurop eanConference onArticialIntelligence. Amsterdam,TheNetherlands.
1994.
DavidPowers. On the Signicance of Closed Classes and Boundary Conditions: Experiments in
Lexicaland Syntactic Learning. InW.Daelemansand D.M.W.Powers(editors) - Background
and Exp eriments inMachine Learningof Natural Language. Tilburg University. Institute for
LanguageTechnologyandAI.pp. 245-266. 1992.
HinrichSch utze. Part-of-SpeechInduction fromScratch. TechnicalRep ort. CentrefortheStudyof
LanguageandInformation. Stanford. 1993.