Ames Laboratory Technical Reports Ames Laboratory
7-1960
Gaseous diffusion at moderate flow rates in circular
conduits
George Roley
Iowa State UniversityR. W. Fahien
Iowa State UniversityFollow this and additional works at:http://lib.dr.iastate.edu/ameslab_isreports Part of theChemistry Commons
This Report is brought to you for free and open access by the Ames Laboratory at Iowa State University Digital Repository. It has been accepted for inclusion in Ames Laboratory Technical Reports by an authorized administrator of Iowa State University Digital Repository. For more information, please [email protected].
Recommended Citation
Roley, George and Fahien, R. W., "Gaseous diffusion at moderate flow rates in circular conduits" (1960).Ames Laboratory Technical Reports. 39.
Gaseous diffusion at moderate flow rates in circular conduits
Abstract
Mass transfer studies were made for an air-carbon dioxide gas system flowing through a 4-inch cylindrical conduit at Reynolds numbers of 1, 500, 5, 000 and 10, 000. It was the purpose of this work to investigate turbulent transport mechanisms in order that basic theory in this area be expanded. The experimental technique consisted of introducing a carbon dioxide tracer into the center of a moving air stream and determining concentration and velocity distributions at various downstream positions. Gas samples were removed by means of a pitot tube and analyzed by a thermal conductivity cell. A circular five-loop hot-wire anemometer was used to establish the velocity profiles.
I
S-330
Physical Sciences Reading Roo1ll
GASEOUS DIFFUSION AT MODERATE FLOW
RATES IN CIRCULAR CONDUITS
By
George Roley R. W. Fahien
July 1960
F. H. Spedding, Director, Ames Laboratory.
Work performed under Contract No. W-7405-eng-82.
LEGAL
NOTICEThis report was prepared as an account of Government sponsored work. Neither the United States, nor the Commission, nor any person acting on behalf of the Commission:
A. Makes any warranty or representation, expressed or Implied, with respect to the accu-racy, completeness, or usefulness of the Information contained In this report, or that the use of any Information, apparatus, method, or process disclosed In this report may not Infringe privately owned rights; or
B. Assumes any liabilities with respect to the use of, or for damages resulting from the use of any Information, apparatus, method, or process disclosed In this report.
As used In the above, "person acting on behalf of the Commission" Includes any em-ployee or contractor of the Commission, or emem-ployee of such contractor, to the extent that such employee or contractor of the Commission, or employee of such contractor prepares, disseminates, or provides access to, any information pursuant to his employment or contract with the Commission, or his employment with such contractor.
This report has been reproduced directly from the best available copy.
GASEOUS DIFFUSION AT MODERATE FLOW
RATES IN CIRCULAR CONDUITS
George Roley
R.W. Fahien
July, 1960
Ames Laboratory
Iowa State University
Ames, Iowa
IS-330
•
TABLE OF CONTENTS
ABSTRACT
IN'IROOOCTION
General
Previous Work
Description o£ Apparatus
Air-carbon dioxide t1ov system
Gas analysis
Velocity measurement
Procedure Scope ot Work
Development ot the Basic Diffusion Equation Bessel Solution
Semi-numerical Solution
RESULTS
Experimental Considerations
Height of test section Concentration data Velocity data
Gas
stream velocity ratioTheoretical Considerations
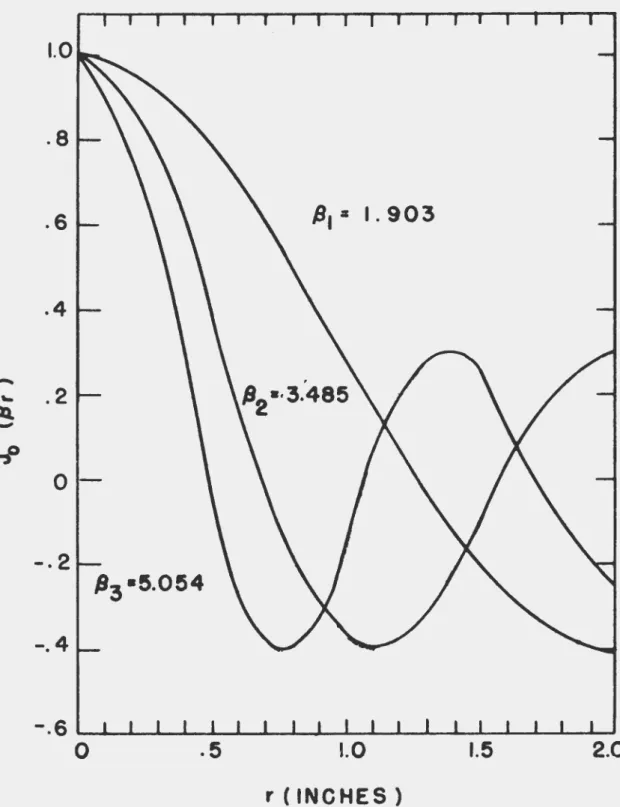
Concentration data Bessel plots
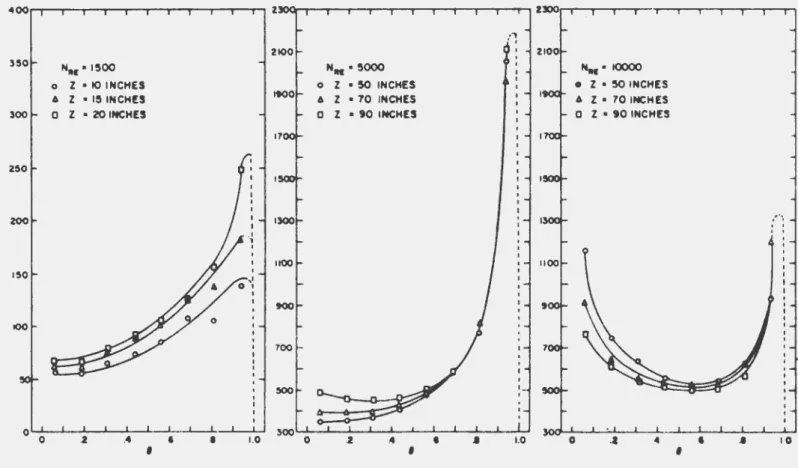
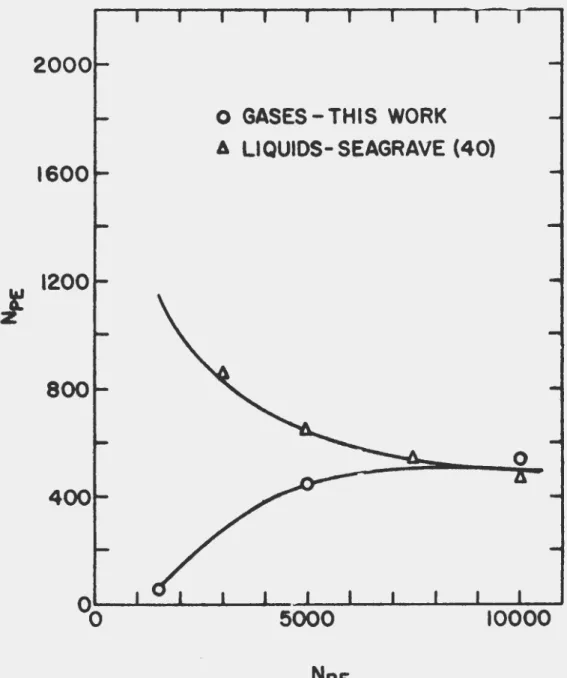
Variation of diffusivity with radial position Peclet number curves
Position Peclet number curves Eddy viscosity
Schmidt number curves
Special Con&iderationa
Variation of diffusivity with longitudinal position Longitudinal diffusion
Folium curves
OJ~CLUSIONS LITER4.TURE CITED N01'IEN CLATU RE
APPENDIX A
Sample Calct::lation for Bessel Solution Least squares application
Evaluation of the constant,
t9
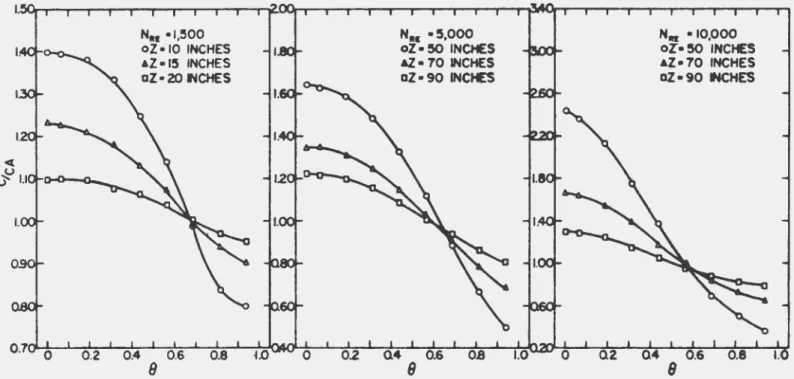
Determination of C0/1~ Results of Bessel Calculations APPENDIX BSample Calculation for Semi-numerical Solution - Boundary Condition I
Calcualtion of the mean concentration, ~/CA
Calculation of the eigen, A.
Calculation of point diffusivity and Peclet number
Page 102 103 112 120
123
126 129 129 129 130 130 132 133133
133 133 134Sample Calculation for Semi-numerical Solution - Alternate
Boundary Condition 139
CalcuJa tion of the eigen value, 7-. APPENDIX C
Thermal onductivity Cell Impulse Data Hot-wire Anemometer Data
iv
140
147
147
GASEOUS DIFFUSION AT MODERATE FLOW RATES IN CIRCULAR CONDUITS*
by
George Roley and R.W. Fahien
ABSTRACT
Mass transfer studies were made for an air-carbon dioxide gas system
:flowing through a 4-inch cylindrical conduit at Reynolds numbers of 11500,
5,
0001 and 101000. It was the purpose ot this work to investigateturbu-lent transport mechani8lll.l in order that basic theory in thia area be
ex-panded. 'lbe experimental technique consisted of introducine; a carbon
di-oxide tracer into the center af a moving air stream and determining
concentration and velocity distributions at various downstream positions.
Gas samples were removed by meana of a pi tot tube and analyzed by a
thermal. conductivity cell. A circular five-loop hot-wire anemometer wa.s
used to establish the velocity profiles.
A dual treatment o:f the data vas provided by :fitting the
concen-tration and velocity distributions to two solutions of the basic diffusion equation,
Certain discrepancies arise in both solutions because of different
simpli-tying assumptions used. These factors are pointed out while considerable
attention is devoted to theoreti~al explanations of features exhibited
by the results.
Point and average values of total diffusivity, mass transfer Peclet
number, and eddy viscosity were determined for the diffusion of carbon
dioxide in air. Mass and momentum transfer analogies are illustrated by
comparing the dimensionless groups of Peclet number to Scr~idt number
and eddy <na.ss diffusi vi ty to eddy momentum diffusi vi ty.
~-This
·
rrEtport is based on an M.S. thesis by George Roley suhmi tted
Equations were derived to enable the importance of axial diffusion
to be estimated, a term that ha• been generally neglected in mass transfer
studies. A characteristic diffusivity has been defined which permits a
general correlation of total diffusivity with both position and flow rate.
The mechanisms involved in heat, mass, and momentum exchange processes
between fluids have been subject• of considerable scientific and
techno-logical interest. The chemical engineer is interested in these processes
because of their application in m&Q7 of the unit operations and unit
processes where succeaatul design require& a knowledge of the exact
mech-anisms. For example, it is important to know whether a fluid 15 in laminar
or turbulent flow in an item of equipnent eince the transfer rates depend
on this condition. Prediction of mass transfer ia of particular intere~t
in equipment design cince it will necessarily influence the size of
equip-ment required for a specified application. Designers in this area have
been handicapped by lack of important theoretical concepts and,
consequent-ly, they have relied heavily upon empirical data, experience, and intu-ition to solve many of their problems. Mas& transfer calculations based
on overall considerations for many years have proven to be unauccessful so
that a better understanding of the internal effects has become apparent.
In packed towers, for instance, too little is known regarding the flow
through packing so that effects of mixing, uneven flow, and diffusion are
absorbed in some empirical coefficient. In fact, engineering design could
justly be called a "science of coefficients". This empirical method by
which the problems were handled often resulted in conflicting conclusions
with little or no correlation of results. Improved design practices can
be gained thro'.tgh a better understanding of the transport processes
exist. Although a great deal
or
work hu been exerted in this field,little has been accompli abed in the vay of expanding the basic theory involved. One important development concerns the relationship between
heat, maas, and momentum tranafer. It nov appears that these three
processes may be treated by a aingle theory.
'!he mas• tranarer process baa been sugge•ted to obey the relationship
lf A • D
1c
+:8.r
v Cwhere Dvand
E.r
are the molecular and eddy di.ft'uaivitiea respectively.*-•
tranafer by difruaion then results fran a combination of molecularmigrations and macro•copic motions of eddies. Further mixing ms:y occur
because of gross motion of the fluid but this is considered as a bulk maGS tranaport process u opposed to diffusional mass transfer. While a great deal is known about molecular d.if1'u.aion in view of upects of the kinetic theory of gues, relatively little is known about turbulent dift'u.aion. loi:>lecular and turbulent diffusi vi ties have been found to depend upon different physical variables so that failure of attempts to "lumpn them
together is not surprising. '!he importance of developing an adequate
theory is evident.
Because of many theoretical gaps regarding the nature of the turbulent
exchange process, prediction of its behavior cannot be accomplished without
recourse to experiment. It waa for this reason that the present study was
undertaken. '.lhe purpose of this work waa to determine the varying
contri-butions afforded the mass transfer process by molecular and eddy mechanisms
in gaseous systems. An additional objective included determining the
variation of total diffusi vi ty w1 th radial position. '!he flow rates
investigated ranged from the low end of the turbulent region where eddy
diffusion is the primary mode of transport througL the intermediate and
highly laminar range where molecular diffusion becomes important. A
further point considered was evaluating the importance of axial diffusion
in these flow ranges.
'lhe experimental technique involved introducing a tracer gas coaxially
into a moving air stream in an empty conduit. Concentration profiles at
various downstream posltions were established by removing samples by means
of a pitot probe and analyzing them with a thermal conductivity cell.
Velocity distributions were determined by a hot-wire anemometer. Although
the important practical problemc deal with transfer of material from one
phase to another, a. study of this type can provide valuable information
regarding the bacic mechanisms involvP.d. These data were treated by two
different solutions of the general diffusion equation to obtain values of
General
The groundwork for present ~ studies of turbulence was formed from theoretical concepts initiated by Prandtl, von Karman, and Taylor. A
com-prehensive discuasion of these basic findings is presented by Bakhmeteff
(1), while a more recent version has been made available by Bird~et al.
{4).
The application of molecular and turbulent diffusion in the fieldof chemical engineering has became increasingly important so that
intro-ductory treatments can be found in basic chemical engineering texts such
as Sherwood and Pigford ( 42) 1 Coulson and Richardson ( 5) 1 and Treybal (54) •
Perry's Chemical Engineers ' Handbook ( 34) also gives a camprehensi ve
discussion.
Theories relating the molecular diffusivities of gases to molecular
properties vere first proposed by Maxwell (29) and Jeans (18) using
principles based on the kinetic theory. Because of difficulty in
elimi-nating convection currents and faith in the kinetic theory, molecular
diffusivities are usually calculated rather than determined experimentally.
No theoretical relationships comparable to those for gases are available for liquids. Additional complications of molecular attraction and effects
of solute concentration complicates the analysis of liquid diffusion.
Concepts of the kinetic theory have also been helpful in developing a
theor:,· for turbulent motion. The eddies that cause mixing in turbulent
fluids nave been compared with the similar function of molecules in
nolecular diffusion. Tnese analogies are useful in visualizing the edd;y
diffusion process ~ut lead to false interpretation~ if carried too far.
4
..
~lor ( lq) suageated a theory ot turbulent dit:t'u8ion by oontinuou.
movements. unlike molecular motion vhere col.lidons between molecules
result in changes in the JD11.81litudea and directions ot the velocity vectors,
turbulent motion is not characterized by' llba.rl)l.y definable muses
ot
!luidaso that "collisions between masaea" re.W. t in a continuous movement ot the
fluid. 'lhis continuou. ~118 hu been correlated v1 th the speed
ot
aparticle bef'ore and a.t'ter sane time interval a.nd the displacement occurring
during this time interval. A definition ot scale ot turbulence wu
pro-posed by Ta\Ylor ( ~~ p.lt26) and cited by' Dryden (ll) in terma ot the
correlation existing between fluctuations at neishborill8 pointa.
It is clear that whatever ve ~mean by the diameter ot an e4dy
(scale of' turbulence) 1 a high degree of' correlation must exist
betveen the velocities at two points which are close together vhen caopared to this dilll!leter. On the other hand, the correlation iB
likely to be small between the velocity at two points dtuated
many e~ diameters .part. I:t 1 therefore, we imag1ne that the
correlation R 1 between the values ot the speed u at tvo points y
distant y apart in the direction of' the y coordinate has been
determined tor varioua values of' y, ve ~ plot a curve ot R y against y 1 and this curve will represent 1 fran the statistical.
point of view, the distribution of' u along the y axis. If' R y falls to zero at, se:y, y -= Y, then a length 12 can be defined
such that
12
a:J~
ey·ly
R ey0 y 0 y
This length ••••••• may be taken as a possible definition of'
the "average size of' eddies".
Turbulence denotes a condition of irregular motion ot the
of a fluid in the x, y, and z directiona are given by
u, v,
and V and theccmponents of deviating velocity are denoted by u, v 1 and v 1 then the
intensity of turbulence is measured by the
root~-square
values (u)1 / 2,(v)1/ 2, and (v)1 / 2 or more aimpl.y u', v', and v'. Virtually a.ll theories
of turbulence assume that the eddy diffUsion coefficient, in terms of its
statistical properties, is proportional to the product of "scale" and
"intensity". ~e analogous relationahipa for molecular d.it1'u.aion are the mean free path of the molecules and their root-mean .. square velocity.
Dryden ( 11) g1 ves an excellent 81liiiD&l"y of theories on turbulence
while devoting considerable attention to ita definition. Since the
irregular random fluctuationa usociated vi th turbulence occur in lem1 nar
f'lov on a molecular scale 1 Dryden sets a lover limit as that at which the
fluctuations cannot be detected by c011110n measuring instruments. Practical
me8JlJI of' pranoting turbulence in continuous processing un1 ta are discussed.
Previous Work
Until the past few years, experimental studies of eddy diffusion
have been limited due to the mild interest in this area and difficulties
in the techniques involved. Recent concern, however, has prompted
several laboratory investigations with the experimental work being focused
on three main systems:
1. gas and liquid streams in empty ducts
2. wetted-wall columna and
~. packed beds for both liquid and gaseous systems
These primary systems are those of greatest industrial importance so data
representative ot these methods account tor a aubstantial part ot the
literature.
In an early work on edcy di:fi'uaion., Towle and Shervood (52) made masa transfer meaaurements utilizing a tracer gas technique. Carbon dioxide and
hydrogen were introduced at the axia ot a horizontal duct confining an air
atream in turbulent motion. Concentration traverse• were made over a
central third ot the pipe diameter at aeveral po•ition. dovnatream tram
an egg ahaped injector. Values ot eddy dittuaivity were calculated uaing
the maas transfer counterpart ot an equation originally derived by Wilson
(55) tor the di.ttusion of heat fran a point source into a flowing atream
of infinite extent. Values ot eddy di.ttuaivity thus obtained were found
to be in the order ot 100 times the molecular d:itt'\aivity. Eddy
di.t-tusi vi tie a were the same tor both hydrogen and carbon dioxide leading to
the conclusion that the molecular weight ot the d.iftu.ing gaa 1.a not
important. 'lbe increase in asymptotic values ot edcy ditf'usivity with
distance from the injector waa approximately proportional to the increase
in Reynolds number.
In a later study, Towle,et al. (53) employed a similar technique
for determining the effect ot a wire screen grid on the turbulence of an
air stream. Edcy diffusivities were determined at various positions
downstream from the wire screen grid. The eddy diffusivities in the
first 15 diameters downstream were less than half the values obtained
with no grid present, however, these valuea increased rapidly and
approached an asymptote at about
45
diameter• downstream. This asymptoticReynolds number. The decrease in turbulence observed with the wire
screen grid was explained by viaualizing the air stream as being
"strained". This "straining" produced BI!l8.ller eddies than exist in
normal flow thereby reducing the rate ot diffusion.
Sherwood and Woertz ( 43) investigated eddy diffusion between a
liquid surface and a turbulent gas stream. Employing a falling film
technique, water vas transtered from one vall of a rectangular duct
across a turbulent gas stream to a film of calcium chloride solution on
the opposite wall. At high Reynolds numbers the eddy diff'usivity vas
nearly constant over 80 to 90 per cent of the cross section. A plot of
eddy diffusivity versus Reynolds number tor three main gas stream
materials (helium, air, and carbon dioxide) showed the eddy diffusivities
were inversely proportional to the gas densities. The diffusivity of
water vapor through air in a rectangular duct agreed well with the results
of Towle for the diftusi vi ty of carbon dioxide and hydrogen in a turbulent
air stream in a circular duct. Contrary to the simple film concept, much
of the resistance to diffusion vas noted in the eddy zone or "core" ot the
turbulent stream. 'Dle resistance offered by the "core" varied from 28
to
57
per cent depending on the Reynolds number. The remaining resistancewas divided about equally between the two narrov filma at the duct walls.
Sherwood ( 41) presents an excellent stmlll&ry of the relationships
between the interphase transfer ot heat, mass, and friction.
Illana.k (9) studied eddy diffusion of mass and momentum in a
wetted-wall channel in which rippling of the liquid film was eliminated. A
correlation of eddy diffusivity to Reynolds number confirmed the conclusion
drawn by Towle and Sherwood that the eddy diffusiv1ty 3hows an
approximately linear relationahip with Reynold.e number. Eddy dif'f'usivities
were found to remain fairly constant vi thin the main portion of the
turbulent core. Values ot eddy viscosities were compared to those obtained
by Woertz in similar fashion and were tound to be 50 per cent lower. 'Ibis
was attributed to the less turbulent conditions occurring near the wall in
the case where rippling ot the liquid tilm was eliminated.
~e first studies ot turbulent dift"uaion generated in bed.e of' packed
solids were reported by Bernard and Wilhelm (3). A detailed discussion
of turbulent motion for fluid !lowing around a bluff object is presented.
Liquid and gas phase experiments were performed using methylene blue
solution and carbon dioxide tracers respectively. The differential
equa-tion for diffusion-convecequa-tion was solved assuming the injector to be a
point source and the u/Et ratio to be constant. Modified Peclet numbers
were correlated with modified Reynolds numbers tor various packinga by
use of the relationship
Pe' • m(Re')n
where n is a function ot the Dp/Dt ratio and m is a function of the Dp/Dt
ratio and a shape !actor. Pressure-drop measurements were made for the
various packing sizes to obtain friction factors as a function of' Reynolds
number. These relationships indicated that turbulence in packed beds is
a function of the packing size and is therefore interstitial in nature.
Fahien and Smith (12) studied mass transfer in packed beds for a
variety of pipe and packing sizes using a gas injector technique. The
differential equation for mass transfer was solved allowing both
dif'-fusivity and velocity to vary with radial position. The solution,
was consummated by replacing the difi"erential equation with a set of
homogeneous linear difference equations containing eigen functions and
eigen values. Peclet numbers were found to increase as the pipe vall
was approached especially when the particle to tube diameter ratio vas
greater than .05. The particle size did not have any noticeable effect
on the Peclet number at the center of the pipe but did affect the eddy
diffusi vi ty.
Dorveiler (10) illustrated the interaction between molecular and
eddy diftusivities by extending the mass transfer data for packed beds
to low flow rates including the "transition" and "laminar" regions.
Molecular and eddy Peclet numbers were defined and correlated with
Reynolds number. The calculations were performed in accordance w1 th the
techniques developed by Bernard (2) and .Fahien in .Fahien and Smith (12).
Results of mass transfer in gases flowing through empty tubes at
low flow rates were reported by Frandolig (14). A large portion of
turbulent exchange was observed in flow ranges where molecular diffusion
was expected to be the controlling mechanism. Significant radial
variation of diffusivity was observed. Near the region of the pipe wall,
the total diffusion coefficient was found to approach a value corresponding
to the molecular diffusivity •
•
Lynn, et al. ( 26) made experimental st.ud.ies on the coaxial mixing
of natural gas and air at Reynolds numbers of 44,000 and 79,000. Total
diffusivities for the blending of gas in air were computed. Particular
emphasis was given to establishing behavior of the centerline diffusivity.
2 Concentrations and velocities were expressed as functions
o
r
(r/r0 )rather than r/r0 • Use
ot
the (r/r0 )2 variable permit.ted the diffusivityto be evaluated at the center, (r/r • 0), since derivatives of composition 0
with respect to (r/r )2 are not zero at this point. 0
Kalinske and Robertson (20) have reported findings on turbulence
generated by water flowing in an open rectangular channel. Motion
pictures were taken of the dispersion of a carbon tetrachloride and
benzine mixture. These films enabled vertical and lateral displacements
(intensity of turbulence) to be determined at various points downstream.
Using Taylor's equation
where R is defined as
vv /v
2 and the definition of diffusion coefficient as X~d~)
for large values of x, values of diffusivity were obtained from the 2dxslope of a
y2
versus x plot. Lateral turbulence was significantly greaterthan vertical turbulence near the surface.
Kalinske and Pien (19) reported results of a s1m.ilar study. Taylor's
theory of eddy diffusion was confinned by experiments on the dlffusion of
foreign matter in a turbulent water stream.
Measurements on mixing of binary gas mixtures flowing in beds of
porous solids were reported by Deisler and Wilhelm (
6).
A frequencyresponse technique was employed to measure interparticle and intraparticle
diffusion effects simultaneously. This technique involves introducing a
binary gas mixture into a packed bed at constant flow rate but varying
periodically and sinusoidally in composition. A shift in phase and
decrease in the composition amplitude results by the various diffusion
mechanisms acting in the bed. The diffusion constant within the spherical
Of particular interest, axial diffusion was found to be significantly
greater than molecular diffusion for Reynolds numbers between
4
and50
.
.
S1.milar studies on axial mixing in packed beds were made by McHenry
and Wiltelm (30). The ratio of the-~nlet and outlet amplitudes of a
sinusoidal concentration wave was used to compute axial Peclet numbers,
d U/E , where d is the particle diameter and E is the axial diffusivity.
p z p z
A solution of the equation
2
Ed X
z?
z
Uax
- dz
=
where x is the mole fraction of one gas in a binary mixture, z is the
axial coordinate, and t is time, resulted in an approximate exponential
solution. Working at Reynolds numbers between 100 and 400 with ~-N2
and C2H
4
-N2 gas systems and using a weighted average of 21 determinationsgave an axial Peclet number of
1.88
+0.15.
The contribution of masstransfer by axial diffusion was found to be approximately sixfold that
of radial diffusion.
Application of the dynamic response method to gases flowing in
e111pty tubes was mad~ by Keyes (21) for flov rates corresponding to
Reynolds numbers ~rom 4,000 to
50,000.
Mass transfer film coefficientswere determined through evaluation of an "equivalent gas film thickness".
The semi-theoretical equation of Martinelli
\vhere
BF
=
equivalent ~ilm thicknessd
=
inside tube diameterR c
=
ratio of mean to maximum concentration differenceex
=
ratio of eddy heat or mass di:ff'usi vi ty to eddy momentumdiff'usivity
were found to correlate the results reasonably well.
Measurements of gas absorption in falling ~ilma were made by stirba
and Hurt (45) ~or liquid-film Reynolda number• under l,Boo to 2,000. Mass transfer rates were observed to be ID8JlY times greater than could be
theoretically predicted on the basis that molecular diffusion was the only
transfer process. The presence o~ turbulence in the so-called laminar
film was suggested when the large increase in trans~er rate could not be
explained by the rippling action of the liquid film alone. It was
concluded that turbulence has a greater ef~ect on ma•s trans~er than either
momentum or heat transfer.
Schwarz and Hoelscher (39) reported mass transfer measurements in a wetted-wall column for a single Reynolds number of 251000. Water vapor
concentration profiles were used to compute eddy diffusivities for mass and momentum transfer as a function of radial position. A maximum in
eddy diffusi vi ty for both mass and momentum was observed at the
approx-imate mid-radius.
Hanratty (15) presents an interesting article on turbulent exchange
of mass and momentum at a boundary surface. The experimental data of
many investigators has led to doubt on the existance of the classical
boundary layer. A new theory has been postulated whereby masses of
to and from the va.l.l. 'llle exchange processe• are then a function of the
contact time which can be expressed mathemati.cal..ly.
Hanratty,et al.
(16)
studied turbulent diffusion by measuring themixing of a tracer dye in glass-sphere beds fluidized in water. Behavior
of eddy diffusivity is described as a function of time and a displacement
factor, reaching a constant value for large diffusion times.
Klinkenberg,et al. (23) attacked the problem of eddy diffusion by
an entirely mathematical approach. A point source of solute on the axis
of a tube was used as a model to derive eddy diffusion constants. The
relative importance of axial diffusion, radial diffusion, and diffusion
in infinite space were shown to be determinable by use of graphs utilizing
parameters of the experimental system.
'llle transfer of natural gas into a turbulent air stream flowing in
a horizontal duct was investigated by Schlinger and Sage (37) for gas
velocities of 25, 50, and 100 feet per second. Concentration profiles,
determined at several positions downstream, were noticeably altered by
gravitational forces actine on the gases. Calculations of total
dif-fusivities were made assuming independence of radial position.
Data on the evaporation of liquids from surfaces of cylinders,
spheres, disks, and flat plates were reported by Maisel and Sherwood (27).
Heat, mans, and friction transfer were correlated with Reynolds number
using the "j" factor concept. In a similar study the same authors (28)
related turbulent intensity to the mass transfer coefficients.
Longwell and Weiss (25) studied the effects of ttrrbulence on the
distribution of fuel injected into high-velocity air streams. Methods
presented for predicting these distributionn, using principles of turbulent
dif':fusion, gave an average error ot less thaD
7
per cent based on theexperi.Jn6nta.lly observed diotribution5.
Tichacek,~. (51) present an analysis on axial mixill8 in straight
pipes. The effects ot axial mixing are ahown to become increasingly
important aa the laminar tlov range 15 &pproached. This is & result of
the relative motion ot the fluid elements tor coDdi tiona where flat
velocity profiles do not exist. Pipe roughness caused little ettect on
axial mixing.
Prausnitz and Wilhelm (35) inveatig&ted concentration fluctuations
in a packed bed by measuring the spre&ding o:r an acid tracer solution.
Concentration fluctuations were explained in terms of the turbulence
Description
at
ApparatusAir-carbon dioxide tlov system
'l'he f'lov ayatm employed in this inveatiaation is ahown ache.atically
in Figure l and photosnPbic&l.ly in l'igure 2. 'lbe primary features
include:
1. air purification section
2. air metering section
3. teat section
4.
carbon dioxide meterin& section5.
gas analyzing section6.
velocity measuring section'lbe main air stream was delivered from a hisb pressure air source
through a 3/4-inch air line. 8m&ll UIO\Ults ot oil entraiment carried
over tram the compresaill8 uni ta were removed by paaaing the air throuelt
a double filter. The first, in the tor.m ot a one-foot aection ot l
l/4-inch pipe packed with steel vool, VNI uaed u a coarse filter. 'lhe second,
a Fisher Governor Type 361 porous atone air til ter, acted as a final
filter. 'l'he method of' gas analysis used in this study requires that the
carrier gas be quantitatively tree of' moisture and carbon dioxide. 'lhese
contaminants were removed by passing the air through two 6-foot
puri-fication towers ot 4-inch flanged pipe. 'l'he first contained
3-
to 8-meshgranules of silica gel tor removal of' moisture while the second contained
8-mesh soda lime to remove carbon dioxide. Use ot small particle sizes
afforded a large contact area but presented the problem ot containing
fluidized beda. Steel wool plup covered with 1()0-meah acreen atationed.
at both enda
ot
each col\.IDil vere t'OUD4 to contain the paclt1.Jl8aatia-tactorily. Both tovera vere packed to a heisht ot' approximately three
teet.
The a.ir tlov ,... metered by a aerie• ot' three
Broou
rotameter•covering tlov rangea trom 4.62 SCP'M to 27.2 SCPM at 14.7 paia and 70°F •.
Originally the syatem vu deaigned ao that only a single rotameter could
be inserted at arsy one time. Hovner, thia vaa later a.rr&lJged. ao that
all three rotameter& could be eaaily interch&Dged through a valve ayatem
u ahovn in the tlov di~. The rotameter• were operated at a preasure
ot' 18 paig u.ing calibration curve• IIUpp].ied b;y the manuf'acturer and ideal
gu law preasure corrections. nov rate• were adJusted by a 3/4-inch gate
valve located clovnatream
trom
the rot.metera. Preaaure reduction andregulation were controlled by a Reyoolda apriJlS':"loaded diaphra8R preasure
regulator E-825o-lt.. Bourd.on-tube preall\lre
.ae•
were placed at pointsilllllediatel.y precedina the rotameter tubea &Dd puri.tication·beda.
The air wu next diacharged into the bottc.
ot
a variable-heiibtd11't'uaion col\IIIJl constructed ot' It--inch DCIDinal di..wter plv&Zlised steel
pipe. A calming aection having a length
ot 45
pipe diameter• wu allowedto precede the teat aection.
A carbon dioxide tracer vu aupplied trom coamercial ti:tty-pound
cylinders ot' liquid
co
2 vi th vapor preasurea ot' appl'OX1llately 900 paig.The aupply preall\lre vaa reduced and r~ated by u.e ot' a atandard reducing
valve. Vaporization ot' the carbon dioxide reaulted in considerable cooling
ot' the diaphrap redllciD8 valve; consequently 1 the reducing valve and tirst
t-'
():)
AIR- CARSON DIOXIDE FLOW SYSTEM
SAMPLE STREAM
MANOMETER
VARIABL£ HEIGHT DIFFUSION COLUMN
SOOl lME SILICA GEL
COLUMN COl.UMH
REFERENCE AIR
STREAM
THENW.
COHDUCTMTY MCOROER
CELL
t
HtGH PRESSURE AftAIR FILTER
PRESSURE REGULATOR
PRESSURE GAGE
CAMON OIOXJOE CYL.N)fR
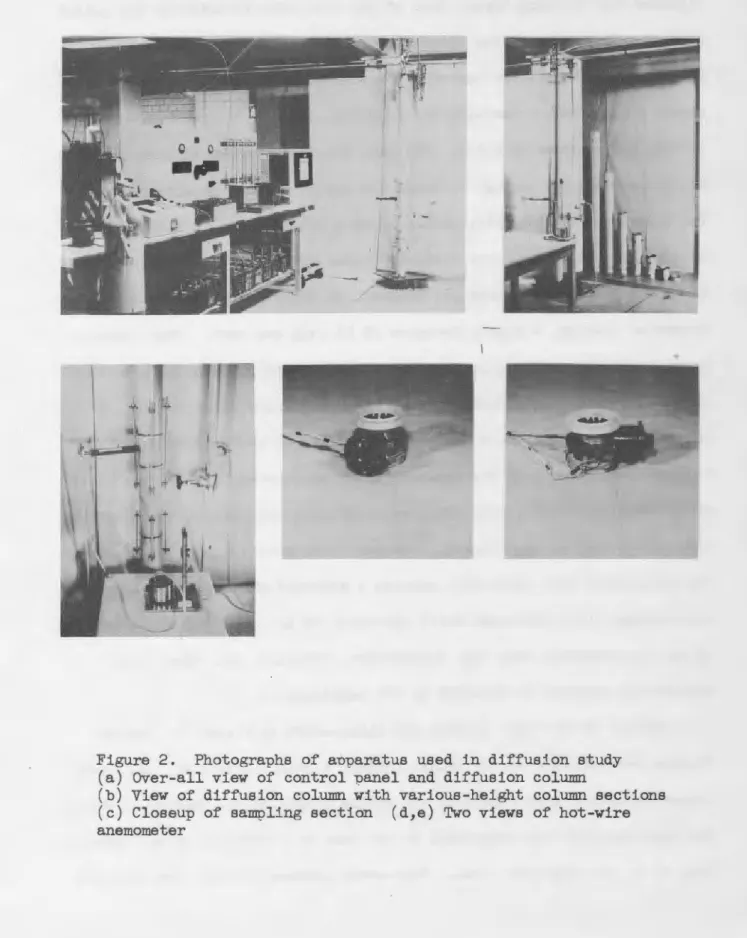
Figure 2. Photographs of auparatus used in diffusion study (a) Over-all view of control panel and diffusion column
(b) View of diffusion column with various-height column sections
nichrane wire heating tape. Enda of the vire vere attached to the outlet
tapa of a Variac poveratat which vu uaed to regulate the temperature.
Since the carbon dioxide puaed through 50 to
6o
feet of 1/4-inch softcopper tubing before reaching the injection tube, a temperature
equi-librium vas assumed to exist. The heat transfer surface in this length
of tubing vas great enough to bring the gas to or near room temperature.
1be flow of' carbon dioxide, regulated by a 3/8-inch needle valve, vas
metered by a pair of Brooks rotameter tubes covering ranges from
5, 500
to 201000 cubic centimeters per minute. In order to maintain a stable
rotameter reading, a supply pressure of' 18 paig vaa uaed. This pressure
prortded stable readings at low f'lov rates and did not require more than
one or two adJustments during a run. At higher flow rates cooling of'
the carbon dioxide reduced the supply pres.ure to the extent that more
frequent adJustments of the reducing valve were necessary. It vas later
noted that more stable f'lov rates were obta.ined vhen the nichrome heating
tape vas turned on approximately one-half hour before a run vas started.
1be rotameter& were calibrated against a standard model vet-test meter.
Calibrations were perfonned while operating at the same pressure used
in the experimental runs with temperature, pressure, and water vapor
corrections applied as directed by the manufacturer.
Details of the test section are illustrated in Figure 3. Carbon
dioxide vas admitted to the coltUnn through a long, 13/32-inch i.d., hard
copper injection tube extending the entire length of the calming section.
'!be injection tube was supported at the base by a circular spoked support
disk of 75 per cent free area. Four-armed spiders of fine wire supports
WOVEN WIRE PACKING
DETAILS OF
TEST SECT ION
SAMPLE POINT FOR _ _ / AVERAGE CONCENTRAT~
AIR
CARBON DIOXIDE
-:rigure -'. Details of te•t section
PITOT SAMPLER
were placed at 5-foot intervals to maintain the injection tube in a
coaxial position. A spoked-wheel device that located the injection tube
centrally was slipped over the tube end periodically as a check for proper
alignment. Flow disturbances at the carbon dioxide-air boundary were
minimized by tapering the end of the injection tube at an angle of 75
degrees to within one-halt the vall thickness.
Oaa samples were removed through a 5/32-inch i.d. pitot sampler
housed in a 6-inch section of 4-inch pipe. 'lbe pi tot probe vas constructed
of thin-walled copper tubing, its tip being machined to a tine k:nite edge.
A graduated scale on the exterior section gave the exact radial position
ot the pi tot probe vhile at the same time serving as a guide tor
main-taining proper angular aligiiilent o! the pitot. A 4-foot discharge section
was placed over the pi tot aasembly to minimize discharge effects and
prevent air currents from a.f'!ecting the flow pattern. At lov flow rates
(~ • 11500) it vaa necessary to partially close the gate valve on the
discharge section. 'lllis provided a slight pressure buildup to force gas
samples through the pitot tube. 'lbe sampler vas connected with tygon
tubing to 1/4-inch soft copper tubing which joined the metering tube.
After flowing through the rotameter 1 the gas sample was passed through
a thermal conductivity cell. The experimental technique includes analysis
of the average effluent concentration of the mixed gases. This was
accomplished by packing a portion ot the discharge section with woven
wire so as to create a large number of eddies to insure thorough mixing
of the gases. The average concentration vas sampled at the point
indi-cated in Figure 3 a.f'ter which the excess gas mixture was discharged to
the atmosphere. 'lbe heisht of the di:ttu.ion column could be varied by
adding sections of various heights between the calming section and pitot
assembly. Column sections were held in place by 3/8-inch threaded rods
extending through lugs apaced at 9o-degree intervals. 'lbe metal to
metal joints were given an air tignt seal by using Permatex number 2
gasket compound. A thin :t'ilm of the Permatex compound waa spread over
the tongue and groove joints and allowed to air dry a few minutes until
a "tacky" nature vas observed. 'lbe column sections were then aasembled
and tightened. Air leaks were detected by spreading soap solution over
the joints. 'lbe operating pressure vi thin the column waa reproduced
:fran run to run by meaauring the pressure vi th a manometer and adJusting
accordingly vi tb. the gate valve on the discharge section. '!his procedure
was necessary as it was discovered that calibration ot the gaa analyzer
depends on the pressure within ita chambers which in turn is a function
of the column pressure. Very reproducible zero points were obtained in
this manner.
Gas analysis
Carbon dioxide-air gas samples were analyzed by means of a Gow-Mac
Model 3Q-S fast acting thermal conductivity cell. The cell is essentially
a Wheatstone bridge containing two wire filaments in each of four anna
of a bricJ.8e. '!he circuit diagram is shown in Figure 4. A set of four
automotive batteries provided an operating current of 1}8.00 milliamperes,
with the exact value of current determined by measuring the drop across a
standard lO.oo-ohm resistance. 'lbe voltage drop across the standard
I\) +
CIRCUIT DIAGRAM FOR THERMAL CONDUCTIVITY CELL
t-
-i
J
CURRENT ADJUSTING RESISTANCES..._. - - - " ' V Y \ r - 200 G-IMS
~ 2!5 OHMS
FOUR 6-VOLT AUTOMOTIVE BATTERIES
SAMPLE STREAM ~
EIGHT FILAMENT
~
THERMAL CONDUCTIVITYCELL GAS ANALYZER
~AIIPLE STREAM
TO RECORDER
MLUAMMETER
TO POTENTIOMETER
ZERO POINT ADJUSTOR (2 OHM RESISTANCE)
Figure
4.
Circuit diagramtor
themal oonducti vi ty cellvi th a portable lamp and scale gal va.naDeter. Use of this instrument
permitted adJustment of current to within ±•5 per cent which vas necessary
to obtain precise measurements. CUrrent vas adJusted by manipulation •
of two lo-turn heliopots of 200 and 25 ohms. ~e desired zero point,
unbalanced e.m.f. resultill8 when reference air is passed through both
cell passages, vas adJusted by use of a variable 2-ohm resistance
connected across two arms of the cell br1d8e. 1his feature wu
incorpo-rated after abnormally high zero point readings resulted during a test
run. At first it vas thought that the cell filaments had become damaged;
however, a second thermal conductivity cell offered the same problem
resulting in the installation of the zero point adJustor. Gas samples
were removed by the pi tot sampler and passed through one arm of the
thermal conductivity cell while reference air wa. passed throusa the other
ann. A amall plug of pyrex wool va.a inserted in the gas lines prior to
the cell to prevent &rJy chemical drier from entering the cell chambers.
'nle resulting impulse data were measured and recorded by a Brown strip
chart recorder, Model No. 153Xl2V-X-301 equipped with a dual range.
Samples containill8 less than approximately 2 .l+ per cent carbon dioxide
were measured on a o-10 millivolt range while higher concentrations were
measured by a o-20 millivolt range.
The extreme sensitivity of the thermal conductivity cell required
effective control procedures for optimum performance. Regulation of gas
f'lov was of major importance in avoidill8 "flov effects" 1 consequently 1
rigid monitoring of the gas rates was maintained throughout the operating
procedure. Accuracy of the cell also depends on the maintenance of a
Gow-Mac were observed. A glass wool sheathing was placed inside the
steel housing to provide an insulation ror the heat reservoir. The
entire T/C cell was then installed in an insulated box. Thermal
stability of the heat reservoir was aided by operating the cell
continu-ously.
Calibration o! the cell waa accomplished by measuring the e.m.f.
resulting when a known concentration of carbon dioxide in air was passed
through one side of the cell. The concentrations were adjusted by rates
of flov of both gases anC. thoroughly mixed in the woven vire packed portion
of the discharge section. Dirferent concentrations were obtained by
changing the carbon dioxide rate while the main air stream rate was held
constant. The di1"1"erence between the unbalanced e.m.t. and the zero point
e.m.f. plotted against volume per cent carbon dioxide gave a good straight
line on a log-log plot. The calibration curve is shown in Figure
5.
Ona relative baais, the relationship between concentration and e.m.f. is
of the form
where n is the slope of a log C versus log E plot. Experimentally, E and
EA can be measured. The desired qUE~tity, C/CA, can be determined by
evaluating the cell constant, n • . Calibration of the cell and application
of a least squares procedure resulted in values of n equal to .952, .952,
and
.961
respectively for the three flow rates studied.Velocity measurement
Velocity profiles were established by use of hot-wire techniques.
Hot-wire methods are based on the fact that the resistance of a wire is a
:function of its temperature. Flov of a :fluid past a heated wire will
reduce its temperature thus changing its resistance, the magnitude of
which depends on the speed of the ambient :fluid. A measure of the
change in resistance provides a measure of the speed. The laws governing
the convective cooling of electrically heated wires by streams of fl•1ids
have been investigated most extensively by King ( 22). He showed both
theoretically and experimentally that the heat loss per unit length H
was closely approximated by the relation
H
=
i 2R
=
Bvl/2
+C
where B and C are constants depending upon the wire, temperature, and
ambient :fluid1and V is the velocity of the :fluid. Wires may be maintained
at constant resistance or at constant current. In the constant resistance
method,B and C remain constant with changes in :fluid velocity,and the
anemometer may be calibrated by a current versus velocity plot. B and C
are :found to vary with the :fluid velocity when the anemometer is run at
constant current. In this method the voltage drop across the wire is a
measure of the velocity. In the immediate region of the leads and
po-tential terminals,heat is conducted away from the wire at such a rate
that the wire temperature at these extremities may be considered very
nearly at air temperature. These terminal errors are not important as
long as the anemometer is directly calibrated under conditions similar
to actual service. Platinum has been the most popular metal used for
anemometer wires primarily because of. its chemical inertness at elevated
temperatures. The wire diameter used is of importance. Fine wires are
w
8.0
0 X
0
6.0
0
~
CD
4.0
0:::
~
...
z
l&J 02.
0:::
w
a.
-~
~
0:::
...
z
w
0
z
00
THERMAL CONDUCTIVITY CELL
CALIBRATION CURVE
oG
=
144 LBS/HR/SQ. FT
aG
=
198 LBS/HR/SQ. FT
.
aG
=
224 LBS/HR/SQ. FT.
EMF (MILLIVOLTS)
Figure
5.
Thermal conductivity cell calibration curve..
than heavier wires. The final choice ot diameter will depend upon the
particular application.
A circular, five-loop, hot-wire anemometer of the constant current
type vas used in this investigation and is shown in the photographs of
Figure 2 and schematically in Figure
6.
The anemometer was modeledafter those used by Swartz (38) in accordance with the procedures
recommended by Ower (33) and King (22). Five circular heating elements
were constructed from .oo6-inch platinum wire, the relatively heavier
wire being used because of its ability to maintain a circular shape
better than the thinner wires. Thin mica strips cemented to a Plexiglas
mount supported the five concentric wire loops in the proper radial
position. The platinum wire was "sandwiched" in grooves cut into heavy
copper electrodes and then spot welded for permanence of resistance. A
short vertical run of the copper leads vas permitted before passing
radially to the mount. The entire hot-wire assembly was housed in a
section of 4-inch brass pipe. Anemometer loops were located at radii
calculated from the equation
where
r r 0
2n-l l/2
[ -roJ
n = anaaometer no. (1, 2,
3,
4, or5
)
r
=
radius of anemometerr
=
radius of pipe. 0This arrangement permitted the anemometer loops to be placed at positi.ons
surrounded by equal areas. With this spacing of anemometers the total
VJ 0
a
POTENTIAL TAPS~
PL~~~ASS
COPPER
LEAD
WIRES
PLATINUM LOOPS
A\
BRASS PIPE
8
PLEXIGLAS$ RING
SECTION-AA
SECTION.
Figure
6.
Schematic of hot-wire anemometerPLATINUM LOOP OIAMETERS
1.-1.273. 2.-2.204.
1~2.14&·
..
flov rate a at each an~ter and mul tipl.y1Dc by the croas-aectional. area
ot
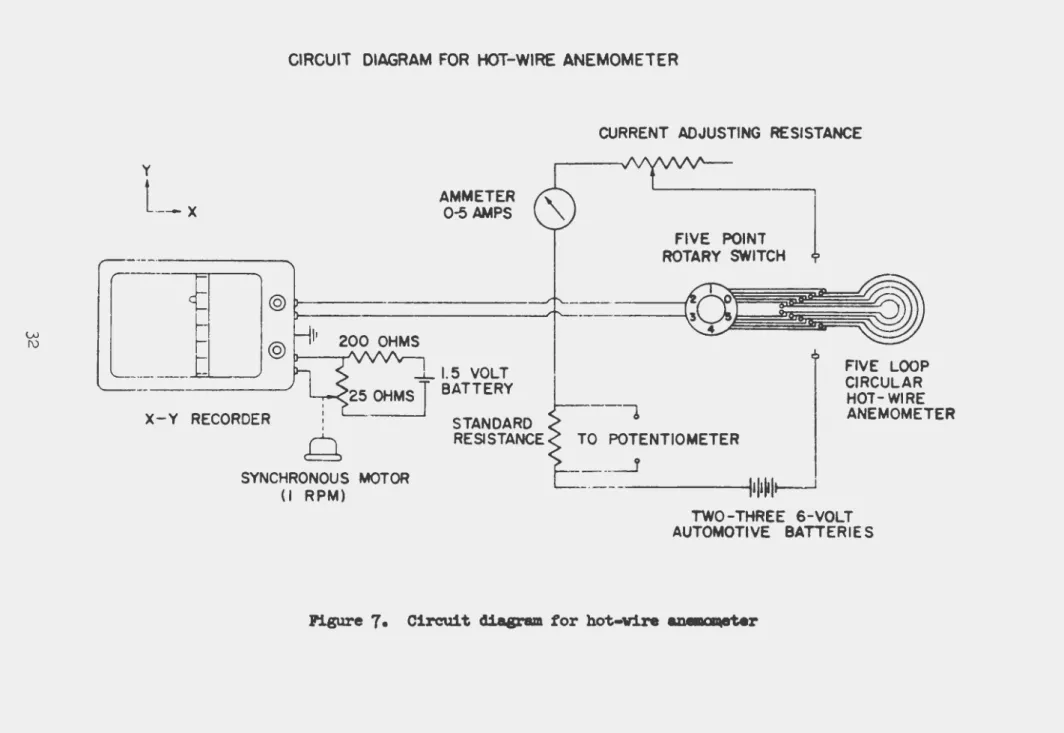
the pipe.1.be paver aupply shown in the circuit diagram
ot
Figure 7 consistedor two to three 6-TOl t ~ti Te b&tteriel connected in aeries. Voltage
dropa acrou the aneiDCIIleter virea were mea.ured and recorded by a »t>aeley
X-Y Recorder with range• trc:a
5
milli'f'Ol.t1 to 150 TOl.ta. Voltage dropawere measured by the Y term1Dill.
ot
the 1"'80erder. lt>tiono:t
the carriaaein the x-d1Nct1on vu prortded by auppl.y1ng the X tel'llinal ot the recorder
vi th a conatant Tar,Y1.n& input aignal.. DU1 wu accanpl.ilhed in the
tollovinc way: A aynchroDOUI motor vu u.ed to turn a 25-obll, lo-turn,
linearly calibrated heliopot re.ul:tina in a oonstant cbanp in TOltage
drop. 1'hia 1lllpul.1e vu ted to the X terminal ot the recorder.
Oll.ibration ot the 8J'l41'11CWMter 11 baaed on tbe principle•
o:t
tluidtlov througb pipel. J'or the l•1nv l'Nl88
ot
Reynolds number• below2,100, the flov vu aa8WDK to be l*ft.bolic acoordinc to the relation
u - 2V(l-(! ) 2 ]
ro
where u i1 the velocity at radiu. r and V is the aver&4Je velocity. 1.be
calibration vaa exteDded into the high tlov ranges (averase velocities
greater than 2.5 teet per second) by introducing a tlat velocity protUe
in the system u.ing. methoda sugae1ted by Stoker ( lt6). 'l'ro loo-mesh 1creena
were placed in the ayat•, one an inch below the anemaneter and one
di-rectly above the anemaneter. Teaao (50) found that the velocity at the
tour inner loops could be calculated by d1 vi ding the average velocity by
w
[\)
CIRCUIT DIAGRAM FOR HOT-WIRE ANEMOMETER
y
t. ___
X AMMETER0-5 AMPS
@
--/f'-@I! ,'\
- - · - - -- - - _.c=J..._ _ _ . / ....J.._ 1.5 VOLT 25 OHMS
T
BATTERYX-Y RECORDER
I
Q
SYNCHRONOUS MOTOR (I RPM)
STANDARD RESISTANCE
CURRENT ADJUSTING RESISTANCE
FIVE POINT ROTARY SWITCH
FIVE LOOP CIRCULAR
HOT-WIRE
--~,
I
ANEMOMETERTO POTENTIOMETER
__ _ J
---1ljl~lt---1
TWO-THREE 6-VOLT AUTOMOTIVE BATTERIES
•
.Boo.
Prior to calibration the platinum anemometer loops were annealedat a dull red heat in still air for six hours. ihe anemometer was
cali-brated by placing it on the calming section of the diffusion column after
the long carbon dioxide injection tube had been removed. ihe discharge
section was then placed over the anemometer housing to minimize convection
currents. Flow rates were adjusted to the desired levels and the
anemometer brought into circuit, the paver being supplied to the ane'
-mometers through a set of phone-jacks. CUrrent was adjusted by measuring
the drop across a standard resistance of approximately one-sixth of an
ohm until the voltage drop was equal to .35500 volts as measured by a
potentiometer. ~e value .35500 is the voltage drop which would cause the
anemometers to be at a dull red heat when placed in still air. The voltage
drop across the anemometer loop was then measured by the X-Y recorder.
Each anemometer was run through the entire laminar range before the next
anemometer was calibrated. After calibration in the laminar range had
been completed, the screens were inserted and calibration in the higher
flo-.r :ranges were performed in the same manner. The laminar range ends at
an average velocity of approximately one foot per second while the screened
data starts at an average velocity of 2.5 feet per second. The gap left in
between these two procedures was filled by fitting the two sets of data
into a smooth curve. Matching of the two curves was taken as a criterion
of the agreement of both calibration procedures. 'Rle calibration curve
for the hot-wire anemometer is shown in Figure 8.
Procedur~
<n
Cl)
0
0: 0
<(
Q.
0
0:
0
LLJ
<!) <( ~
0
>
HOT-WIRE ANEMOMETER
CALIBRATION CURVE
ANEMOMETER NO. 5
NO.
4
NO. I
AIR VELOCITY- FT /SEC
Figure
8.
Hot-wire anemometer calibration curve•
tracer into a moving air stream and estab1iahing concentration and ve1ocity
profiles at various positions downstream. A knov1edge ot the concentration
and velocity distributions provides sufficient into~tion to calcu1ate
point va1ues of diffusi vi tie a. 1he main air streaa rate vaa set and
allowed approximate1y one-half' hour tor equil.ibrium to eatabl.iah. Once
tixed1 the main air stream f1ow remained quite con.atant and did not require
further attention during the experimental. run. Periodic check81 however 1
were made. !lbe desired zero point ot the thermal conductivity ce11 vu
set and recorded. Carbon dioxide vaa adm1 tted to the co1umn aDd allowed
15 to 20 minutes to attain a temperature equ11ibrium. To m:Jn1m1 ze
arti-ficial mixing of the two streams due to jetting ettecta, the carbon dioxide
vaa adm1 tted at a speed corresponding to the center-1ine air vel.oci ty under
empty tube condi tiona. Linear gaa ve1oci ties were uaed, calculated u tb.~
vol.\Detric t1aw rates divided by the croaa-aectional. area. Bquil.ibrium
vaa estab1iahed and the cell response tor the averae;e concentration vas
recorded. Point values of concentration were then determined by
with-drawing samp1es through the pitot probe, taking care to keep the aamp1ing
rate be1ov the rate of the main air stream ve1ocity to prevent sucking
around the neighborhood ot the pitot probe. Seventeen pointe along a
diameter were traversed and analyzed. At the end of each run the average
coneentratioh and zero point readings were redetermined. In order to
insure that representative concentration profiles were obtained, three
diameter traverses spaced at l2Q-degree intervals were made for each
height. 'Ibis procedure gave six values of concentration for each radial
were made in regular order from vall to center to wall, sampling each
radial position over an 8 to 16 minute time interval. 1be corresponding
cell impulse was obtained by a graphical integration of the strip chart
with a planimeter. After the position of the pitot probe had been changed,
the flow rates and cell operating current were checked and adjusted
accordingly.
Velocities at five radial positions were measured by replacing the
pitot probe with the hot-wire anemometer. Duplicate determinations were
made for each of the flow rates and heights investigated. Air vas passed
through the injection tube to simulate the flow effect of the carbon
dioxide. Air rather than carbon dioxide vas used because of the dif':t'erent
cooling effects on the anemometers due to differences in thermal
con-ductivity. Identical velocity ratios were used. The main air rate vas
3et first to blow off any particles that may have deposited on the
ane-mometer vires. The proper value of current wa6 established and the voltaee
I
drop across each loop measured. Velocities corresponding to these voltage
drops were obtained from an enlarged calibration curve.
The concentration and velocity data provided enough infonnation to
calculate values of d.if:fusivities. These data were treated by the two
mathematical procedures described in the next section.
Scope of Work
The range of experimental work for which concentration and velocity
...
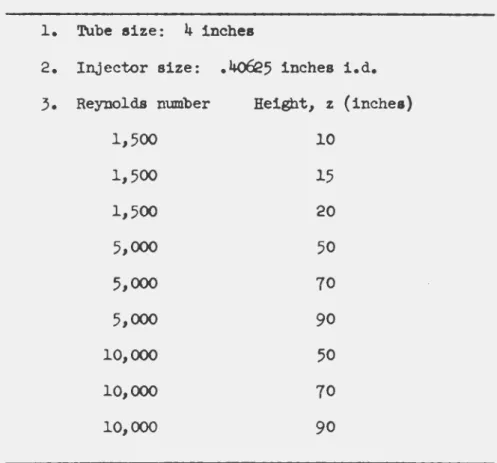
Table l. Variables investigated
l. Tube size: 4 inches
2. Injector size: .40625 inches i.d.
3.
Reynolds number Height, z (inches)1,500 10
1,500 15
1,500 20
5,000 50
5,000 70
5,000 90
10,000 50
10,000 70
10,000 90
Three diameter traverses were made for each height and flow rate
studied when obtaining concentration data while velocity determinations
were made in duplicate. All the experimental data in this work were
taken at room temperature and pressure. ~e temperature remained constant
0
at 23.4
±
1.2 C throughout the investigation and vas regarded only in thecalculation of flow rates. Effects of temperature on rates of diffusion
A nucleus from which studies of ditfuaion can be developed is provided
by the partial differential equations used to describe laws governing
mate-rial transfer by molecular and edd;y mechanisma. Progress in this area has
been limited due to difficulty in effecting satisfactory solutions to these
equations.
Mass transfer in a moving fluid generally is composed of the
simultane-ous contributions of molecular and eddy processes and is usually expressed
in terms of an eftecti ve dittusi vi ty detined mathematically by the
ex-pression
where
N • (Dv
+
~) VC • E v CN • rate of mass transfer, molea/sq ft/sec
Dv• molecular ditfusivity, sq ft/sec
~- edey or turbulent dift-u.ivity, sq ft/sec
E • total effective diffueivity, sq ft/sec
vc •
concentration gradient, moles/cu ft/ftThe differential mass transfer equation presupposes that the above
relationship is true. In the following pages a B\1IIII1.8.I"Y of the mathematical
methode used by previous investisatora is presented. A later section of
this paper presents some modifications and new derivations which have been
developed during the course of this investigation.
Development of the Basic Diffusion Equation
Consider the diffusion of a tracer material from an injector tube
source in a cylindrical system. Under steady state conditions, a mass
be.lance over the differential element of volume shown in Figure 9a is:
dNl + dK3 a: dlf2 + dl{ 4
(1)
Diffusion is the only mechanism involved in radial mass transfer since net
flow in this direction is oot possible. 'lhe detinilli equation tor E can
be used to obtain the moles transferred radially, ~~ into the element.
'!he moles leaving or dN2 must equal dlf1 plus the change occurring in
d.N1 over the distance dr. For a differential element
(2)
(3)
where E is the radial ef'tecti ve d.iffusi vi ty. Transport of mass due to r
gross motion ot the fluid must be considered in addition to diffusion for
mixing in the axial direction. '!hat is
(4)
(5)
where E is the axial effective diffusivity. Substitution of Equation 21
a
31 41 and 5 into Equation 1 gives
o
(E dAoc>
o
(eu dA E dAoc>
'dr
r rdr""dz'
z- a zdz''lbe areasthrough which mass transfer takes place are given by
dA -= 21fr dz r
dA
=
21fr drz
Substitution into Equation
6
and simplifying establishes the basic(6)
(7)
0::
0:: 0
o::IQ)
"C-o
Q)
LLI
r
N"0
_L
(a)
dr
(b)
dR
1
f(E8di OR R)
(k--)h
I I
U:::.
2
I I f:····::···:
(k) h
- -,-
-~
-
-nmnT~h
jj:::..
,
I I 1 '···~:::::::::::a:::::::::··· .. (k~
2
) h
- - I - - ,- -
c11~1~1111111!jiT]111111111~~
I I ···J···l
- - - -
-~~=~=~==~:~::::I I I...···...··.·.··... ....··...····J···.·...... ···......·~·· .. .
-:
:
~111
11111ll
~W
!!
~!lll
1
~
(O)h
(l)h
( 2) h ... ( N) h
B~kh
Figure 9a. Cylindrica.l shell of infinitesimal volmne
Figure 9b. Partial. d.:ifferential :functions in a cylindrical system