NEW ANALYTICAL METHOD DEVELOPMENT, OPTIMIZATION
AND EFFICIENT VALIDATION BY CHEMOMETRIC APPROACH
FOR MARKETED FORMULATIONS
THESIS
Submitted to
THE TAMILNADU Dr.M.G.R MEDICAL UNIVERSITY
GUINDY, CHENNAI-600032, TAMIL NADU, INDIA.
As a partial fulfilment of the requirement for the award of the degree of DOCTOR OF PHILOSOPHY IN PHARMACY
[Faculty of Pharmacy]
SUBMITTED BY
R.VIJAYAGEETHA, M.Pharm.,
UNDER THE GUIDANCE OF
Dr. A.SHANTHA, B.Pharm., M.Sc (Pharm)., Ph.D.,
HOD DEPARTMENT OF PHARMACEUTICAL ANALYSIS
C.LBAID METHA COLLEGE OF PHARMACY THORAPAKKAM, CHENNAI.INDIA.
CERTIFICATE
This is to certify that the thesis entitled“NEW ANALYTICAL METHOD DEVELOPMENT, OPTIMIZATION AND EFFICIENT VALIDATION BY
CHEMOMETRIC APPROACH FOR MARKETED FORMULATIONS” is a record of
research work done by R.VIJAYAGEETHA who carried out the research under my supervision at C.L. Baid Metha College of Pharmacy, Chennai - 600 097 during the year 2008-2012 and this dissertation has not previously formed the basis for the award of any degree, diploma, associate ship, fellowship or other similar title. Certified further that the dissertation represent work done by the candidate and that this has not formed in part or fully the basis for the award of any other previous research degree.
Place: Chennai Dr.A. Shantha, B.Pharm., M.Sc (Pharm)., Ph.D.,
Date: HOD, Dept of Pharmaceutical Analysis,
C.L.Baid Metha College of Pharmacy,
DECLARATION
I hereby declare that the dissertation entitled “NEW ANALYTICAL
METHOD DEVELOPMENT, OPTIMIZATION AND EFFICIENT
VALIDATION BY CHEMOMETRIC APPROACH FOR MARKETED
FORMULATIONS ’’
submitted for the Degree of Philosophy in Pharmacy is my original work at C.L Baid Metha College of Pharmacy,Chennai-600097, during the year 2008-2012 under the supervision of Dr A.Shantha , B.Pharm., M.Sc (Pharm)., Ph.D., and the dissertation has not formed the basis for the award of any degree, diploma, associate ship, fellowship of similar other titles. It has not been submitted to any other University orInstitution for the award of any degree or diploma.
Place: Thorapakkam (R.VIJAYAGEETHA)
Date:
CONTENTS
CHAPTER
NO.
TITLE
PAGE NO.
I
INTRODUCTION
1.1. Analytical chemistry 1
1.2. Chemometrics 2
1.3. RP- UHPLC 7
1.4. HPTLC 10
II
REVIEW OF LITERATURE
2.1. Literature review 16
III
EXPERIMENTAL WORK
3.1.Aim and objective of the work 83
3.2. Drug profile 84
3.3. Marketed formulations used 103
IV
PART-I. UV Spectroscopy– Chemometrics
4.1. Experimental Procedure 106
4.1.1. Drotaverine Hcl and Mefenamic acid 106
4.1.3. Tolperisone Hcl and Paracetamol 110
4.1.4. Thiocolchicoside and Etoricoxib 112
4.1.5. Thiocolchicoside, Aceclofenac Sodium and Paracetamol
114
4.1.6. Diacerein and Aceclofenac Sodium 116
4.1.7. Diacerein and Celecoxib 118
4.1.8. Rabeprazole Sodium and Domperidone Maleate
120
4.1.9. Lafutidine and Domperidone Maleate 122
4.1.10. Famotidine, Paracetamol, Chloroxazone and Diclofenac
124
4.1.11. Phenylephrine Hcl, Paracetamol, Caffeine and Cetrizine
126
4.1.12. Phenylephrine Hcl, Paracetamol, Caffeine and Chlorpheniramine Maleate
128
4.2 Results and Discussion 130
V
PART-II. RP-UHPLC
5.1. Experimental Procedure 141
5.1.1. Analytical method DM 143
5.1.2 Analytical method PETTA 146
5.1.3 Analytical method DAC 150
5.1.4. Analytical method RLD 153
5.1.6. Analytical method PPCCETZ 160
5.1.7. Analytical method PPCCPM 163
5.2. Results and Discussion 167
VI
PART-III. HPTLC
6.1. Experimental Procedure 180
6.1.1. Drotaverine Hcl and Mefenamic acid 181
6.1.2. Diacerein and Celecoxib 184
6.1.3.Tolperisone Hcl and Paracetamol 186
6.1.4. Lafutidine and Domperidone Maleate 188
6.1.5. Thiocolchicoside, Aceclofenac Sodium and Paracetamol
190
6.2. Results and Discussion 192
VII
SUMMARY AND CONCLUSION
198
ACKNOWLEDGEMENT
Working on the Ph.D. has been a wonderful and often overwhelming experience. It is hard to say whether is has been grappling with the topic itself which has been the real learning experience, work in a group, stay up until the birds start singing, and stay focus ...
In any case, I am indebted to many people for making the time working on my Ph.D. an unforgettable experience.
First of all, I am deeply grateful to my advisor Dr. A.Shantha. To work with you has been a real pleasure to me, with heaps of fun and excitement. You have been a steady influence throughout my Ph.D. career; you have oriented and supported me with promptness and care, and have always been patient and encouraging in times of new ideas and difficulties; you have listened to my ideas and discussions with you frequently led to key insights. Your ability to select and to approach compelling research problems, your high scientific standards, and your hard work set an example.
I admire your ability to balance research interests and personal pursuits. Above all, you made me feel a friend, which I appreciate from my heart.
It’s my privilege to express my grateful and sincere gratitude to
Dr.GraceRathnam,M.Pharm.,Ph.D, Principal, C.L.Baid Metha College of Pharmacy.
In the various laboratories and workshops I have been aided for a year in running the equipment by Mr.Joseph, Mr.MaruduParadian, and Parama Guru are fine Analyst. They helped tutor me in the more esoteric methods necessary to run Spectrometers,UHPLC and how to analyse the data from them. The smooth running of the Ideal laboratory is much more a testament to their efforts than my own. Mr Joseph has also inadvertently, and without fail, provided something much greater in all the years I've known him: a friendly smile and a hello every time we met. Mr.Bhanu Prakash gave useful guidance in the use of the software.
Continuing a fine tradition I want to thank both of my friends Mr.M.Srinivasan Deputy Manager Actavis Chennai, and Mr .Dillibabu Drug Inspector Chennai for their invaluable advice on both an academic and a personal level, for which I am extremely grateful.
Also I extend my thanks to Mr.Manikandan Lecturer SRM College for HPTLC work, Mr.Hanniffa and Mr.Raj kumar Manager Reltson Lab pondy for providing the gift samples of drugs.
In my daily work I have been blessed with a friendly and cheerful group of my students like Ms.Surya, Ms MohanaPriyaDasari, Ms Mehera G, Ms Bhavana , Ms.Rohini G S,Ms Niharika.Nandi and Avala Arvind.
I am most thankful to my Mom, Dad, Sister and Brother for everything they have done for me and all of their moral and spiritual support. They encouraged me and helped me keep things in perspective.
Finally, I thank my Husband for supporting me throughout all my studies at University, moving my vast collections of ``stuff'' across most of Liverpool and for providing a home in which to complete my writing up.
I thank my lovely daughter Felicia, for giving me so much of joy in stressful conditions.
LIST OF ABBREVIATIONS USED
% - Percentage
g - Grams
mg - Milligram
g - Micro gram
ng - Nano gram
L - Litre
ml - Millilitre
l - Microlitre
max - Absorption maximum
Af - Asymmetry factor
tR - Retention time
k’ - Capacity factor
Rf - Retardation factor
AR - Analytical reagent
BP - British Pharmacopoeia
HPLC - High Performance Liquid Chromatography
UHPLC - Ultra High Performance Liquid Chromatography
IP - Indian Pharmacopoeia
LOD - Limit of Detection
LOQ - Limit of Quantification
Conc - Concentration
n - Number of variables
N - Number of theoretical plates
NIPALS - Non-linear iterative partial least squares
nm - Nanometer
oC - Degree Centigrade
OSC - Orthogonal signal correction
p - Loading vector
PCR - Principal component regression
PLS - Partial least squares regression
PRESS - Prediction error sum of squares
r - Regression coefficient
RMSEC - Root mean square error of calibration
RMSEP - Root mean square error of prediction
RP-HPLC - Reverse Phase High Performance Liquid Chromatography
RP-UHPLC - Reverse Phase Ultra High Performance Liquid Chromatography
Rs - Resolution
RSD - Relative standard deviation
s0 - Pooled residual standard deviation
S.E - Standard Error
CI - Confidence interval
TEA - Tri Ethyl Amine
OPA - O-Phosphoric acid
Tf - Tailing factor
USP - United States Pharmacopoeia
UV-Vis - Ultraviolet-visible
PDA - Photodioade Array Dector
X - Matrix of x-variables
Y - Matrix of dependent y-variables
β - Regression coefficient in experimental design
NMT - Not more than
NLT - Not less than
Drota - Drotaverine Hcl
Mefe - Mefenamic acid
Etori - Etoricoxib
Para - Paracetamol
Tol - Tolperisone Hcl
Thio - Thiocholchicoside
Aceclo - Aceclofenac sodium
Diclo - Diclofenac potassium
Dia - Diacerein
Rabe - Rabeprazole sodium
Dome - Domperidone maleate
Lafu - Lafutidine
Famo - Famotidine
Chlor - Chloroxazone
Phenyl - Phenylephrine Hcl
Caffe - Caffeine
Cetz - Cetrizine Di Hcl
Cpm - Chlorpheniramine maleate
PETTA - Paracetamol, Etoricoxib, Thiocholchicoside, Tolperisone Hcl and Aceclofenac sodium
DAC - Diacerein, Aceclofenac sodium and Celecoxib
RLD - Rabeprazole, Lafutidine and Domperidone maleate.
FPCD - Famotidine, Paracetamol, Chloroxazone and diclofenac potassium.
PPCCETZ - Phenylephrine Hcl, Paracetamol, Caffeine and Cetrizine Di Hcl
LIST OF SPECTRA
Spectrum.1 Overlaid Spectrum of Drotaverine Hcl and Mefenamic acid.
Spectrum 2. Calibration Spectrum of Drotaverine Hcl and Mefenamic acid.
Spectrum 3. Prediction Spectrum of Drotaverine Hcl and Mefenamic acid.
Spectrum 4. Assay Spectrum of Drotaverine Hcl and Mefenamic acid.
Spectrum 5. Accuracy Spectrum of Drotaverine Hcl and Mefenamic acid.
Spectrum.6. Overlaid Spectrum of Etoricoxib and Paracetamol.
Spectrum 7. Calibration Spectrum of Etoricoxib and Paracetamol.
Spectrum 8. Prediction Spectrum of Etoricoxib and Paracetamol.
Spectrum 9. Assay Spectrum of Etoricoxib and Paracetamol.
Spectrum 10. Accuracy Spectrum of Etoricoxib and Paracetamol.
Spectrum. 11. Overlaid Spectrum of Tolperisone Hcl and Paracetamol.
Spectrum12. Calibration Spectrum of Tolperisone Hcl and Paracetamol.
Spectrum 13. Prediction Spectrum of Tolperisone Hcl and Paracetamol.
Spectrum 14. Assay Spectrum of Tolperisone Hcl and Paracetamol.
Spectrum 15. Accuracy Spectrum of Tolperisone Hcl and Paracetamol.
Spectrum.16 Overlaid Spectrum of Thiocolchicoside and Etoricoxib.
Spectrum17.Calibration Spectrum of Thiocolchicoside and Etoricoxib.
Spectrum 18.Prediction Spectrum of Thiocolchicoside and Etoricoxib.
Spectrum 19. Assay Spectrum of Thiocolchicoside and Etoricoxib.
Spectrum 20. Accuracy Spectrum of Thiocolchicoside and Etoricoxib.
Spectrum22.Calibration Spectrum of Thiocolchicoside ,Aceclofenac and Paracetamol.
Spectrum 23.Prediction Spectrum of Thiocolchicoside, Aceclofenac and Paracetamol.
Spectrum 24. Assay Spectrum of Thiocolchicoside, Aceclofenac and Paracetamol.
Spectrum 25. Accuracy Spectrum of Thiocolchicoside ,Aceclofenac and Paracetamol.
Spectrum.26 Overlaid Spectrum of Diacerein and Aceclofenac.
Spectrum 27.Calibration Spectrum of Diacerein and Aceclofenac.
Spectrum 28.Prediction Spectrum of Diacerein and Aceclofenac.
Spectrum 29. Assay Spectrum of Diacerein and Aceclofenac.
Spectrum 30. Accuracy Spectrum of Diacerein and Aceclofenac.
Spectrum.31 Overlaid Spectrum of Diacerein and Celecoxib.
Spectrum32.Calibration Spectrum of Diacerein and Celecoxib.
Spectrum 33.Prediction Spectrum of Diacerein and Celecoxib.
Spectrum 34. Assay Spectrum of Diacerein and Celecoxib.
Spectrum 35. Accuracy Spectrum of Diacerein and Celecoxib.
Spectrum. 36 Overlaid Spectrum of Rabeprazole sodium and Domperidone Maleate. Spectrum 37.Calibration Spectrum of Rabeprazole sodium and Domperidone Maleate.
Spectrum 38.Prediction Spectrum of Rabeprazole sodium and Domperidone Maleate.
Spectrum 39. Assay Spectrum of Rabeprazole sodium and Domperidone Maleate.
Spectrum 40. Accuracy Spectrum of Rabeprazole sodium and Domperidone Maleate.
Spectrum. 41 Overlaid Spectrum of Lafutidine and Domperidone Maleate.
Spectrum. 42 Calibration Spectrum of Lafutidine and Domperidone Maleate.
Spectrum 43.Prediction Spectrum of Lafutidine and Domperidone Maleate.
Spectrum 45. Accuracy Spectrum of Lafutidine and Domperidone Maleate.
Spectrum. 46 Overlaid Spectrum of Famotidine, Diclofenac Potassium, Chloroxazone and Paracetamol.
Spectrum. 47 Calibration Spectrum of Famotidine, Diclofenac Potassium, Chloroxazone and Paracetamol.
Spectrum 48.Prediction Spectrum of Famotidine, Diclofenac Potassium, Chloroxazone and Paracetamol.
Spectrum 49. Assay Spectrum of Famotidine, Diclofenac Potassium, Chloroxazone and Paracetamol.
Spectrum 50 Accuracy Spectrum of Famotidine, Diclofenac potassium, Chloroxazone and Paracetamol.
Spectrum. 51 Overlaid Spectrum of Phenylephrine Hcl, Paracetamol, Caffeine and Cetrizine Di Hcl.
Spectrum. 52 Calibration Spectrum of Phenylephrine Hcl, Paracetamol, Caffeine and Cetrizine Dihcl.
Spectrum 53.Prediction Spectrum of Phenylephrine Hcl, Paracetamol, Caffeine and Cetrizine Di Hcl.
Spectrum 54. Assay Spectrum of Phenylephrine Hcl, Paracetamol, Caffeine and Cetrizine Di Hcl.
Spectrum 55. Accuracy Spectrum of Phenylephrine Hcl,Paracetamol,Caffeine and Cetrizine Di Hcl.
Spectrum. 56. Overlaid Spectrum of Phenylephrine Hcl, Paracetamol, Caffeine and Chlorpheniramine Maleate.
Spectrum. 57. Calibration Spectrum of Phenylephrine Hcl, Paracetamol, Caffeine and Chlorpheniramine Maleate.
Spectrum 59. Assay Spectrum of Phenylephrine Hcl, Paracetamol, Caffeine and Chlorpheniramine Maleate.
LIST OF GRAPHS
UV GRAPHS
Graph.1 PLS Calibration and Prediction curves of Drotaverine Hcl
Graph.2 PLS Calibration and Prediction curves of Mefenamic acid
Graph.3 PCR Calibration and Prediction curves of Drotaverine Hcl
Graph.4 PCR Calibration and Prediction curves of Mefenamic acid
Graph.5 PLS Calibration and Prediction curves of Etoricoxib
Graph.6 PLS Calibration and Prediction curves of Paracetamol
Graph.7 PCR Calibration and Prediction curves of Etoricoxib
Graph.8 PCR Calibration and Prediction curves of Paracetamol.
Graph.9 PLS Calibration and Prediction curves of Tolperisone Hcl.
Graph.10 PLS Calibration and Prediction curves of Paracetamol
Graph.11 PCR Calibration and Prediction curves of Tolperisone Hcl.
Graph.12 PCR Calibration and Prediction curves of Paracetamol.
Graph.13 PLS Calibration and Prediction curves of Thiocholchicoside.
Graph.14 PLS Calibration and Prediction curves of Etoricoxib
Graph.15 PCR Calibration and Prediction curves of Thiocholchicoside.
Graph16. PCR Calibration and Prediction curves of Etoricoxib.
Graph17. PLS Calibration and Prediction curves of Thiocholchicoside
Graph18. PLS Calibration and Prediction curves of Aceclofenac sodium
Graph.19 PLS Calibration and Prediction curves of Paracetamol.
Graph.20 PCR Calibration and Prediction curves of Thiocholchicoside.
Graph.22 PCR Calibration and Prediction curves of Paracetamol.
Graph.23 PLS Calibration and Prediction curves of Diacerein.
Graph.24 PLS Calibration and Prediction curves of Aceclofenac sodium
Graph.25 PCR Calibration and Prediction curves of Diacerein.
Graph.26 PCR Calibration and Prediction curves of Aceclofenac sodium.
Graph.27 PLS Calibration and Prediction curves of Diacerein.
Graph.28 PLS Calibration and Prediction curves of Celecoxib
Graph.29 PCR Calibration and Prediction curves of Diacerein.
Graph.30 PCR Calibration and Prediction curves of Celecoxib
Graph.31 PLS Calibration and Prediction curves of Rabeprazole sodium.
Graph.32 PLS Calibration and Prediction curves of Domperidone Maleate.
Graph.33 PCR Calibration and Prediction curves of Rabeprazole sodium.
Graph.34 PCR Calibration and Prediction curves of Domperidone Maleate.
Graph.35 PLS Calibration and Prediction curves of Lafutidine.
Graph.36 PLS Calibration and Prediction curves of Domperidone Maleate.
Graph.37 PCR Calibration and Prediction curves of Lafutidine.
Graph.38 PCR Calibration and Prediction curves of Domperidone Maleate.
Graph.39 PLS Calibration and Prediction curves of Famotidine
Graph.40 PLS Calibration and Prediction curves of Diclofenac Potassium.
Graph.41 PLS Calibration and Prediction curves of Chloroxazone.
Graph.42 PLS Calibration and Prediction curves of Paracetamol.
Graph.43 PCR Calibration and Prediction curves of Famotidine
Graph.45 PCR Calibration and Prediction curves of Chloroxazone.
Graph.46 PCR Calibration and Prediction curves of Paracetamol.
Graph.47 PLS Calibration and Prediction curves of Phenylephrine Hcl
Graph.48 PLS Calibration and Prediction curves of Paracetamol.
Graph.49 PLS Calibration and Prediction curves of Caffeine
Graph.50 PLS Calibration and Prediction curves of Cetrizine Di Hcl.
Graph.51 PCR Calibration and Prediction curves of Phenylephrine Hcl
Graph.52 PCR Calibration and Prediction curves of Paracetamol.
Graph.53 PCR Calibration and Prediction curves of Caffeine.
Graph.54 PCR Calibration and Prediction curves of Cetrizine Di Hcl.
Graph.55 PLS Calibration and Prediction curves of Phenylephrine Hcl
Graph.56 PLS Calibration and Prediction curves of Paracetamol.
Graph.57 PLS Calibration and Prediction curves of Caffeine
Graph.58 PLS Calibration and Prediction curves of Chlorpheniramine Maleate.
Graph.59 PCR Calibration and Prediction curves of Phenylephrine Hcl
Graph.60 PCR Calibration and Prediction curves of Paracetamol.
Graph.61 PCR Calibration and Prediction curves of Caffeine.
RP-UHPLC GRAPHS
Graph.63 Calibration curve of Drotaverine Hcl.
Graph.64 Residual plot of Drotaverine Hcl.
Graph.65 Calibration curve of Mefenamic acid.
Graph.66 Residual plot of Mefenamic acid.
Graph.67 Calibration curve of Etoricoxib.
Graph.68 Residual plot of Etoricoxib.
Graph.69 Calibration curve of Paracetamol.
Graph.70 Residual plot of Paracetamol
Graph.71 Calibration curve of Tolperisone Hcl.
Graph.72 Residual plot of Tolperisone Hcl.
Graph.73 Calibration curve of Thiocholchicoside.
Graph.74 Residual plot of Thiocholchicoside.
Graph.75 Calibration curve of Aceclofenac Sodium
Graph.76 Residual plot of Aceclofenac Sodium.
Graph.77 Calibration curve of Diacerein.
Graph.78 Residual plot of Diacerein.
Graph.79 Calibration curve of Aceclofenac Sodium.
Graph.80 Residual plot of Aceclofenac Sodium.
Graph.81 Calibration curve of Celecoxib.
Graph.82 Residual plot of Celecoxib.
Graph.83 Calibration curve of Rabeprazole sodium.
Graph.85 Calibration curve of Domperidone Maleate.
Graph86. Residual plot of Domperidone Maleate.
Graph 87. Calibration curve of Lafutidine.
Graph 88. Residual plot of Lafutidine.
Graph 89. Calibration curve of Famotidine.
Graph 90. Residual plot of Famotidine.
Graph 91.Calibration curve of Diclofenac potassium.
Graph 92. Residual plot of Diclofenac Potassium
Graph 93. Calibration curve of Chloroxazone.
Graph 94. Residual plot of Chloroxazone.
Graph 95. Calibration curve of Paracetamol.
Graph 96. Residual plot of Paracetamol.
Graph 97. Calibration curve of Phenylephrine Hcl
Graph 98. Residual plot of Phenylephrine Hcl
Graph 99. Calibration curve of Paracetamol.
Graph 100. Residual plot of Paracetamol
Graph 101. Calibration curve of Caffeine.
Graph102. Residual plot of Caffeine
Graph 103. Calibration curve of Cetrizine Di Hcl.
Graph104. Residual plot of Cetrizine Di Hcl.
Graph105. Calibration curve of Phenylephrine Hcl
Graph106. Residual plot of Phenylephrine Hcl.
Graph108. Residual plot of Paracetamol
Graph109. Calibration curve of Caffeine.
Graph110. Residual plot of Caffeine.
Graph111. Calibration curve of Chlorpheniramine Maleate.
Graph112. Residual plot of Chlorpheniramine Maleate.
Robustness graph -RP-UHPLC
Graph 113.Factorial Response graph of Drotaverine Hcl Graph 114.Factorial Response graph of Mefenamic acid Graph 115.Factorial Response graph of Etoricoxib Graph 116.Factorial Response graph of Paracetamol Graph 117.Factorial Response graph of Tolperisone Hcl Graph 118.Factorial Response graph of Paracetamol Graph 119.Factorial Response graph of Thiocolchicoside Graph 120.Factorial Response graph of Etoricoxib Graph 121.Factorial Response graph of Thiocolchicoside Graph 122.Factorial Response graph of Aceclofenac Sodium Graph 123.Factorial Response graph of Paracetamol
Graph 124.Factorial Response graph of Diacerein
Graph 125.Factorial Response graph of Aceclofenac Sodium Graph 126.Factorial Response graph of Diacerein
Graph 127.Factorial Response graph of Celecoxib
Graph 128.Factorial Response graph of Rabeprazole Sodium Graph 129.Factorial Response graph of Domperidone Maleate Graph 130.Factorial Response graph of Lafutidine
Graph 132.Factorial Response graph of Famotidine Graph 133.Factorial Response graph of Paracetamol Graph 134.Factorial Response graph of Chloroxazone
Graph 135.Factorial Response graph of Diclofenac Potassium Graph 136.Factorial Response graph of Phenylephrine Hcl Graph 137.Factorial Response graph of Paracetamol Graph 138.Factorial Response graph of Caffeine
Graph 139.Factorial Response graph of Cetrizine Di Hcl Graph 140.Factorial Response graph of Phenylephrine Hcl Graph 141.Factorial Response graph of Paracetamol Graph 142.Factorial Response graph of Caffeine
HPTLC GRAPHS
Graph144. Calibration curve of Drotaverine Hcl.
Graph145. Residual plot of Drotaverine Hcl.
Graph146. Calibration curve of Mefenamic acid.
Graph147. Residual plot of Mefenamic acid
Graph148. Calibration curve of Diacerein.
Graph 149. Residual plot of Diacerein.
Graph150. Calibration curve of Celecoxib.
Graph151. Residual plot of Celecoxib
Graph152.Calibration curve of Tolperisone Hcl.
Graph. 153. Residual plot of Tolperisone Hcl.
Graph.154 Calibration curve of Paracetamol.
Graph.155 Residual plot of Paracetamol
Graph.156 Calibration curve of Lafutidine.
Graph.157 Residual plot of Lafutidine.
Graph.158 Calibration curve of Domperidone Maleate.
Graph.159 Residual plot of Domperidone Maleate.
Graph.160 Calibration curve of Thiocolchicoside.
Graph.161 Residual plot of Thiocolchicoside
Graph.162 Calibration curve of Aceclofenac Sodium
Graph.163 Residual plot of Aceclofenac Sodium.
Graph.164 Calibration curve of Paracetamol.
Robustness graph –HPTLC
Graph 166.Factorial Response graph of Drotaverine Hcl Graph 167.Factorial Response graph of Mefenamic acid Graph 168.Factorial Response graph of Diacerein Graph 169.Factorial Response graph of Celecoxib Graph 170.Factorial Response graph of Tolperisone Hcl Graph 171.Factorial Response graph of Paracetamol Graph 172.Factorial Response graph of Lafutidine
LIST OF CHROMATOGRAM
I. Drotaverine Hcl and Mefenamic AcidChromatogram .1 Chromatogram of Diluent
Chromatogram.2 Individual Chromatogram of Drotaverine Hcl
Chromatogram.3 Individual Chromatogram of Mefenamic acid
Chromatogram.4 Chromatogram of Mixed standard (Drotaverine Hcl and Mefenamic acid)
Chromatogram.5 Chromatogram of Sample (Drotaverine Hcl and Mefenamic acid)
Chromatogram.6 Linearity of Drotaverine Hcl and Mefenamic acid-Level-1.
Chromatogram.7 Linearity of Drotaverine Hcl and Mefenamic acid-Level-2.
Chromatogram.8 Linearity of Drotaverine Hcl and Mefenamic acid-Level-3.
Chromatogram.9 Linearity of Drotaverine Hcl and Mefenamic acid-Level-4.
Chromatogram.10 Linearity of Drotaverine Hcl and Mefenamic acid-Level-5.
Chromatogram.11 Linearity of Drotaverine Hcl and Mefenamic acid-Level-6.
Chromatogram.12 Linearity of Drotaverine Hcl and Mefenamic acid-Level-7.
Chromatogram.13 System precision of Drotaverine Hcl and Mefenamic acid
Chromatogram.14 Method precision of Drotaverine Hcl and Mefenamic acid
Chromatogram.15 Recovery of Drotaverine Hcl and Mefenamic acid –Level -1 (80%)
Chromatogram.16 Recovery of Drotaverine Hcl and Mefenamic acid –Level -2 (100%)
Chromatogram.17 Recovery of Drotaverine Hcl and Mefenamic acid –Level -3 (120%)
Chromatogram.18 Robustness of Drotaverine Hcl and Mefenamic acid –Run 1
Chromatogram.19 Robustness of Drotaverine Hcl and Mefenamic acid –Run 2
Chromatogram.20 Robustness of Drotaverine Hcl and Mefenamic acid –Run 3
Chromatogram.22 Robustness of Drotaverine Hcl and Mefenamic acid –Run 5
Chromatogram.23 Robustness of Drotaverine Hcl and Mefenamic acid –Run 6
Chromatogram.24 Robustness of Drotaverine Hcl and Mefenamic acid –Run 7
Chromatogram.25 Robustness of Drotaverine Hcl and Mefenamic acid –Run 8
2. PETTA-(Paracetamol, Etoricoxib, Thiocholchicoside, Tolperisone Hcl and
Aceclofenac Sodium
Chromatogram.26 Chromatogram of Diluent
Chromatogram.27 Individual Chromatogram of Paracetamol
Chromatogram.28 Individual Chromatogram of Etoricoxib
Chromatogram.29 Individual Chromatogram of Thiocolchicoside
Chromatogram.30Individual Chromatogram of Tolperisone Hcl
Chromatogram.31 Individual Chromatogram of Aceclofenac sodium
Chromatogram.32 Chromatogram of Mixed standard
Chromatogram.33 Chromatogram of sample (Etoricoxib and Paracetamol)
Chromatogram.34 Chromatogram of sample (Tolperisone Hcl and Paracetamol)
Chromatogram.35 Chromatogram of sample (Thiocholchicoside and Etoricoxib)
Chromatogram.36 Chromatogram of sample (Thiocholchicoside, Aceclofenac sodium and Paracetamol)
Chromatogram.37 Linearity of PETTA– Level-1
Chromatogram.38 Linearity of PETTA– Level-2
Chromatogram.39 Linearity of PETTA– Level-3
Chromatogram.40 Linearity of PETTA– Level-4
Chromatogram.42 Linearity of PETTA– Level-6
Chromatogram.43 Linearity of PETTA– Level-7
II. Etoricoxib and Paracetamol
Chromatogram.44 System precision of Etoricoxib and Paracetamol
Chromatogram.45 Method precision of Etoricoxib and Paracetamol
Chromatogram.46 Recovery of Etoricoxib and Paracetamol Level -1 (80%)
Chromatogram.47 Recovery of Etoricoxib and Paracetamol Level -2 (100%)
Chromatogram.48 Recovery of Etoricoxib and Paracetamol Level -3 (120%)
Chromatogram.49 Robustness of Etoricoxib and Paracetamol - Run-1
Chromatogram.50 Robustness of Etoricoxib and Paracetamol - Run-2
Chromatogram.51 Robustness of Etoricoxib and Paracetamol - Run-3
Chromatogram.52 Robustness of Etoricoxib and Paracetamol - Run-4
Chromatogram.53 Robustness of Etoricoxib and Paracetamol - Run-5
Chromatogram.54 Robustness of Etoricoxib and Paracetamol - Run-6
Chromatogram.55 Robustness of Etoricoxib and Paracetamol - Run-7
Chromatogram.56 Robustness of Etoricoxib and Paracetamol - Run-8
III. Tolperisone Hcl and Paracetamol
Chromatogram.57 System precision of Tolperisone Hcl and Paracetamol
Chromatogram.58 Method precision of Tolperisone Hcl and Paracetamol
Chromatogram.59 Recovery of Tolperisone Hcl and Paracetamol -Level-1 (80%)
Chromatogram.60 Recovery of Tolperisone Hcl and Paracetamol -Level-2 (100%)
Chromatogram.61 Recovery of Tolperisone Hcl and Paracetamol -Level-3 (120%)
Chromatogram.63 Robustness of Tolperisone Hcl and Paracetamol -Run-2
Chromatogram.64 Robustness of Tolperisone Hcl and Paracetamol -Run-3
Chromatogram.65 Robustness of Tolperisone Hcl and Paracetamol -Run-4
Chromatogram.66 Robustness of Tolperisone Hcl and Paracetamol -Run-5
Chromatogram.67 Robustness of Tolperisone Hcl and Paracetamol -Run-6
Chromatogram.68 Robustness of Tolperisone Hcl and Paracetamol -Run-7
Chromatogram.69 Robustness of Tolperisone Hcl and Paracetamol -Run-8
IV. Thiocolchicoside and Etoricoxib
Chromatogram.70 System Precision of Thiocolchicoside and Etoricoxib
Chromatogram.71 Method Precision of Thiocolchicoside and Etoricoxib
Chromatogram.72 Recovery of Thiocolchicoside and Etoricoxib -Level-1(80%)
Chromatogram.73 Recovery of Thiocolchicoside and Etoricoxib -Level-2(100%)
Chromatogram.74 Recovery of Thiocolchicoside and Etoricoxib -Level-3(120%)
Chromatogram.75 Robustness of Thiocolchicoside and Etoricoxib – Run-1
Chromatogram.76 Robustness of Thiocolchicoside and Etoricoxib – Run-2
Chromatogram.77 Robustness of Thiocolchicoside and Etoricoxib – Run-3
Chromatogram.78 Robustness of Thiocolchicoside and Etoricoxib – Run-4
Chromatogram.79 Robustness of Thiocolchicoside and Etoricoxib – Run-5
Chromatogram.80 Robustness of Thiocolchicoside and Etoricoxib – Run-6
Chromatogram.81 Robustness of Thiocolchicoside and Etoricoxib – Run-7
V. Thiocolchicoside, Aceclofenac Sodium and Paracetamol
Chromatogram.83 System Precision of Thiocolchicoside, Aceclofenac sodium and Paracetamol
Chromatogram.84 Method Precision of Thiocolchicoside, Aceclofenac sodium and Paracetamol
Chromatogram.85 Recovery of Thiocolchicoside, Aceclofenac sodium and Paracetamol – Level -1-(80%)
Chromatogram.86 Recovery of Thiocolchicoside, Aceclofenac sodium and Paracetamol – Level -2-(100%)
Chromatogram.87 Recovery of Thiocolchicoside, Aceclofenac sodium and Paracetamol – Level -3-(120%)
Chromatogram.88 Robustness of Thiocolchicoside, Aceclofenac sodium and Paracetamol – Run – 1
Chromatogram.89 Robustness of Thiocolchicoside, Aceclofenac sodium and Paracetamol – Run – 2
Chromatogram.90 Robustness of Thiocolchicoside, Aceclofenac sodium and Paracetamol – Run – 3
Chromatogram.91 Robustness of Thiocolchicoside, Aceclofenac sodium and Paracetamol – Run – 4
Chromatogram.92 Robustness of Thiocolchicoside, Aceclofenac sodium and Paracetamol – Run – 5
Chromatogram.93 Robustness of Thiocolchicoside, Aceclofenac sodium and Paracetamol – Run – 6
Chromatogram.94 Robustness of Thiocolchicoside, Aceclofenac sodium and Paracetamol – Run – 7
3. DAC (Diacerein, Aceclofenac Sodium and Celecoxib)
Chromatogram.96 Chromatogram of Diluent
Chromatogram.97 Individual Chromatogram of Diacerein
Chromatogram.98 Individual Chromatogram of Aceclofenac sodium
Chromatogram.99 Individual Chromatogram of Celecoxib
Chromatogram.100 Linearity of DAC – Level -1
Chromatogram.101 Linearity of DAC – Level -2
Chromatogram.102 Linearity of DAC – Level -3
Chromatogram.103 Linearity of DAC – Level -4
Chromatogram.104 Linearity of DAC – Level -5
Chromatogram.105 Linearity of DAC – Level -6
Chromatogram.106 Linearity of DAC – Level -7
VI. Diacerein and Aceclofenac Sodium
Chromatogram.107 System Precision of Diacerein and Aceclofenac sodium
Chromatogram.108 Method Precision of Diacerein and Aceclofenac Sodium
Chromatogram.109 Recovery of Diacerein and Aceclofenac Sodium - Level – 1 (80%)
Chromatogram.110 Recovery of Diacerein and Aceclofenac Sodium Level – 2 (100%)
Chromatogram.111 Recovery of Diacerein and Aceclofenac Sodium - Level – 3 (120%)
Chromatogram.112 Robustness of Diacerein and Aceclofenac Sodium – Run -1
Chromatogram.113 Robustness of Diacerein and Aceclofenac Sodium – Run -2
Chromatogram.114 Robustness of Diacerein and Aceclofenac Sodium – Run -3
Chromatogram.115 Robustness of Diacerein and Aceclofenac Sodium – Run -4
Chromatogram.117 Robustness of Diacerein and Aceclofenac Sodium – Run -6
Chromatogram.118 Robustness of Diacerein and Aceclofenac Sodium – Run -7
Chromatogram.119 Robustness of Diacerein and Aceclofenac Sodium – Run -8
VII. Diacerein and Celecoxib
Chromatogram.120 System Precision of Diacerein and Celecoxib Chromatogram.121 Method Precision of Diacerein and Celecoxib
Chromatogram.122 Recovery of Diacerein and Celecoxib - Level – 1 (80%) Chromatogram.123 Recovery of Diacerein and Celecoxib - Level – 2 (100%) Chromatogram.124 Recovery of Diacerein and Celecoxib - Level – 3 (120%) Chromatogram.125 Robustness of Diacerein and Celecoxib – Run -1
Chromatogram.126 Robustness of Diacerein and Celecoxib – Run -2 Chromatogram.127 Robustness of Diacerein and Celecoxib – Run -3 Chromatogram.128 Robustness of Diacerein and Celecoxib – Run -4 Chromatogram.129 Robustness of Diacerein and Celecoxib – Run -5 Chromatogram.130 Robustness of Diacerein and Celecoxib – Run -6 Chromatogram.131 Robustness of Diacerein and Celecoxib – Run -7 Chromatogram.132 Robustness of Diacerein and Celecoxib – Run -8
4. RLD (Rabeprazole sodium, Lafutidine and Domperidone maleate)
Chromatogram.133 Chromatogram of Diluent
Chromatogram.134 Individual Chromatogram of Rabeprazole sodium Chromatogram.135 Individual Chromatogram of Lafutidine
Chromatogram.136 Individual Chromatogram of Domperidone Maleate Chromatogram.137 Linearity of RLD – Level -1
Chromatogram.141 Linearity of RLD – Level -5 Chromatogram.142 Linearity of RLD – Level -6 Chromatogram.143 Linearity of RLD – Level -7
VIII. Rabeprazole Sodium and Domperidone Maleate
Chromatogram.144 System Precision of Rabeprazole Sodium and Domperidone Maleate Chromatogram.145 Method Precision of Rabeprazole Sodium and Domperidone Maleate Chromatogram.146 Recovery Rabeprazole Sodium and Domperidone Maleate –
Level-1(80%)
Chromatogram.147 Recovery Rabeprazole Sodium and Domperidone Maleate – Level-2 (100%)
Chromatogram.148 Recovery Rabeprazole Sodium and Domperidone Maleate – Level-3(120%)
Chromatogram.149 Robustness of Rabeprazole Sodium and Domperidone Maleate – Run-1 Chromatogram.150 Robustness of Rabeprazole Sodium and Domperidone Maleate – Run-2 Chromatogram.151 Robustness of Rabeprazole Sodium and Domperidone Maleate – Run-3 Chromatogram.152 Robustness of Rabeprazole Sodium and Domperidone Maleate – Run-4 Chromatogram.153 Robustness of Rabeprazole Sodium and Domperidone Maleate – Run-5 Chromatogram.154 Robustness of Rabeprazole Sodium and Domperidone Maleate – Run-6 Chromatogram.155 Robustness of Rabeprazole Sodium and Domperidone Maleate – Run-7 Chromatogram.156 Robustness of Rabeprazole Sodium and Domperidone Maleate – Run-8
IX. Lafutidine and Domperidone Maleate
Chromatogram.157 System Precision of Lafutidine and Domperidone Maleate Chromatogram.158 Method Precision of Lafutidine and Domperidone Maleate
Chromatogram.163 Robustness of Lafutidine and Domperidone Maleate – Run-2 Chromatogram.164 Robustness of Lafutidine and Domperidone Maleate – Run-3 Chromatogram.165 Robustness of Lafutidine and Domperidone Maleate – Run-4 Chromatogram.166 Robustness of Lafutidine and Domperidone Maleate – Run-5 Chromatogram.167 Robustness of Lafutidine and Domperidone Maleate – Run-6 Chromatogram.168 Robustness of Lafutidine and Domperidone Maleate – Run-7 Chromatogram.169 Robustness of Lafutidine and Domperidone Maleate – Run-8
X. FPCD (Famotidine, Paracetamol, Chloroxazone and Diclofenac Potassium)
Chromatogram.170 Chromatogram of Diluent
Chromatogram.171 Individual Chromatogram of Famotidine Chromatogram.172 Individual Chromatogram of Paracetamol Chromatogram.173 Individual Chromatogram of Chloroxazone
Chromatogram.174 Individual Chromatogram of Diclofenac Potassium Chromatogram.175 Chromatogram of Mixed Standard
Chromatogram.176 Chromatogram of Sample Chromatogram.177 Linearity of FPCD – Level -1 Chromatogram.178 Linearity of FPCD – Level -2 Chromatogram.179 Linearity of FPCD – Level -3 Chromatogram.180 Linearity of FPCD – Level -4 Chromatogram.181 Linearity of FPCD – Level -5 Chromatogram.182 Linearity of FPCD – Level -6 Chromatogram.183 Linearity of FPCD – Level -7 Chromatogram.184 System Precision of FPCD Chromatogram.185 Method Precision of FPCD
Chromatogram.189 Robustness of FPCD - Run – 1 Chromatogram.190 Robustness of FPCD - Run – 2 Chromatogram.191 Robustness of FPCD - Run – 3 Chromatogram.192 Robustness of FPCD - Run – 4 Chromatogram.193 Robustness of FPCD - Run – 5 Chromatogram.194 Robustness of FPCD - Run – 6 Chromatogram.195 Robustness of FPCD - Run – 7 Chromatogram.196 Robustness of FPCD - Run – 8
XI. PPCCETZ (Phenylephrine Hcl, Paracetamol, Caffeine and Cetrizine Di Hcl)
Chromatogram.197 Chromatogram of Diluent
Chromatogram.198 Individual Chromatogram of Phenylephrine Hcl Chromatogram.199 Individual Chromatogram of Paracetamol Chromatogram.200 Individual Chromatogram of Caffeine
Chromatogram.201 Individual Chromatogram of Cetrizine Di Hcl Chromatogram.202 Linearity of PPCCETZ – Level -1
Chromatogram.203 Linearity of PPCCETZ – Level -2 Chromatogram.204 Linearity of PPCCETZ – Level -3 Chromatogram.205 Linearity of PPCCETZ – Level -4 Chromatogram.206 Linearity of PPCCETZ – Level -5 Chromatogram.207 Linearity of PPCCETZ – Level -6 Chromatogram.208 Linearity of PPCCETZ – Level -7 Chromatogram.209 System Precision of PPCCETZ Chromatogram.210 Method Precision of PPCCETZ
Chromatogram.215 Robustness of PPCCETZ - Run – 2 Chromatogram.216 Robustness of PPCCETZ - Run – 3 Chromatogram.217 Robustness of PPCCETZ - Run – 4 Chromatogram.218 Robustness of PPCCETZ - Run – 5 Chromatogram.219 Robustness of PPCCETZ - Run – 6 Chromatogram.220 Robustness of PPCCETZ - Run – 7 Chromatogram.221 Robustness of PPCCETZ - Run – 8
XII. PPCCPM (Phenylephrine Hcl, Paracetamol, Caffeine and Chlorpheniramine Maleate)
Chromatogram.222 Chromatogram of Diluent
Chromatogram.223 Individual Chromatogram of Phenylephrine Hcl Chromatogram.224 Individual Chromatogram of Paracetamol Chromatogram.225 Individual Chromatogram of Caffeine
Chromatogram.226 Individual Chromatogram of Chlorpheniramine Maleate Chromatogram.227 Linearity of PPCCPM – Level -1
Chromatogram.228 Linearity of PPCCPM – Level -2 Chromatogram.229 Linearity of PPCCPM – Level -3 Chromatogram.230 Linearity of PPCCPM – Level -4 Chromatogram.231 Linearity of PPCCPM – Level -5 Chromatogram.232 Linearity of PPCCPM – Level -6 Chromatogram.233 Linearity of PPCCPM – Level -7 Chromatogram.234 System Precision of PPCCPM Chromatogram.235 Method Precision of PPCCPM
LIST OF DENSITOGRAMS
I. Drotaverine Hcl and Mefenamic Acid
Densitogram .1 Densitogram of Blank
Densitogram.2 Individual Densitogram of Drotaverine Hcl
Densitogram.3 Individual Densitogram of Mefenamic acid
Densitogram.4 Densitogram of Mixed standard (Drotaverine Hcl and Mefenamic acid)
Densitogram.5 Densitogram of Sample (Drotaverine Hcl and Mefenamic acid)
Densitogram.6 Overlay Specificity of Drotaverine Hcl and Mefenamic acid
Densitogram.7 Overlay Linearity of Drotaverine Hcl and Mefenamic acid Densitogram.8 Overlay Precision of Drotaverine Hcl and Mefenamic acid Densitogram.9 Overlay Recovery of Drotaverine Hcl and Mefenamic acid Densitogram.10 Robustness of Drotaverine Hcl and Mefenamic acid - Run -1 Densitogram.11 Robustness of Drotaverine Hcl and Mefenamic acid - Run -2 Densitogram.12 Robustness of Drotaverine Hcl and Mefenamic acid - Run -3 Densitogram.13 Robustness of Drotaverine Hcl and Mefenamic acid - Run -4 Densitogram.14 Robustness of Drotaverine Hcl and Mefenamic acid - Run -5 Densitogram.15 Robustness of Drotaverine Hcl and Mefenamic acid - Run -6 Densitogram.16 Robustness of Drotaverine Hcl and Mefenamic acid - Run -7 Densitogram.17 Robustness of Drotaverine Hcl and Mefenamic acid - Run -8
II. Diacerein and Celecoxib
Densitogram.18 Densitogram of Blank
Densitogram.19 Individual Densitogram of Diacerein
Densitogram.20 Individual Densitogram of Celecoxib
Densitogram.23 Overlay Specificity of Diacerein and Celecoxib Densitogram.24 Overlay Linearity of Diacerein and Celecoxib Densitogram.25 Overlay Precision of Diacerein and Celecoxib Densitogram.26 Overlay Recovery of Diacerein and Celecoxib Densitogram.27 Robustness of Diacerein and Celecoxib - Run -1 Densitogram.28 Robustness of Diacerein and Celecoxib - Run -2 Densitogram.29 Robustness of Diacerein and Celecoxib - Run -3 Densitogram.30 Robustness of Diacerein and Celecoxib - Run -4 Densitogram.31 Robustness of Diacerein and Celecoxib - Run -5 Densitogram.32 Robustness of Diacerein and Celecoxib - Run -6 Densitogram.33 Robustness of Diacerein and Celecoxib - Run -7 Densitogram.34 Robustness of Diacerein and Celecoxib - Run -8
III. Tolperisone Hcl and Paracetamol
Densitogram.35 Densitogram of Blank
Densitogram.36 Individual Densitogram of Tolperisone Hcl
Densitogram.37 Individual Densitogram of Paracetamol
Densitogram.38 Densitogram of Mixed standard (Tolperisone Hcl and Paracetamol) Densitogram.39 Densitogram of Sample (Tolperisone Hcl and Paracetamol)
Densitogram.40 Overlay Specificity of Tolperisone Hcl and Paracetamol
Densitogram.48 Robustness of Tolperisone Hcl and Paracetamol - Run -5 Densitogram.49 Robustness of Tolperisone Hcl and Paracetamol - Run -6 Densitogram.50 Robustness of Tolperisone Hcl and Paracetamol - Run -7 Densitogram.51 Robustness of Tolperisone Hcl and Paracetamol - Run -8
IV. Lafutidine and Domperidone Maleate
Densitogram.52 Densitogram of Blank
Densitogram.53 Individual Densitogram of Lafutidine
Densitogram.54 Individual Densitogram of Domperidone Maleate
Densitogram.55 Densitogram of Mixed standard (Lafutidine and Domperidone Maleate) Densitogram.56 Densitogram of Sample (Lafutidine and Domperidone Maleate)
Densitogram.57 Overlay Specificity of Lafutidine and Domperidone Maleate
Densitogram.58 Overlay Linearity of Lafutidine and Domperidone Maleate Densitogram.59 Overlay Precision of Lafutidine and Domperidone Maleate Densitogram.60 Overlay Recovery of Lafutidine and Domperidone Maleate Densitogram.61 Robustness of Lafutidine and Domperidone Maleate - Run -1 Densitogram.62 Robustness of Lafutidine and Domperidone Maleate - Run -2 Densitogram.63 Robustness of Lafutidine and Domperidone Maleate - Run -3 Densitogram.64 Robustness of Lafutidine and Domperidone Maleate - Run -4 Densitogram.65 Robustness of Lafutidine and Domperidone Maleate - Run -5 Densitogram.66 Robustness of Lafutidine and Domperidone Maleate - Run -6 Densitogram.67 Robustness of Lafutidine and Domperidone Maleate - Run -7 Densitogram.68 Robustness of Lafutidine and Domperidone Maleate - Run -8
V. Thiocolchicoside, Aceclofenac Sodium and Paracetamol
Densitogram.69 Densitogram of Blank
Densitogram.70 Individual Densitogram of Thiocolchicoside
Densitogram.72 Individual Densitogram of Paracetamol
Densitogram.73 Densitogram of Mixed standard (Thiocolchicoside, Aceclofenac Sodium and Paracetamol)
Densitogram.74 Densitogram of Sample (Thiocolchicoside, Aceclofenac Sodium and Paracetamol)
Densitogram.75 Overlay Specificity of Thiocolchicoside, Aceclofenac Sodium and Paracetamol
Densitogram.76 Overlay Linearity of Thiocolchicoside, Aceclofenac Sodium and Paracetamol
Densitogram.77 Overlay Precision of Thiocolchicoside, Aceclofenac Sodium and Paracetamol
Densitogram.78 Overlay Recovery of Thiocolchicoside, Aceclofenac Sodium and Paracetamol
Densitogram.79 Robustness of Thiocolchicoside, Aceclofenac Sodium and Paracetamol - Run -1
Densitogram.80 Robustness of Thiocolchicoside, Aceclofenac Sodium and Paracetamol - Run -2
Densitogram.81 Robustness of Thiocolchicoside, Aceclofenac Sodium and Paracetamol - Run -3
Densitogram.82 Robustness of Thiocolchicoside, Aceclofenac Sodium and Paracetamol - Run -4
Densitogram.83 Robustness of Thiocolchicoside, Aceclofenac Sodium and Paracetamol - Run -5
Densitogram.84 Robustness of Thiocolchicoside, Aceclofenac Sodium and Paracetamol - Run -6
Densitogram.85 Robustness of Thiocolchicoside, Aceclofenac Sodium and Paracetamol - Run -7
LIST OF TABLES
UV TABLES
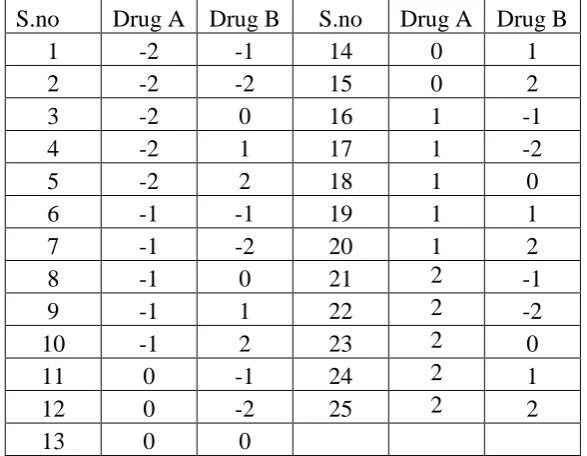
Table: 1 Five - level Factorial design of Calibration set for Double combination
Table: 2 Five - level Factorial design of Calibration set for Triple combination
Table: 3 Five - level Factorial design of Calibration set for Tetra combination
Table: 4 Three - level Factorial design of Prediction set for Double combination
Table: 5 Three - level Factorial design of Prediction set for Triple combination
Table: 6 Three - level Factorial design of Prediction set for Tetra combination
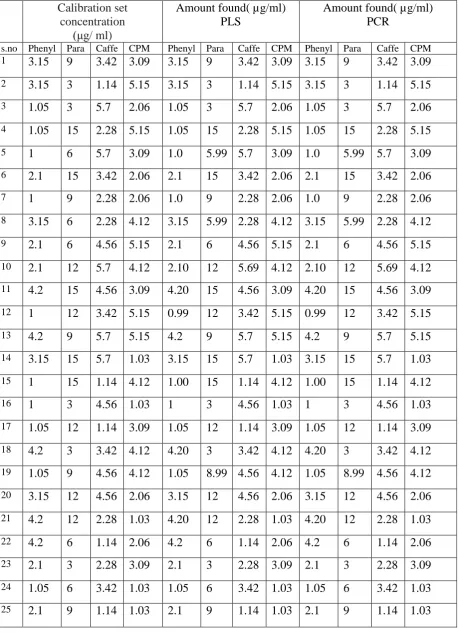
I. DROTAVERINE HCL AND MEFENAMIC ACID
Table: 7 Calibration (training set) composition of calibration set for PLS
and PCR methods.
Table: 8 Validation (prediction set) composition of validation set for PLS
and PCR methods.
Table: 9 Analysis of tablet Formulation.
Table: 10 Precision data.
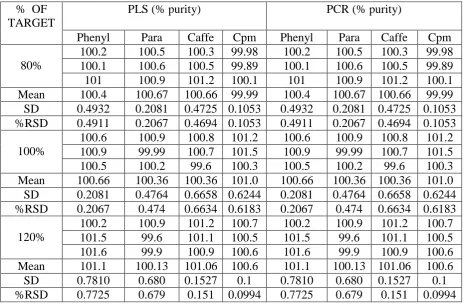
Table: 11 Analysis of validation set by PLS and PCR methods (Recovery Studies).
Table: 12 Summary of statistics in PLS and PCR methods for Drotaverine hcl and Mefenamic acid in the mixture.
II. ETORICOXIB AND PARACETAMOL
Table: 13 Calibration (training set) composition of calibration set for PLS and PCR methods.
Table: 14 Validation (prediction set) composition of validation set for PLS and PCR methods.
Table: 16 Precision data.
Table: 17 Analysis of validation set by PLS and PCR methods (Recovery Studies).
Table: 18 Summary of statistics in PLS and PCR methods for Etoricoxib and Paracetamol in the mixture.
III. TOLPERISONE HCL AND PARACETAMOL
Table: 19 Calibration (training set) composition of calibration set for PLS and PCR methods.
Table: 20 Validation (prediction set) composition of validation set for PLS and PCR methods.
Table: 21 Analysis of tablet Formulation.
Table: 22 Precision data.
Table: 23 Analysis of validation set by PLS and PCR methods (Recovery Studies).
Table: 24 Summary of statistics in PLS and PCR methods for Tolperisone Hcl and Paracetamol in the mixture.
IV.THIOCHOLCHICOSIDE AND ETORICOXIB
Table: 25 Calibration (training set) compositions of calibration set for PLS and PCR methods.
Table: 26 Validation (prediction set) composition of validation set for PLS and PCR methods.
Table: 27 Analysis of tablet Formulation.
Table: 28 Precision data.
Table: 29 Analysis of validation set by PLS and PCR methods (Recovery Studies).
Table: 30 Summary of statistics in PLS and PCR methods for Etoricoxib and Paracetamol in the mixture.
Table: 31 Calibration (training set) compositions of calibration set for PLS and PCR methods.
Table: 32 Validation (prediction set) composition of validation set for PLS and PCR methods.
Table: 33 Analysis of tablet Formulation.
Table: 34 Precision data.
Table: 35 Analysis of validation set by PLS and PCR methods (Recovery Studies).
Table: 36 Summary of statistics in PLS and PCR methods for Thiocholchicoside, Aceclofenac sodium and paracetamol in the mixture.
VI. DIACEREIN AND ACECLOFENAC SODIUM
Table: 37 Calibration (training set) compositions of calibration set for PLS and PCR methods.
Table: 38 Validation (prediction set) composition of validation set for PLS and PCR methods.
Table: 39 Analysis of tablet Formulation.
Table: 40 Precision data.
Table: 41 Analysis of validation set by PLS and PCR methods (Recovery Studies).
Table: 42 Summary of statistics in PLS and PCR methods for Diacerein and Aceclofenac in the mixture.
VII. DIACEREIN AND CELECOXIB
Table: 43 Calibration (training set) compositions of calibration set for PLS and PCR methods.
Table: 44 Validation (prediction set) composition of validation set for PLS and PCR methods.
Table: 46 Precision data.
Table: 47 Analysis of validation set by PLS and PCR methods (Recovery Studies).
Table: 48 Summary of statistics in PLS and PCR methods for Diacerein and Celecoxib in the mixture.
VIII.RABEPRAZOLE SODIUM AND DOMPERIDONE MALEATE
Table: 49 Calibration (training set) compositions of calibration set for PLS and PCR methods.
Table: 50 Validation (prediction set) composition of validation set for PLS and PCR methods.
Table: 51 Analysis of tablet Formulation.
Table: 52 Precision data.
Table: 53 Analysis of validation set by PLS and PCR methods (Recovery Studies).
Table: 54 Summary of statistics in PLS and PCR methods for Rabeprazole sodium and Domperidone maleate in the mixture.
IX. LAFUTIDINE AND DOMPERIDONE MALEATE
Table: 55 Calibration (training set) compositions of calibration set for PLS and PCR methods.
Table: 56 Validation (prediction set) composition of validation set for PLS and PCR methods.
Table: 57 Analysis of tablet Formulation.
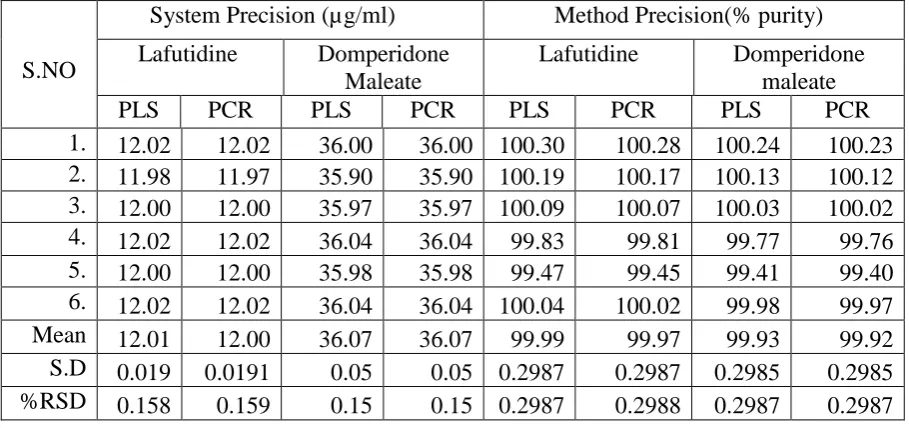
Table: 58 Precision data.
Table: 59 Analysis of validation set by PLS and PCR methods (Recovery Studies).
X. FAMOTIDINE, PARACETAMOL, CHLOROXAZONE AND DICLOFENAC
POTASSIUM
Table: 61 Calibration (training set) compositions of calibration set for PLS and PCR methods.
Table: 62 Validation (prediction set) composition of validation set for PLS and PCR methods.
Table: 63 Analysis of tablet Formulation.
Table: 64 Precision data.
Table: 65 Analysis of validation set by PLS and PCR methods (Recovery Studies).
Table: 66 Summary of statistics in PLS and PCR methods for Famotidine, paracetamol, chloroxazone and diclofenac potassium in the mixture.
XI.PHENYLEPHRINE HCL, PARACETAMOL, CAFFEINE AND CETRIZINE DI
HCL
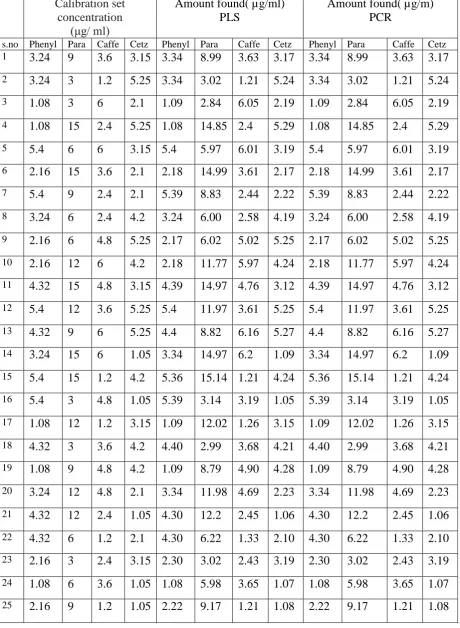
Table: 67 Calibration (training set) compositions of calibration set for PLS and PCR methods.
Table: 68 Validation (prediction set) composition of validation set for PLS and PCR methods.
Table: 69 Analysis of tablet Formulation.
Table: 70 Precision data.
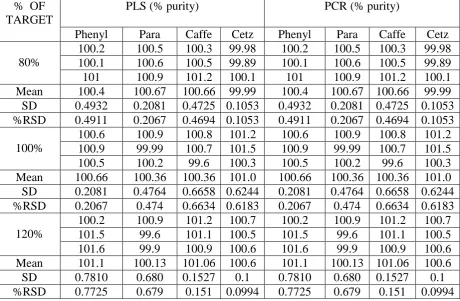
Table: 71 Analysis of validation set by PLS and PCR methods (Recovery Studies).
XII.PHENYLEPHRINE HCL, PARACETAMOL, CAFFEINE AND
CHLORPHENIRAMINE MALEATE
Table: 73 Calibration (training set) compositions of calibration set for PLS and PCR methods.
Table: 74 Validation (prediction set) composition of validation set for PLS and PCR methods.
Table: 75 Analysis of tablet Formulation.
Table: 76 Precision data.
Table: 77 Analysis of validation set by PLS and PCR methods (Recovery Studies).
RP-UHPLC TABLES
I. DROTAVERINE HCL AND MEFENAMIC ACID
Table: 79 Linearity data by RP- UHPLC.
Table: 80 Analytical performance parameters by RP- UHPLC.
Table: 81 Precision data by RP- UHPLC
Table: 82 Analysis of tablet formulation by RP- UHPLC
Table: 83 Accuracy data by RP- UHPLC
Table: 84 System suitability data by RP- UHPLC
Table: 85 Ruggedness data by RP- UHPLC
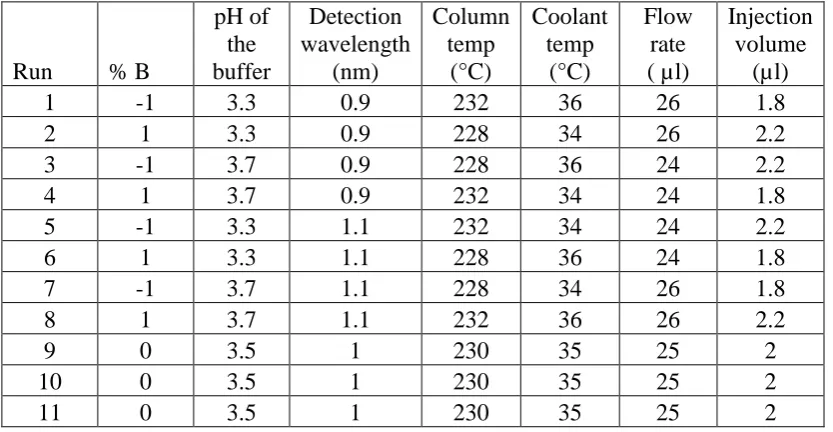
Table: 86 Factorial Design data by RP- UHPLC
Table: 87 Factorial Response data by RP- UHPLC
Table: 88 Effect Summary data of Drotaverine Hcl by RP- UHPLC
Table: 89 Effect Summary data of Mefenamic acid by RP- UHPLC
II. ETORICOXIB AND PARACETAMOL
Table: 90 Linearity data by RP- UHPLC
Table: 91 Analytical performance parameters by RP- UHPLC.
Table: 92 Precision data by RP- UHPLC
Table: 93 Analysis of tablet formulation by RP- UHPLC
Table: 94 Accuracy data by RP- UHPLC
Table: 95 System suitability data by RP- UHPLC
Table: 96 Ruggedness data by RP- UHPLC
Table: 97 Factorial Design data by RP- UHPLC
Table: 99 Effect Summary data of Etoricoxib by RP- UHPLC
Table: 100 Effect Summary data of Paracetamol by RP- UHPLC
III. TOLPERISONE HCL AND PARACETAMOL
Table: 101 Linearity data by RP- UHPLC
Table: 102 Analytical performance parameters by RP- UHPLC
Table: 103 Precision data by RP- UHPLC.
Table: 104 Analysis of tablet formulation by RP- UHPLC.
Table: 105 Accuracy data by RP- UHPLC.
Table: 106 System suitability data by RP- UHPLC.
Table: 107 Ruggedness data by RP- UHPLC.
Table: 108 Factorial Design data by RP- UHPLC.
Table: 109 Factorial Response data by RP- UHPLC.
Table: 110 Effect Summary data of Tolperisone Hcl by RP- UHPLC
Table: 111 Effect Summary data of Paracetamol by RP- UHPLC
IV. THIOCOLCHICOSIDE AND ETORICOXIB
Table: 112 Linearity data by RP- UHPLC.
Table: 113 Analytical performance parameters by RP- UHPLC.
Table: 114 Precision data by RP- UHPLC.
Table: 115 Analysis of tablet formulation by RP- UHPLC.
Table: 116 Accuracy data by RP- UHPLC.
Table: 117 System suitability data by RP- UHPLC.
Table: 118 Ruggedness data by RP- UHPLC.
Table: 120 Factorial Response data by RP- UHPLC.
Table: 121 Effect Summary data of Thiocolchicoside by RP- UHPLC
Table: 122 Effect Summary data of Etoricoxib by RP- UHPLC
V. THIOCOLCHICOSIDE, ACECLOFENAC SODIUM AND PARACETAMOL
Table: 123 Linearity data by RP- UHPLC.
Table: 124 Analytical performance parameters by RP- UHPLC.
Table: 125 Precision data by RP- UHPLC.
Table: 126 Analysis of tablet formulation by RP- UHPLC.
Table: 127 Accuracy data by RP- UHPLC.
Table: 128 System suitability data by RP- UHPLC.
Table: 129 Ruggedness data by RP- UHPLC.
Table: 130 Factorial Design data by RP- UHPLC.
Table: 131 Factorial Response data of Thiocolchicoside and Aceclofenac Sodium by RP- UHPLC.
Table: 132 Factorial Response data of Paracetamol by RP- UHPLC.
Table: 133 Effect Summary data of Thiocolchicoside by RP- UHPLC
Table: 134 Effect Summary data of Aceclofenac Sodium by RP- UHPLC
Table: 135 Effect Summary data of Paracetamol by RP- UHPLC
VI. DIACEREIN AND ACECLOFENAC SODIUM
Table: 136 Linearity data by RP- UHPLC.
Table: 137 Analytical performance parameters by RP- UHPLC.
Table: 138 Precision data by RP- UHPLC.
Table: 140 Accuracy data by RP- UHPLC.
Table: 141 System suitability data by RP- UHPLC.
Table: 142 Ruggedness data by RP- UHPLC.
Table: 143 Factorial Design data by RP- UHPLC.
Table: 144 Factorial Response data by RP- UHPLC.
Table: 145 Effect Summary data of Diacerein by RP- UHPLC
Table: 146 Effect Summary data of Aceclofenac Sodium by RP- UHPLC
VII. DIACEREIN AND CELECOXIB
Table: 147 Linearity data by RP- UHPLC
Table: 148 Analytical performance parameters by RP- UHPLC
Table: 149 Precision data by RP- UHPLC
Table: 150 Analysis of tablet formulation by RP- UHPLC
Table: 151 Accuracy data by RP- UHPLC
Table: 152 System suitability data by RP- UHPLC
Table: 153 Ruggedness data by RP- UHPLC
Table: 154 Factorial Design data by RP- UHPLC
Table: 155 Factorial Response data by RP- UHPLC
Table: 156 Effect Summary data of Diacerein by RP- UHPLC
Table: 157 Effect Summary data of Celecoxib by RP- UHPLC
VIII. RABEPRAZOLE SODIUM AND DOMPERIDONE MALEATE
Table: 158 Linearity data by RP- UHPLC
Table: 159 Analytical performance parameters by RP- UHPLC
Table: 161 Analysis of tablet formulation by RP- UHPLC
Table: 162 Accuracy data by RP- UHPLC
Table: 163 System suitability data by RP- UHPLC
Table: 164 Ruggedness data by RP- UHPLC
Table: 165 Factorial Design data by RP- UHPLC
Table: 166 Factorial Response data by RP- UHPLC
Table: 167 Effect Summary data of Rabeprazole Sodium by RP- UHPLC
Table: 168 Effect Summary data of Domperidone Maleate by RP- UHPLC
IX. LAFUTIDINE AND DOMPERIDONE MALEATE
Table: 169 Linearity data by RP- UHPLC
Table: 170 Analytical performance parameters by RP- UHPLC
Table: 171 Precision data by RP- UHPLC
Table: 172 Analysis of tablet formulation by RP- UHPLC
Table: 173 Accuracy data by RP- UHPLC
Table: 174 System suitability data by RP- UHPLC
Table: 175 Ruggedness data by RP- UHPLC
Table: 176 Factorial Design data by RP- UHPLC
Table: 177 Factorial Response data by RP- UHPLC
Table: 178 Effect Summary data of Lafutidine by RP- UHPLC
X. FAMOTIDINE, PARACETAMOL, CHLOROXAZONE AND DICLOFENAC
POTASSIUM
Table: 180 Linearity data RP- UHPLC.
Table: 181 Analytical performance parameters RP- UHPLC.
Table: 182 System Precision data RP- UHPLC.
Table: 183 Method Precision data RP- UHPLC
Table: 184 Analysis of tablet formulation RP- UHPLC.
Table: 185 Accuracy data RP- UHPLC.
Table: 186 System suitability data RP- UHPLC.
Table: 187 Ruggedness data RP- UHPLC.
Table: 188 Factorial Design data RP- UHPLC.
Table: 189 Factorial Response data of Famotidine and Paracetamol by RP- UHPLC.
Table: 190 Factorial Response data of Chloroxazone and Diclofenac Potassium by RP- UHPLC.
Table: 191 Effect Summary data of Famotidine by RP- UHPLC
Table: 192 Effect Summary data of Paracetamol by RP- UHPLC
Table: 193 Effect Summary data of Chloroxazone by RP- UHPLC
Table: 194 Effect Summary data of Diclofenac Potassium by RP- UHPLC
XI. PHENYLEPHRINE HCL, PARACETAMOL, CAFFEINE AND CETRIZINE
DI HCL
Table: 195 Linearity data by RP- UHPLC
Table: 196 Analytical performance parameters by RP- UHPLC
Table: 197 System Precision data by RP- UHPLC.
Table: 199 Analysis of tablet formulation by RP- UHPLC.
Table: 200 Accuracy data by RP- UHPLC.
Table: 201 System suitability data by RP- UHPLC.
Table: 202 Ruggedness data by RP- UHPLC.
Table: 203 Factorial Design data by RP- UHPLC.
Table: 204 Factorial Response data of Phenylephrine Hcl and Cetrizine Di Hcl by RP- UHPLC.
Table: 205 Factorial Response data of Caffeine and Paracetamol by RP- UHPLC.
Table: 206 Effect Summary data of Phenylephrine Hcl by RP- UHPLC
Table: 207 Effect Summary data of Paracetamol by RP- UHPLC
Table: 208 Effect Summary data of Caffeine by RP- UHPLC
Table: 209 Effect Summary data of Cetrizine Di Hcl by RP- UHPLC
XII. PHENYLEPHRINE HCL, PARACETAMOL, CAFFEINE AND
CHLORPHENIRAMINE MALEATE
Table: 210 Linearity data by RP- UHPLC.
Table: 211 Analytical performance parameters by RP- UHPLC.
Table: 212 System Precision data by RP- UHPLC.
Table: 213 Method Precision data by RP- UHPLC.
Table: 214 Analysis of tablet formulation by RP- UHPLC.
Table: 215 Accuracy data by RP- UHPLC.
Table: 216 System suitability data by RP- UHPLC.
Table: 218 Factorial Design data by RP- UHPLC.
Table: 219 Factorial Response data of Phenylephrine Hcl and Paracetamol by RP- UHPLC.
Table: 220 Factorial Response data of Caffeine and Chlorpheniramine Maleate by RP- UHPLC.
Table: 221 Effect Summary data of Phenylephrine Hcl by RP- UHPLC
Table: 222 Effect Summary data of Paracetamol by RP- UHPLC
Table: 223 Effect Summary data of Caffeine by RP- UHPLC
HPTLC TABLES
I. DROTAVERINE HCL AND MEFENAMIC ACID
Table: 225 Linearity data by HPTLC.
Table: 226 Analytical performance parameters by HPTLC.
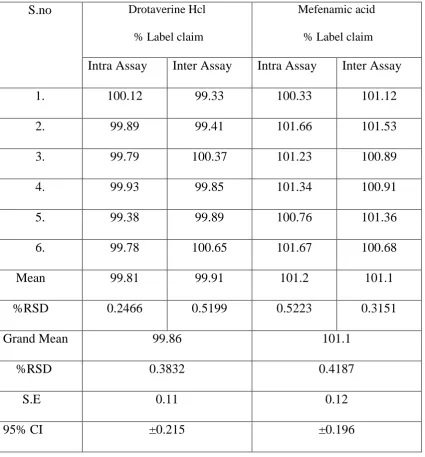
Table: 227 Precision data by HPTLC.
Table: 228 Analysis of tablet formulation by HPTLC.
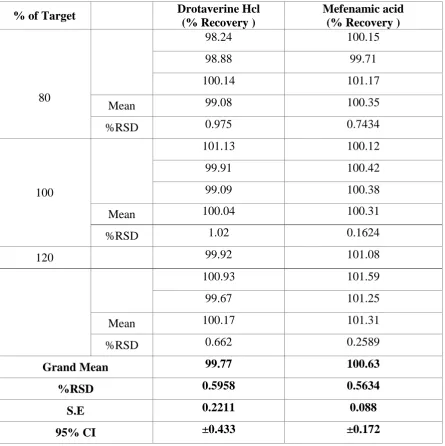
Table: 229 Accuracy data by HPTLC.
Table: 230 Ruggedness data by HPTLC.
Table: 231 Factorial Design data by HPTLC.
Table: 232 Factorial Response data by HPTLC.
Table: 233 Effect Summary data of Drotaverine Hcl by HPTLC.
Table: 234 Effect Summary data of Mefenamic acid by HPTLC.
II. DIACEREIN AND CELECOXIB
Table: 235 Linearity data by HPTLC
Table: 236 Analytical performance parameters by HPTLC
Table: 237 Precision data by HPTLC.
Table: 238 Analysis of tablet formulation by HPTLC.
Table: 239 Accuracy data by HPTLC.
Table: 240 Ruggedness data by HPTLC.
Table: 241 Factorial Design data by HPTLC.
Table: 242 Factorial Response data by HPTLC.
Table: 243 Effect Summary data of Diacerein by HPTLC.
III. TOLPERISONE HCL AND PARACETAMOL
Table: 245 Linearity data by HPTLC.
Table: 246 Analytical performance parameters by HPTLC.
Table: 247 Precision data by HPTLC.
Table: 248 Analysis of tablet formulation by HPTLC.
Table: 249 Accuracy data by HPTLC.
Table: 250 Ruggedness data by HPTLC.
Table: 251 Factorial Design data by HPTLC.
Table: 252 Factorial Response data by HPTLC.
Table: 253 Effect Summary data of Tolperisone Hcl by HPTLC.
Table: 254 Effect Summary data of Paracetamol by HPTLC.
IV. LAFUTIDINE AND DOMPERIDONE MALEATE
Table: 255 Linearity data by HPTLC.
Table: 256 Analytical performance parameters by HPTLC.
Table: 257 Precision data by HPTLC.
Table: 258 Analysis of tablet formulation by HPTLC.
Table: 259 Accuracy data by HPTLC.
Table: 260 Ruggedness data by HPTLC.
Table: 261 Factorial Design data by HPTLC.
Table: 262 Factorial Response data by HPTLC.
Table: 263 Effect Summary data of Lafutidine by HPTLC.
V. THICOLCHICOSIDE, ACECLOFENAC SODIUM AND PARACETAMOL
Table: 265 Linearity data by HPTLC.
Table: 266 Analytical performance parameters by HPTLC.
Table: 267 Precision data by HPTLC.
Table: 268 Analysis of tablet formulation by HPTLC.
Table: 269 Accuracy data by HPTLC.
Table: 270 Ruggedness data by HPTLC.
Table: 271 Factorial Design data by HPTLC.
Table: 272 Factorial Response data by HPTLC.
Table: 273 Effect Summary data of Thiocolchicoside by HPTLC.
Table: 274 Effect Summary data of Aceclofenac Sodium by HPTLC.
I.
INTRODUCTION
1.1 Analytical chemistry
Analytical chemistry is the science of obtaining, processing and communicating information about the composition. In other words, it is the art and science of determining what matter is and how much of it exists.
Analytical chemists perform qualitative and quantitative analysis; use the science of sampling, defining, isolating, concentrating, and preserving samples; set error limits; validate and verify results through calibration and standardization; perform separations based on different chemical properties; create new ways to make measurement; interpret data in proper context; and communicate results.
They use their knowledge of chemistry, instrumentation, computers and statistics to solve problems in almost all areas of chemistry. Traditional use of a computer in the analytical laboratory has been simply to collect samples faster. Thus emphasis is on laboratory automation or control of an auto sampler. But no more significant gains in simple automation issues. The individual scientist is again the limiting step in the processing of data. The problem that an analytical chemist faces now is not a function of their efficiency, nor is it a comment on their intelligence. Chemists are simply required to manage more information than is humanly possible. They are simply overwhelmed by the ability to generate data1
UNIVARIATE CALIBRATION
In order to built a calibration model through univariate linear regression, some basic assumptions must be fulfilled, two of the most important being is selectivity and linearity
Selectivity
A univariate calibration model can only provide accurate results, if the measured signal does not have contribution from other sources. Hence, only the analyte of interest must contribute to the measured signal. If other analytes contribute to the signal, the results will be biased. So there is no way to detect from the univariate signal that incorrect results are obtained. Therefore the adequateness of the result becomes a matter of belief.
1.2 CHEMOMETRIC APPROACH OF DATA ANALYSIS
component regression is suggested. If a simple yes or no answer is required, classification techniques are used.
The analysis procedure is composed of two steps, a) Modelling or calibration step (training set ) b) Classification or prediction step ( validation set) Mathematically the problem can be described by
Y= X B
Where Y = dependent variables (unknown components) X = independent variables (sample’s spectra)
B = coefficients of independent variables (model or training set)
And in general, X, Y and B are matrices. Given any two variables, the third variable can be mathematically estimated.
In the modelling step, we create a training set (B) using a set of samples with known constituents. In this step, component values (Y) are known a priori or measured using another method and the X values are the sample’s spectra. Hence modelling is a process of generating a correlation factor between sample spectra and their constituents.
The created model needs to be validated by comparing a set of predictions with known values.
In addition the data are examined for possible outliers, outliers are removed, and the optimal model can be created.
Creation of a good and robust model is the most critical step in chemometrics analysis.
The prediction step is simply an application of the generated optimal model. X and B are given and we solve for the Y in the above mentioned equation.1
Multivariate calibration
Instead of measuring the drug in single wavelength, measuring at all wavelengths (200-400nm). This can lead to a number of distinct advantages as follows
Noise reduction
Handling of interferents
The exploratory aspect.
Noise reduction is obtained by using more measurements of the same phenomenon. This can be illustrated using principal component analysis.
No of variables is there means principal component analysis will result in one significant principal component (latent variables) that describes the main variation in the data.
PCR- Principle component regression:
In the spectral work, the following steps can explain the fundamental concept of PCR. The original data obtained in absorbances (A) and concentrations (C) of analytes were reprocessed by mean-centring as A0 and C0, respectively.
Using the ordinary linear regression:
C = a + b x A (6)
The coefficient b is: b = P x q, where P is the matrix of eigenvectors and q is the C loadings given by q = D x TT x A0. Here, TT is the transpose of the score matrix T. D is a diagonal
matrix having on components the inverse of the selected eigenvalues. Knowing b one can easily find a by using the formula a = Cmean x ATmean x b, wnere ATmean represents the
transpose of the matrix having the entries of the mean absorbance values, and Cmean is the
mean concentration of the calibration set.
It is a two step process
a) The principal component model
b) The principal component regression model.
Principal component model is given by three different parts a) Loading vector – Qualitative infor