Model-based learning: productive failure and
associated process analysis techniques
Nick Kelly, Michael J Jacobson, Lina Markauskaite, Vilaythong Southavilay The University of Sydney, Australia
Email: [email protected], [email protected], [email protected], [email protected]
Abstract: This paper describes a design-based study that investigates the learning of scientific knowledge about climate change through computational models. It addresses three fundamental questions about model-based learning of scientific knowledge: (a) how sequencing of learning activities can alter learning outcomes; (b) how students’ develop a complex systems’ ontology for the world through the interaction with models exhibiting complex dynamics; and (c) how process discovery techniques may be used to investigate student learning processes from log data of model use. A study design is described and preliminary results are presented in this paper. The design experiment used two NetLogo models and problem-based learning materials developed in partnership with a high school science teacher. In the study, three classes of year nine science students were divided into two groups based upon different levels of structure that was provided during learning activities with the model. Student responses to a pre- and post-test (N=33) were coded and scored, and the results show that there was significant learning about the science of climate change through engagement with the model, but no significant group effects.
Computer modelling and scientific visualization tools are a key resource for scientists in the 21st century (Clement, 2000; Latour, 1987; Magnani, 1999). Greater availability and power of computers in schools has made it possible for students and teachers in science classes to use computer models and visualization techniques that are similar to or the same as those used by professional scientists (M. J. Jacobson & Wilensky, 2006). Early research into how students might use model-based learning (MBL) to construct understandings about scientific phenomena has been quite encouraging (Gordin & Pea, 1995; Penner, 2001; Zhang, Liu, & Krajcik, 2005). However, as Stratford (1997) observed, a number of important research issues exist related to the pedagogical uses of MBL, such as: What do students learn about scientific phenomena when running model-based simulations? How might modelling tools best be used in classroom settings?
This paper presents results from the first iteration of a design-based study that is part of a four year federally funded project in Australia. Following the proposed by the research team conceptual design, a high school science teacher collaborated with the researchers to develop models and experimental materials, grounding them in the learning context within which they are used (Cobb, Confrey, diSessa, Lehrer, & Schauble, 2003). The unit focussed on enhancing students’ scientific knowledge of climate change. The first iteration of this study addresses three research goals.
The first goal is to see whether we can replicate, in a different domain, existing research that suggests that sequencing and structure of learning activities can play a role when learning with models. Whereas the notion of strict discovery-learning has been largely discredited (Mayer, 2004) there is recent evidence that a sequence of low-structured activities followed by high structured activities can result in enhanced learning outcomes when compared to purely high-structured activities only (Kapur, 2006, 2008, 2010). This technique of productive failure (Kapur 2006) allows students to experience an initial period of less successful learning outcomes prior to consolidation of concepts through more highly structured activity and significant gains in understanding scientific knowledge and problem solving.
Second, the understanding of some scientific phenomena requires a complex systems view (Michael J. Jacobson, Kapur, So, & Lee, 2010). For example, notions such as non-linearity and feedback cycles are important for grasping a scientific notion of the greenhouse effect (Choi & Soyoung, 2010; Shepardson, Niyogi, Choi, & Charusombat, 2009). It has been suggested that MBL may be an effective way for students to engage with this counterintuitive ontology. Thus, the second goal is to explore whether, through the use of a multi-agent system and models that exhibit complex dynamics, students could learn the notions of complexity better.
possible. However, research is needed to investigate how these techniques might be used to assist teachers and students during MBL. Therefore, the third goal of the research is to provide a proof of concept for specific techniques that might be useful for analysis of MBL.
This study involved MBL of scientific knowledge about climate change to explore these three main questions. In particular, the research design involved different sequences of learning activities as students worked with agent-based computer models of the carbon cycle and the greenhouse effect. In addition to conventional pre-post test assessments of conceptual understanding of climate change and complexity knowledge, our analysis of students’ learning makes use of process discovery techniques involving data mining of log file data in conjunction with qualitative analysis of screen and web cam recordings of the interactions of student dyads using the computer models.
Method
A classroom experiment was devised, in which students from three year nine science classes were randomly assigned to two treatment groups: challenge and guided learning (CGL) (i.e., productive failure) and guided learning (GL) (i.e., non-productive failure). Both groups experienced two classroom periods of learning with two computational models relating to climate science (described below).
Learning materials
For each of the two models, three problem-based activities were prepared. The experimental design is summarised in Table 1. The two experimental groups (CGL and GL) differ only in the structure provided in the first of two activities with each model – the second activity and assessment are identical across both groups. For the CGL group this involved the posing of a challenging question with no instructional support, e.g., “What is the difference between the behaviour of visible light (yellow rays) and infrared light (red rays)?” The GL group had the same question but was provided additional instructional support in the form of small guiding tasks that structured their exploration of the models allowing to build up the ability to answer the question gradually. This experimental design replicates previous studies in which significant learning outcomes were found for a condition in which students are first exposed to “failure” before being given guidance (Kapur, 2006; S. Pathak, Kim, Jacobson, & Zhang, 2009).
All activities with the models were carried out in dyads. Students completed an individual pre- and post-test in which their knowledge about climate science and complexity was assessed using a survey, prior to their activities with the two models, Figure 1. The preparation of materials was supervised by the teacher, who ensured that the content was relevant to the curriculum unit on climate science and who was present in the classroom during the study.
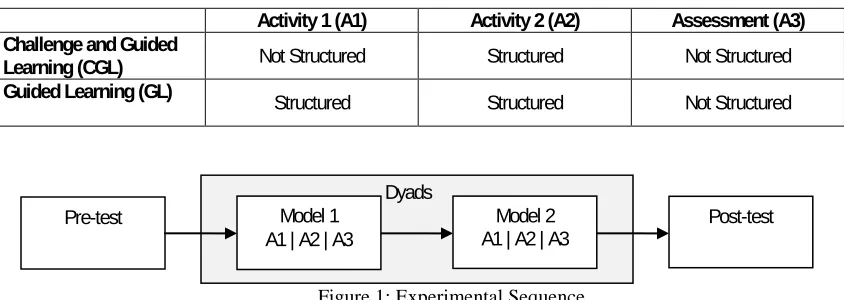
Table 1: Instructional sequence of classroom experiment
Activity 1 (A1) Activity 2 (A2) Assessment (A3) Challenge and Guided
Learning (CGL) Not Structured Structured Not Structured
[image:2.595.71.493.485.635.2]Guided Learning (GL) Structured Structured Not Structured
Figure 1: Experimental Sequence.
Models
The agent-based models of the carbon cycle and the greenhouse effect were developed within the NetLogo framework, a framework that has a history of successful use for learning about both earth sciences and complex dynamics (Levy & Wilensky, 2010b). The models were co-created by the first author and a collaborating school teacher with a PhD in physics, and were then verified by an earth sciences graduate.
The carbon cycle is represented by a fixed number of carbon molecules within a closed system. Carbon molecules exchange at the boundaries between atmosphere, land, and ocean. Students can alter the rates of transfer at these boundaries as well as control the rate of release of deeply stored carbon into the atmosphere. Carbon moves in different regions as well as in different life forms, represented as trees (plants) and sheep (animals).
Pre-test Model 2
A1 | A2 | A3 Post-test Dyads
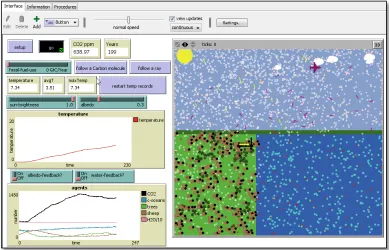
The greenhouse effect model allows students to explore the interaction between the sun’s energy and the carbon cycle. This model builds on the carbon cycle model by introducing the sun’s rays. Students can release carbon dioxide into the atmosphere and observe the effects over time. The output shows atmospheric gases and surface temperatures. The model includes parameters for the quantity of the greenhouse gasses of CO2 and H2O and includes a parameter the Earth’s albedo or reflectiveness. Rules are specified for the interaction between light rays and the Earth’s surface (reflection, absorption) as well as for heat released from the Earth’s surface (infrared radiation) and greenhouse gases (the CO2 and H2O). The resulting complex system has the emergent property of “global heat” that changes based upon the proportions of solar radiation/greenhouse-gas/reflection in the system. The simulation generates output that was calibrated to be an approximation of Intergovernmental Panel for Climate Change data for carbon and temperature (IPCC, 2007).
[image:3.595.102.491.268.518.2]Students interact with the models by changing the parameters and observing the effects. For example, in the model of the greenhouse effect shown in Figure 2, releasing CO2 into the atmosphere (by changing a slider, left side) leads to real-time visual feedback (in the visualisation window, right side) as well as more CO2 molecules being present and increased incidence of re-radiation of IR light leaving Earth’s surface. This is displayed in the graphs of temperature and carbon (lower left) that show an increase in the former and a shift in the equilibrium in the latter in “real-time”.
Figure 2: A NetLogo model of the greenhouse effect
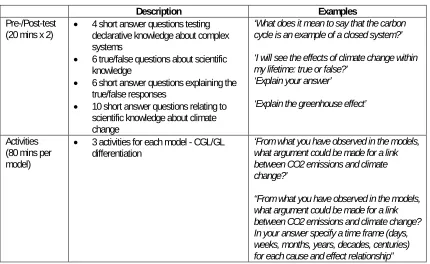
Instruments and Data
The study was conducted in 2011 at an all girls high school in Australia, with three year nine (third year) classes and a total of 90 students (30 students each). Students completed individual pre-tests and post-tests of their knowledge of climate science and complexity. The pre- and post-tests consisted of 20 questions—six multiple choice and 14 open-ended short answer questions—that were intended to assess both declarative and conceptual knowledge of climate science. Students were allocated 20 minutes to complete each test.
Table 2: Overview of Research Instruments.
Description Examples
Pre-/Post-test
(20 mins x 2) • 4 short answer questions testing declarative knowledge about complex systems
• 6 true/false questions about scientific knowledge
• 6 short answer questions explaining the true/false responses
• 10 short answer questions relating to scientific knowledge about climate change
‘What does it mean to say that the carbon cycle is an example of a closed system?’
‘I will see the effects of climate change within my lifetime: true or false?’
‘Explain your answer’
‘Explain the greenhouse effect’
Activities (80 mins per model)
• 3 activities for each model - CGL/GL
differentiation ‘From what you have observed in the models, what argument could be made for a link between CO2 emissions and climate change?’
“From what you have observed in the models, what argument could be made for a link between CO2 emissions and climate change? In your answer specify a time frame (days, weeks, months, years, decades, centuries) for each cause and effect relationship”
Results
This section presents some main results related to the three goals described before from the first year of the project. First we present results from the pre- and post-test as well as the activity and assessment questions that relate to the first two goals. Then we will illustrate and discuss our initial trial of an analytical approach for investigating students’ interaction with the models using hidden Markov models, that relates to the third goal.
Students’ achievements
Of the initial 90 students, one of the classes was used as a pilot to tune data collection technologies and procedure. Of the remaining 60 students only 33 completed all tasks, due to absences and technical difficulties due to some of the school computers unable to deal with the volume of data for logging NetLogo and screen captures.
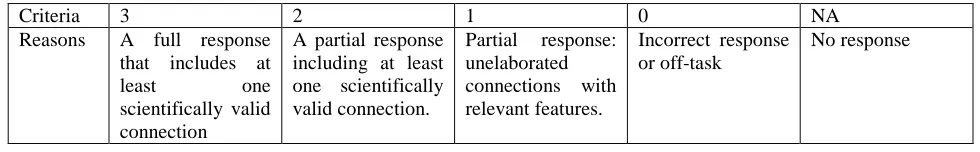
Ten short answer questions relating to scientific knowledge of climate change phenomena were coded using an adapted five-point knowledge integration rubric (Gerard, Spitulnik, & Linn, 2010). This coding scheme elucidates students’ capabilities to make connections between different elements of the phenomenon, thus was appropriate for investigating the depth of students understanding. One question was discounted as students were not able to comprehend the language used, leaving nine questions. Initially, two coders each coded 60% of the results with a 20% overlap for reliability. Cohen’s Kappa on this initial 20% was 0.64. Coders met to discuss discrepancies and coded the remaining results so that each coder had rated all of the results. Following discussion of discrepancies 100% agreement was reached.
These scores were scaled to a mark out of one hundred. Table 4 summarises these results. For overall study design, without taking into account differences between experimental conditions, there was a significant increase in students’ test scores. Accounting for the covariate of the instructional method, the difference between the pre- and post- test scores was significant, F(1,31)=9.367, p=.005, η2 =.232.
Repeated measures ANOVA on the summed short answer responses with a between-subjects factor of the CGL/GL grouping shown that this grouping did not have significant effect, F(1,31) = 1.532, p = .225, η2 =.047. Whilst this effect is not large enough to be significant, it is in keeping with the hypothesis based upon previous studies that the CGL group should outperform the GL group.
Table 3: Knowledge integration coding scheme
Criteria 3 2 1 0 NA
Reasons A full response that includes at
least one
scientifically valid connection
A partial response including at least one scientifically valid connection.
Partial response: unelaborated connections with relevant features.
Incorrect response or off-task
[image:5.595.60.537.93.386.2]No response
Table 4: Pre- and post- test results
N Pre-Test Post-Test
Mean (SD) Mean (SD)
Challenge & guided learning 15 31.73 (15.81) 41.07 (14.38)
Guided learning 18 34.67 (12.27) 38.89 (13.22)
All students 33 33.33 (13.84) 39.88 (13.58)
Table 5: Student scores for activity and assessment questions
N (dyads) Model 1 (Carbon Cycle) Model 2 (Greenhouse Effect)
Mean (SD) Mean (SD)
Challenge & guided learning 6 61.11 (16.39) 38.89 (18.26)
Guided learning 8 55.21 (9.90) 37.50 (18.72)
All dyads 14 57.74 (12.85) 38.10 (17.82)
Process Analysis
In this section we outline an approach that we are testing for analysing the stream of data that is available from students engaged in MBL. In this initial test of our techniques with the aim to demonstrate possible ways to explore the processes of students’ interaction with NetLogo models.
There is evidence indicating that students’ outcomes in MBL are influenced by the different exploration strategies that students adopt and resulting patterns of their behavior (Levy & Wilensky, 2010b). Educational data mining employs various algorithmic techniques on large amounts of institutional data records or student learning log files that are associated with online learning activities in order to discover various student learning patterns (A. C. Romero & Ventura, 2006; C. Romero, et al., 2010). This information then could be used to improve the design of software and learning materials or provide individualised feedback and support learners MBL activity. As a part of our initial analysis we are exploring several possible techniques to analyse students’ interaction patterns. The main among them are Hidden Markov Model (HMM), process mining, and various statistical visualisation techniques. To illustrate the potential of these techniques to detect student behaviour patterns, for our initial analysis we have analysed comprehensively data of one high achieving and one low achieving dyad from CGL group. We used the carbon cycle model. Details of this analysis has been presented elsewhere (Markauskaite, Jacobson, Kelly, & Southavilay, 2011). Here we will use some results to illustrate one of the potentially most powerful techniques – HMM (H. Jeong, G. Biswas, J. Johnson, & L Howard, 2010a; Southavilay, Yacef, & Callvo., 2010) - then we will illustrate the potential limitations of the HMM technique and will discuss future research directions.
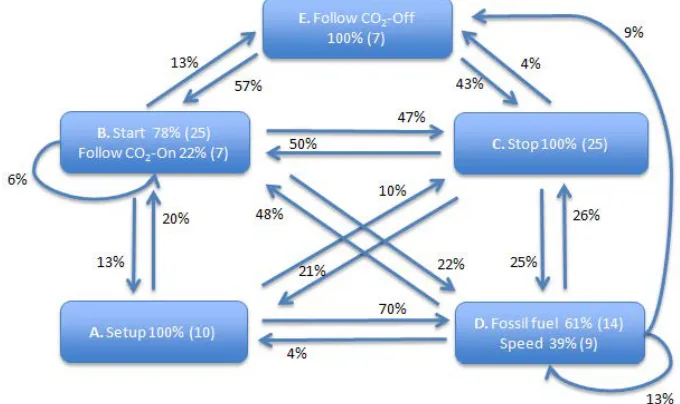
In our initial analysis we used the HMM constructing algorithm adapted from Jeong et al. (2010b). On the basis of sequences of student interactions with Netlogo models recorded in log files, the algorithm extracted HMMs consisting of hidden states that depict how students interact with the models. Student activities or actions are equivalent to the use of controls on the model interface: Setup button, Go button (that initiates Start and Stop of the simulation), Speed control, Fossil Fuel Use control; and Tracking CO2 Molecule control. The
HMM shows the composition and the percentage of activities in each state as well as transitioning probabilities among these states. Students’ activities within individual states and likelihoods with which they move from one state to another together depict students’ overall behaviour pattern.
[image:5.595.63.553.94.170.2]students transitioned to State B and started the exploration by pressing Start or Switch on CO2 tracking buttons
with a likelihood of 20%; moved on to State D and further explored the model by changing fossil fuel use and modeling speed with a likelihood of 70%; or moved to State C and stopped the model with a likelihood 10%.
Overall, the HMM model for the high achieving dyad was composed from five states (Figure 3). Three simple states were associated with model control: Setup (State A); Stop (State C) and Stop Tracing of a CO2
[image:6.595.128.468.173.375.2]molecule action (State E). Two composite states were associated with the model exploration: one combined start simulation and initiate tracing of a CO2 molecule actions (State B); another was composed from the control of the fossil-fuel use and speed control (State D).
Figure 3: Hidden Markov Model of the high achieving dyad
The model depicted that the high achieving pair very often moved from the initial model setup (State A) to the control of the main model parameters and speed (State D), with the transition probability as high as 70%. The transition probability between the model manipulation (State D) and Start (State B) was also relatively high (48%). In contrast, the likelihoods of transition between Setup (State A) and Start (State B) and Setup (State A) and Stop (State C) were as low as 20% and 10% respectively. This suggested that the dyad after resetting the model (State A) often initially configured the main model parameters and only then started exploration of the model by switching on CO2 tracking or pressing Start (State B). The HMM also indicated that these students relatively often explored the model by running and pausing it, with the transition probabilities between Start (State B) and Stop (State C), and vice versa, ranging between 47% and 50%.
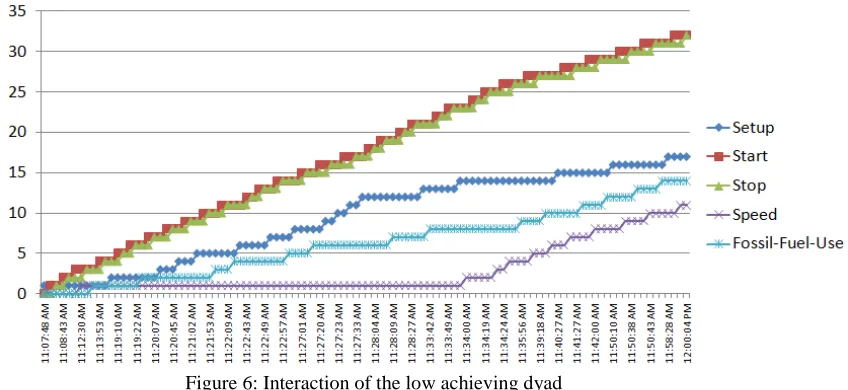
The HMM for the low achieving pair depicted that these students interacted with the model differently. The model was composed from 4 states only (Figure 4). Two simple states and one composite state were similar to the states in the HMM for high achieving students: Setup (Sate A); Stop (State C) and model manipulation (State D). One further simple state was formed from Start action (State B) only. The transitions indicated that the dyad’s behavior pattern can be characterized by two dominant moves between the three basic control buttons: Setup, Start and Stop. The transition probabilities between Setup (State A) and Start (State B); and between Start (State B) and Stop (State C) were as high as 65% and 70%, respectively. All other students’ transitions among a range of states had medium or low probabilities, suggesting that the exploration was less systematic. In contrast to the high achievers’ HMM, the transition probability from the initial Setup (State A) to the model manipulation (State D) was only 10%. This result suggested that these students rarely setup the main parameters after resetting the model, but rushed to start the simulation (State B). Nevertheless, this dyad sometimes also manipulated some model parameters (State D). The students relatively often stopped the simulation (State C), changed the parameters (State D) and resumed (State B). What was distinctive to this dyad is that it never attempted to track an individual CO2 molecule. This was indicative that these students unlikely engaged in a qualitative exploration of the agents depicted in the carbon cycle model.
followed by the manipulation of model parameters as they go, which was not very indicative to a strategic behavior.
Figure 4: Hidden Markov Model of the low achieving dyad
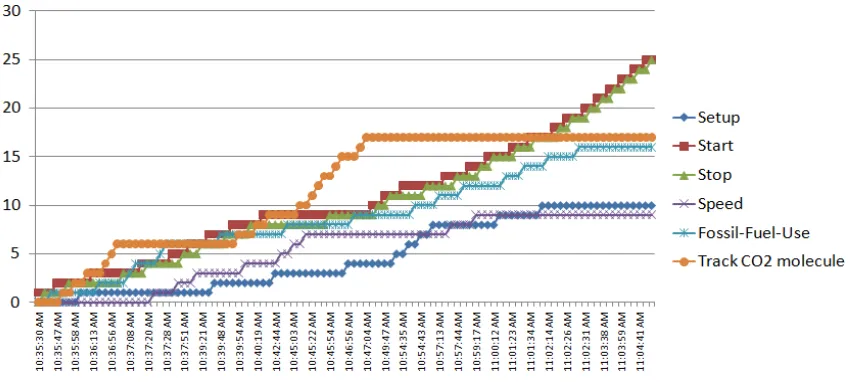
In order to triangulate the HMM results we used other core process visualization and statistical techniques to explore student interactions and constructed interaction graphs (Figure 5 and Figure 6). The graphs depict dyads’ interactions with the carbon cycle models during the experimental period. The vertical axis represents the time line; the horizontal axis shows the total number of various model control actions taken from the beginning of the session.
Figure 5: Interaction graph of the high achieving dyad.
The interaction graph for the high achieving dyad confirms that the students actively explored model during the entire experimental sequence by often using here main simulation controls and parameters: fossil fuel use, speed and tracking CO2 molecule. It also depicts that during the first half of the session students changed the fossil fuel rates and speed that are indicative to the quantitative exploration and tracked the CO2 molecule, which is indicative to the qualitative exploration, simultaneously. This reaffirms that the students’ combined qualitative and qualitative exploration. However it also reveals that there were some noticeable changes in the student behaviour over time. For example, the students changed CO2 tracking setting during the first half of the session only. This was followed by a shorter, but a noticeable period when students actively controlled the fossil fuel use. At the end of the session they interacted with the model simply pausing and resuming the simulation without changing its settings.
[image:7.595.89.517.357.548.2]information provides useful insights into the potential and limitations of HMM which are elaborated in the next section.
Figure 6: Interaction of the low achieving dyad
Discussion and concluding insights
The results indicate that students achieved significant learning gains and during the experiment they learnt about climate change. The difference between treatment groups was present, with the expected result that the CGL group outperformed the GL group, but statistically not significant. This does not replicate the significant learning gains associated with students learning about the physics of electricity using NetLogo agent-based models that had a similar experimental design (S. A. Pathak, Kim, Jacobson, & Zhang, 2011).
Even though there was significant overall learning by the end of the study, the overall post-test scores were only 40 out of a possible 100 points. This suggests the students still seemed to have a relatively weak overall understanding about the climate change and complexity content that was the focus of the study. A possible reason for the lack of group differences is that simply varying the degree of structure provided during the initial learning activities for each of the two models followed by similar structured worksheets was not sufficient for learning conceptually very challenging knowledge about climate systems. More recent research by Kapur (2010) suggests that successful productive failure learning approaches require an elicitation phase in the initial low structure activity to activate resources of the learner’s prior knowledge related to the domain, followed by a consolidation phase in which the teacher helps the learners see links between their generated knowledge resources and the canonical ways of solving the problem using expert formalisms. Our ongoing research will adopt this strategy of elicitation and consolidation in using similar agent-based climate change models.
The process analysis is an ongoing research theme in this research. We aim to find key patterns of students’ interaction with the models, and find ways to predict ‘on-the-fly’ inefficient strategies and scaffold learners. A current limitation is that the algorithm that we used to construct the HMMs has a local maxima problem and the log data files are relatively small. In our study, we followed the work developed by (Jeong, et al., 2010a; Southavilay, et al., 2010) and executed the algorithm one hundred times with random initializations (by sampling the initial parameter values from uniform distributions). HMMs were constructed when these executions converged to the same configuration. A better solution is needed to execute this algorithm if we are to use the HMM for providing feedback to students and teachers in real time. Further, the HMM algorithm applied to the student learning logs identifies patterns that are directly rooted in students’ technical fine-grained actions and constructs only one model for the entire interaction sequence. Two key challenges need further exploration and solution.
Second, when modeling is based on the raw log data, it directly links students’ activities to the students’ technical fine-grained interactions with the model via the interface (i.e., roughly speaking “button click” is equal to student activity). These “technical actions” are likely not identical to the “meaning actions” that are associated with the students’ intentions and conscious behavior. Drawing on the evidence from cognitive research, we can expect that “meaning actions” are likely to be more abstract “chunks” of common sequences of student behavior (i.e., clusters of common strings of “technical actions”). Mining techniques are needed for identifying “meaning actions” in student logs initially. Then these “meaning actions” could be used for constructing further student interaction models.
To addresses the first challenge we are currently working on two goals. First, we aim to have the logs that resulted from the students’ interaction with the activity worksheets integrated with the NetLogo log files. This integration will allow us to track at least those changes in students’ strategies that may happen due to the shifts between activities and take into account these changes in identifying students’ exploration patterns. Second, in order to gain deeper insight into how students performed their activities, we are also exploring possibilities to incorporate process mining techniques, particularly in the initial exploratory stage of the analysis (Trčka, et al., 2011; van der Aalst, 2011). To address the second challenge, we plan to utilize a hidden Markov model clustering algorithm (Shih, Koedinger, & Scheines, 2010) and explore other similar techniques. By clustering and learning HMMs rather than just one for each student group, we can discover different strategies that students employed and to use those strategies to predict learning outcomes. This combination of techniques could allow a good fit between automatically identified behavior patterns to students’ conscious behavior.
In terms of the theoretical issues highlighted at the start of this paper, these results are encouraging for the continuation of this design-based research. They indicate that significant learning of scientific knowledge about climate change is occurring from interaction with the models and suggest that whilst not significantly, the CGL group is outperforming the GL group. Future research will explore whether more significant results and enhanced learning gains are possible through productive failure approaches that involve teacher led elicitation and consolidation phases of learning that involve the use of the agent-based models of climate change systems.
References
Choi, & Soyoung. (2010). Do Earth and Environmental Science Textbooks Promote Middle and High School Students' Conceptual Development about Climate Change? Textbooks' consideration of students' misconceptions. Bulletin of the American Meteorological Society, 91(7), 889-898.
Clement, J. (2000). Model based learning as a key research area for science education. International Journal of Science Education, 22(9), 1041-1053.
Cobb, P., Confrey, J., diSessa, A., Lehrer, R., & Schauble, L. (2003). Design Experiments in Educational Research. Educational Researcher, 32(1), 9-13.
Gerard, L. F., Spitulnik, M., & Linn, M. C. (2010). Teacher use of evidence to customize inquiry science instruction. Journal of Research in Science Teaching, 47(9), 1037-1063.
Gordin, D. N., & Pea, R. D. (1995). Prospects for scientific visualization as an educational technology. The Journal of the Learning Sciences, 4(3), 249-279.
IPCC. (2007). Climate Change 2007 - The Physical Science Basis: Working Group I Contribution to the Fourth Assessment Report of the IPCC: Cambridge University Press.
Jacobson, M. J., Kapur, M., So, H.-J., & Lee, J. (2010). The ontologies of complexity and learning about complex systems. Instructional Science, DOI 10.1007/s11251-11010-19147-11250.
Jacobson, M. J., & Wilensky, U. (2006). Complex systems in education: Scientific and educational importance and implications for the learning sciences. The Journal of the Learning Sciences, 15(1), 11-34.
Jeong, H., Biswas, G., Johnson, J., & Howard, L. (2010a). Analysis of productive learning behaviors in a structured inquiry cycle using hidden markov models. Paper presented at the Proceedings of the 3rd International Conference on Educational Data Mining.
Jeong, H., Biswas, G., Johnson, J., & Howard, L. (2010b, June 11-13). Analysis of productive learning behaviors in a structured inquiry cycle using hidden markov models. Paper presented at the International Conference on Educational Data Mining, Pittsburgh, PA, USA.
Kapur, M. (2006). Productive failure. In S. Barab, K. Hay & D. Hickey (Eds.), Proceedings of the International Conference of the Learning Sciences (pp. 307-313). Mahwah, NJ: Erlbaum.
Kapur, M. (2008). Productive failure. Cognition and Instruction, 26(3), 379 - 424.
Kapur, M. (2010). A further study of productive failure in mathematical problem solving: Unpacking the design components. Instructional Science, DOI: 10.1007/s11251-11010-19144-11253.
Latour, B. (1987). Science in action: How to follow scientists and engineers through society. Cambridge, MA: Harvard University Press.
Levy, S. T., & Wilensky, U. (2010b). Mining students’ inquiry actions for understanding of complex systems. Computers and Education, 56(3), 556-573.
Magnani, L., Nersessian, N. J., & Thagard, P. (Ed.). (1999). Model-based reasoning in scientific discovery. New York, NY: Kluwer Academic/Plenum Publishers.
Markauskaite, L., Jacobson, M. J., Kelly, N., & Southavilay, V. (2011). Using Process Analysis Techniques to Understand Students’ Learning Strategies with Computer Models. Paper presented at the AERA2012. Mayer, R. (2004). Should there be a three-strikes rule against pure discovery learning? The case for guided
methods of instruction. American Psychologist, 59(1), 14-19.
McElhaney, K. W., & Linn, M. C. (2011). Investigations of a complex, realistic task: Intentional, unsystematic, and exhaustive experimenters. Journal of Research in Science Teaching, 48(7), 745-770.
Pathak, S., Kim, B., Jacobson, M. J., & Zhang, B. (2009). Failures and successes in collaborative inquiry: Learning the physics of electricity with agent-based models. In C. O’Malley, D. Suthers, P. Reimann & A. Dimitracopoulou (Eds.), Computer-supported collaborative learning practices: CSCL2009 conference proceedings (pp. 199-203). Rhodes, Greece: International Society of the Learning Sciences. Pathak, S. A., Kim, B., Jacobson, M. J., & Zhang, B. (2011). Learning the physics of electricity: A qualitative analysis of collaborative processes involved in productive failureL. International Journal of Computer-Supported Collaborative Learning, 6, 57-73.
Penner, D. E. (2001). Complexity, emergence, and synthetic models in science education. In K. Crowley, C. D. Schunn & T. Okada (Eds.), Designing for science (pp. 177-208). Mahwah, NJ: Lawrence Erlbaum Associates.
Reimann, P. (2009). Time is precious: Variable- and event-centred approaches to process analysis in CSCL research. International Journal of Computer-Supported Collaborative Learning, 4(3), 239-257.
Romero, A. C., & Ventura, S. (Eds.). (2006). Data mining in e-learning. Southampton: WITpress.
Romero, C., Ventura, S., Pechenizkiy, M., & Baker, R. S. J. d. (Eds.). (2010). Handbook of Educational Data Mining. Boca Raton: CRC Press.
Schulte-Mecklenbeck, M., Kuehberger, A., & Ranyard, R. (Eds.). (2011). A Handbook of Process Tracing Methods for Decision Research: A Critical Review and Users Guide
New York: Psychology Press.
Shepardson, D. P., Niyogi, D., Choi, S., & Charusombat, U. (2009). Seventh grade students' conceptions of global warming and climate change. Environmental Education Research, 15(5), 549-570.
Shih, B., Koedinger, K. R., & Scheines, R. (2010). Discovery of Learning Tactics using Hidden Markov Model Clustering. Paper presented at the Proceedings of the 3rd International Conference on Educational Data Mining, 2010.
Southavilay, V., Yacef, K., & Callvo., R. A. (2010, June 11-13). Process Mining to Support Students' Collaborative Writing. Paper presented at the International Conference on Educational Data Mining, Pittsburgh, PA, USA.
Stratford, S. J. (1997). A review of computer-based model research in precollege science classrooms. Journal of Computers in Mathematics and Science Teaching 16(1), 3-23.
Trčka, N., Pechenizkiy, M., & van der Aalst, W. (2011). Process Mining from Educational Data. In C. Romero, S. Ventura, M. Pechenizkiy & R. S. J. d. Baker (Eds.), Handbook of Educational Data Mining (pp. 123-142). Boca Raton: CRC Press.
van der Aalst, W. M. P. (2011). Process Mining: Discovery, Conformance and Enhancement of Business Processes: Springer.
Zhang, B., Liu, X., & Krajcik, J. S. (2005). Expert models and modeling processes associated with a computer-modeling tool. Science Education, 90, 579-604.