Agent-based computer models for learning about climate change
and process analysis techniques
Nick Kelly, Michael J Jacobson, Lina Markauskaite, Vilaythong Southavilay The University of Sydney, Australia
Email: [email protected], [email protected], [email protected], [email protected]
Abstract: This paper describes a design-based research project that investigates the learning of scientific knowledge about climate change through computational models. The design experiment used two NetLogo models and problem-based learning materials developed in partnership with a high school science teacher. In the study, three classes of year nine science students were divided into two groups based upon different levels of structure that was provided during learning activities with the models. The results indicate that there was significant learning of concepts about greenhouse gases and the carbon cycle through engagement with the models. We also describe the process analysis techniques being developed to analyze the log files of the interactions the students had with the computer models.
This paper presents results from the first iteration of a design-based research project that is exploring how students may learn scientific knowledge about climate systems using computer models as part of a four year federally funded project in Australia. There are three main research areas of this project. The first area is investigating if different patterns for the sequencing and structure of pedagogical guidance during learning activities can enhance learning with computer models. Whereas the notion of strict discovery-learning has been largely discredited (Mayer, 2004) there is recent evidence that a sequence of low-structured activities followed by high structured activities can result in enhanced learning outcomes when compared to purely high-structured activities only (Kapur, 2008, 2010; Schwartz & Bransford, 1998; VanLehn, Siler, & Murray, 2003).
Second, there are increasing calls for students to learn important scientific knowledge about systems, including topics related to complex climate systems and global warming (ACARA, 2011; National Research Council, 2012). An important recent approach for helping students to successfully learn more standard science education topics involves model-based learning (MBL) (Clement, 2000; Zhang, Liu, & Krajcik, 2005). In general, MBL approaches engage the learners with computer simulation and visualization systems and learning the targeted science concepts interactively via problem solving. There has also been research involving the use of agent-based models (ABM), which computationally represent phenomena as a number of agents or elements that each has particular rules they follow, and for which the apparent complexity of the system being modeled emerges from the interactions of the agents in the systems (Railsback & Grimm, 2011). A number of recent studies have documented significant learning with ABMs, especially for learning about various types of complex physical and biological systems (Goldstone & Wilensky, 2008; Jacobson, Kapur, So, & Lee, 2011; Wilensky & Reisman, 2006). In this study, we investigate how ABMs can help students learn important concepts about climate systems.
Finally, when students work with computer models, a large stream of fine-grained process data can be collected. Recently, researchers have begun to explore various process analysis techniques for analyzing data of human-computer interactions, such as data mining, process mining, and learning analytics (Reimann, 2009; Romero, Ventura, Pechenizkiy, Ryan, & Baker, 2010; Trčka, Pechenizkiy, & van der Aalst, 2011; van der Aalst, 2011). These techniques have demonstrated potential for discovering student learning patterns and predicting unproductive behaviors where early intervention may be possible. However, research is needed to investigate how these techniques might be used to assist teachers and students during MBL. Therefore, the third area of our research is to provide a proof of concept for specific data mining techniques that might be useful for analysis of MBL. This study involved MBL of scientific knowledge about climate change to explore these three areas. In particular, the research design involved different sequences of learning activities as students worked with agent-based computer models of the carbon cycle and the greenhouse effect. In addition to the pre-post test assessments of conceptual understanding of climate change knowledge, our analysis of students’ learning makes use of process discovery techniques involving log file data of student dyads using the computer models.
Method
groups experienced two classroom periods of learning with two computational models relating to climate science (described below). For each of the two models, three problem-based activities were prepared. The two experimental groups (CGL and GL) differed only in the structure provided in the first of two activities with each model, so that the second activity and assessment were identical across both groups. For the CGL group, this involved the posing of an initial challenging question with no instructional support, e.g., “What is the difference between the behavior of visible light (yellow rays) and infrared light (red rays)?” The GL group had the same question but was provided additional instructional support in the form of small guiding tasks that structured their exploration of the models in a way intended to help them answer the question successfully. This experimental design was used in previous studies in which significant learning outcomes were found (Kapur, 2006; Pathak, Kim, Jacobson, & Zhang, 2009). Students individually completed a pre-test and a post-test in which their knowledge about climate science was assessed, and then all learning activities with the computer models were carried out in dyads.
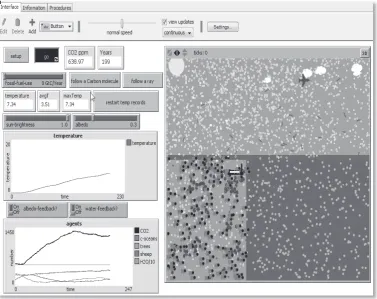
Figure 1: A NetLogo model of the greenhouse effect
model of the greenhouse effect shown in Figure 1, releasing CO2 into the atmosphere (by changing a slider, left side) leads to real-time visual feedback (in the visualization window, right side) as well as more CO2 molecules being present and an increased incidence of re-radiation of IR light leaving Earth’s surface. This is displayed in the graphs of temperature and carbon (lower left) that show an increase in the former and a shift in the equilibrium in the latter over time.
The study was conducted in 2011 at an all girl’s high school in Australia, with three year nine classes (third year of secondary school) and a total of 90 students (30 students each). Students completed individual pre-tests and post-tests of their knowledge of climate science and complex systems. The pre- and post-tests consisted of 20 questions—six multiple choice and 14 open-ended short answer questions—that were intended to assess both declarative and conceptual knowledge of climate science. Students were given 20 minutes to complete each test. During the experiment, students carried out three activities with each of the two models in pairs (45 dyads in total). Each pair was randomly assigned to one of two conditions: (a) CGL where dyads had no structure for the first activity of each model, and (b) GL where dyads had a structured task for the first activity with each model. Students were allocated 80 minutes for working with each of the two models and completing the given activities. Computer screen recordings were made and log files of NetLogo interactions were maintained for all dyads. Additional webcam audio and video recordings were made for six dyad groups (three in each of the treatment groups).
Results
This section presents the main results related to our three research areas from the first year of the project. First we discuss the pre- and post-test assessment results. Second, we illustrate the potential of process analysis techniques to detect student behavior patterns from the NetLogo log files in our analysis of one high achieving and one low achieving dyad from CGL group.
Of the initial 90 students, one of the classes was used as a pilot to tune data collection processes, and therefore was not included in the final analysis. Of the remaining 60 students, only 33 completed all tasks due to absences and technical difficulties (e.g., computer failures resulting in missing data).
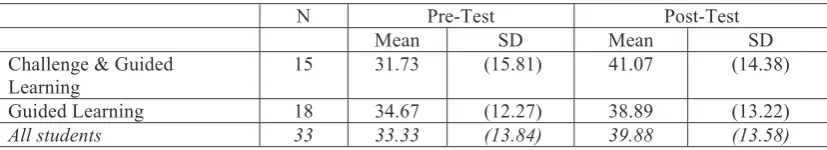
[image:3.595.68.482.510.585.2]Ten short answer questions related to scientific knowledge of climate change phenomena were coded using an adapted five-point knowledge integration rubric (Gerard, Spitulnik, & Linn, 2010). This coding scheme elucidates students’ capabilities to make connections between different elements of the phenomenon, thus was appropriate for investigating the depth of students understanding. One question was removed as we determined it had unclear language, leaving nine questions. Initially, two individuals each coded 60% of the results with a 20% overlap for reliability. Cohen’s Kappa on this initial 20% was 0.64. The coders then met to discuss discrepancies and coded the remaining results so that each had rated all of the responses. Following discussion of discrepancies, 100% agreement was reached. These scores were scaled to a maximum of 100 and Table 1 summarizes these results.
Table 1: Pre- and post- test results
N Pre-Test Post-Test
Mean SD Mean SD
Challenge & Guided Learning
15 31.73 (15.81) 41.07 (14.38)
Guided Learning 18 34.67 (12.27) 38.89 (13.22)
All students 33 33.33 (13.84) 39.88 (13.58)
Overall, there was a significant increase in the mean post-test scores of all the students, F(1,31)=9.367, p=.005,
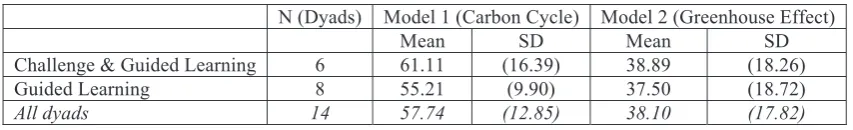
Table 2: Student scores for activity and assessment questions
N (Dyads) Model 1 (Carbon Cycle) Model 2 (Greenhouse Effect) Mean SD Mean SD Challenge & Guided Learning 6 61.11 (16.39) 38.89 (18.26)
Guided Learning 8 55.21 (9.90) 37.50 (18.72)
All dyads 14 57.74 (12.85) 38.10 (17.82)
Process Analysis
In this section we outline an approach that we are developing for analyzing the stream of data that is available from students engaged in learning activities with NetLogo agent-based models. The main goal of this early phase of our work is to explore possible ways that data mining techniques may provide insights into the students’ interactions with the NetLogo models. Educational data mining employs various algorithmic techniques on large amounts of institutional data records or student learning log files that are associated with online learning activities in order to discover student learning patterns (Romero & Ventura, 2006; Romero et al., 2010). This information then could be used to improve the design of software and learning materials or provide individualized feedback and support for learners during MBL activities. As a part of our initial analysis we are exploring several possible techniques to analyze students’ interaction patterns: Hidden Markov Model (HMM), process mining, and various statistical visualization techniques.
In our initial analysis, we used the HMM constructing algorithm adapted from Jeong, Biswas, Johnson, & Howard, (2010). On the basis of sequences of student interactions with NetLogo models recorded in log files, the algorithm extracted HMMs consisting of hidden states that depict how students interact with the models. Student activities or actions are equivalent to the use of controls on the model interface: Setup button, Go button (that initiates Start and Stop of the simulation), Speed control, Fossil Fuel Use control, and Tracking CO2 Molecule control. The HMM shows the composition and the percentage of activities in each state as well as transitioning probabilities between these states. Students’ activities within individual states and likelihoods with which they move from one state to another together depict students’ overall behavior patterns.
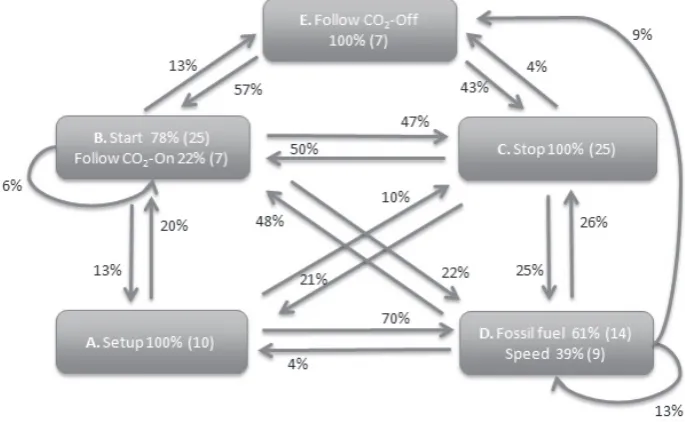
Each HMM is made up of a set of states and transitions: the behavior probabilities associated with each state and the transition probabilities between the states. For example, the HMM in Figure 2 shows that a high achieving dyad in State D (Fossil Fuel and Speed) explored the model by controlling the simulation in two distinct ways: by changing the amount of fossil fuel use 61% of the times (14 actions in total) and by changing modeling speed 39% of the time (9 actions in total). The link from one state to another and the percentage associated with the link indicate how likely it is that a certain state will be followed by another. For example, the HMM in Figure 2 shows the probabilities that the dyad would transition from State A (in which the they set up the simulation) to states B, C, and D. Specifically, the HMM for the high achieving dyad was composed from five states (Figure 2). Three simple states were associated with model control: Setup (State A), Stop (State C), and Stop Tracing of a CO2 molecule action (State E). Two composite states were associated with the model exploration: (a) start simulation and initiate tracing of a CO2 molecule actions (State B), and (b) control the fossil-fuel use and speed control (State D). The HMM shows that the high achieving pair often moved from the initial model setup (State A) to the control of the main model parameters and speed (State D), with the transition probability as high as 70%. The transition probability between the model manipulation (State D) and Start (State B) was also relatively high (48%). In contrast, the likelihoods of transition between Setup (State A) and Start (State B) and Setup (State A) and Stop (State C) were as low as 20% and 10% respectively. This suggests that after resetting the model (State A), the dyad often initially configured the main model parameters and only then started exploration of the model by switching on CO2 tracking or pressing Start (State B). The HMM also indicated that these students often explored the model by running and pausing it, with the transition probabilities between Start (State B) and Stop (State C), and vice versa, ranging between 47% and 50%.
B). It is also interesting to note that log file analysis revealed this dyad never attempted to track an individual CO2 molecule, unlike the high achieving dyad.
Figure 2: Hidden Markov Model of the high achieving dyad
These results indicated that the model exploration strategies adopted by two dyads were different. The HMM for the high achieving dyad indicates that their explorations can be characterized by the interaction with the model, systematic control of the parameters, and model tracking behaviors. It also suggests that these students combined qualitative and quantitative explorations depicted by State D and State B, respectively. Their dominant interaction behavior can be broadly called a “Setup-Configure-Start/Follow” pattern. The HMM for the less successful dyad depicts more passive student interactions with the model and more surface exploration behaviors. Their dominant behavior pattern can be broadly called “Setup-Start-Stop,” which was then followed by the manipulation of model parameters. Overall, the HMM for the low achieving dyad indicates that these students did not engage in systematic explorations of the agents depicted in the carbon cycle model.
Figure 3: Hidden Markov Model of the low achieving dyad
In order to triangulate the HMM results, we used other core process visualization and statistical techniques to explore student interactions by constructing interaction graphs (Figure 4 and Figure 5). These graphs depict dyads’ interactions with the carbon cycle models during the experimental period. The vertical axis represents the time line, and the horizontal axis shows the total number of various model control actions taken from the beginning of the session.
[image:5.595.105.490.469.650.2]students changed the fossil fuel rates and speed, which suggests simultaneous quantitative and qualitative explorations for tracking of a CO2 molecule. However, it also reveals that there were noticeable changes in the student behaviors over time. For example, these students changed the CO2 tracking setting during the first half of the session only. This was followed by a shorter, but a noticeable period, when students actively controlled the fossil fuel use. At the end of the session, they interacted with the model simply by pausing and resuming the simulation without changing its settings.
Figure 4: Interaction graph of the high achieving dyad
Similarly the interaction graph for the low achieving dyad generally reaffirmed the pattern depicted by the HMM (Figure 5). It showed that these students interacted with the model much longer, but their interaction was often limited to Setup, Start, and Stop actions. The interaction graph further revealed noticeable changes in the student behavior during the session. For example, in more than half of the session, these two students changed only the fossil fuel use values. This was followed by a short interval when the students started to change and manipulate only speed, and they then proceeded to changing the two parameters simultaneously.
Figure 5: Interaction of the low achieving dyad
Discussion and Conclusion
[image:6.595.80.500.450.650.2]models and learning. Still, given there have been few reported empirical studies of learning in this area, an important finding in this study is that on average all participants significantly enhanced their understanding of important scientific knowledge about greenhouse gases and the carbon cycle.
The process analysis is an ongoing research theme in this project. We aim to find key patterns of students’ interactions with the models, and find ways to identify “on-the-fly” effective and inefficient behaviors for learning with agent-based computer models. A current limitation is that the algorithm that we used to construct the HMMs has a local maxima problem and the log data files are relatively small. In our study, we executed the algorithm one hundred times with random initializations by sampling the initial parameter values from uniform distributions (Jeong et al., 2010; Southavilay, Yacef, & Callvo., 2010). The HMMs were constructed when these executions converged to the same configuration. A better solution is needed to execute this algorithm if we are to use the HMM for providing feedback to students and teachers in real time. Further, the HMM algorithm applied to the student model generated log files identifies patterns that are directly rooted in students’ technical fine-grained actions and constructs only one model for the entire interaction sequence. Two key challenges need further exploration and solution.
First, as we illustrated above, students’ behavior patterns may change during their interaction with the model. For example, we expect that one of possible reasons for the change in student interactions depicted in the timelines (Figure 4 and 5) was the change between the three activities associated with each model. Other research (Levy & Wilensky, 2010) has that found students tend to apply similar strategies when they interact with different models. In addition, their interaction patterns are not fixed and students, particularly successful learners, may flexibly adapt their interaction strategies as their goals change (i.e., when students complete one activity or answer a question and move to the other). The analytical techniques should be flexible enough to identify such macro level changes (i.e., shifts between stages or goals) in student exploration strategies and then construct interaction patterns for each stage separately. Second, when modeling is based on the raw log data, it directly links students’ activities to the students’ technical fine-grained interactions with the model via the interface (i.e., “button click” is equal to student activity). These “technical actions” are likely not identical to the “meaning actions” that are associated with the students’ intentions and conscious behavior. Drawing on evidence from cognitive research, we can expect that “meaning actions” are likely to be more abstract “chunks” of common sequences of student behavior (i.e., clusters of common strings of “technical actions”). Mining techniques are needed for identifying “meaning actions” in student logs initially, which then could be used for constructing further student interaction models.
To address the first challenge, we are currently working on two goals. First, we will put a time/date stamp into the NetLogo log files to mark the beginning and ending of the specific problem solving activities the students are working on. This time/date stamp will allow us to identify possible changes in students’ strategies as they are engaged in the different model-based problem activities; in particular, different model use behaviors in sequences of low and high structured tasks associated with Challenge and Guided Learning and Guided Learning. Second, in order to gain deeper insights into how students performed their activities, we are also exploring possibilities to incorporate process mining techniques, particularly in the initial exploratory stage of the analysis (Trčka et al., 2011; van der Aalst, 2011). Addressing the second challenge, we plan to utilize a Hidden Markov Model clustering algorithm (Shih, Koedinger, & Scheines, 2010) and explore other similar techniques. By clustering and learning HMMs rather than just one for each student group, we can discover different strategies that students employed and to use those strategies to understand and, perhaps in the future, to predict learning outcomes. This combination of techniques should provide a good fit between automatically identified behavior patterns to students’ conscious behavior. In terms of more general research issues highlighted at the start of this paper, these results are encouraging for the continuation of this design-based research, and we are hopeful that the process mining approaches we are developing may be useful in providing further insights into the dynamics of learning scientific knowledge with computer model based learning activities.
References
ACARA. (2011). The Australian Curriculum: Science (Version 1.2). Sydney: Australian Curriculum Assessment and Reporting Authority.
Clement, J. (2000). Model based learning as a key research area for science education. International Journal of Science Education, 22(9), 1041-1053.
Gerard, L. F., Spitulnik, M., & Linn, M. C. (2010). Teacher use of evidence to customize inquiry science instruction. Journal of Research in Science Teaching, 47(9), 1037-1063.
Goldstone, R. L., & Wilensky, U. (2008). Promoting transfer through complex systems principles. Journal of the Learning Sciences, 17(4), 465-516.
Jacobson, M. J., Kapur, M., So, H.-J., & Lee, J. (2011). The ontologies of complexity and learning about complex systems. Instructional Science, 39, 763-783. doi: 10.1007/s11251-010-9147-0
Jeong, H., Biswas, G., Johnson, J., & Howard, L. (2010). Analysis of productive learning behaviors in a structured inquiry cycle using hidden markov models. Paper presented at the 3rd International Conference on Educational Data Mining, Pittsburgh, PA, USA.
Kapur, M. (2006). Productive failure. In S. Barab, K. Hay & D. Hickey (Eds.), Proceedings of the International Conference of the Learning Sciences (pp. 307-313). Mahwah, NJ: Erlbaum.
Kapur, M. (2008). Productive failure. Cognition and Instruction, 26(3), 379 - 424.
Kapur, M. (2010). A further study of productive failure in mathematical problem solving: Unpacking the design components. Instructional Science, DOI: 10.1007/s11251-11010-19144-11253.
Levy, S. T., & Wilensky, U. (2010). Mining students’ inquiry actions for understanding of complex systems. Computers and Education, 56(3), 556-573. doi: 10.1016/j.compedu.2010.09.015
Mayer, R. (2004). Should there be a three-strikes rule against pure discovery learning? The case for guided methods of instruction. American Psychologist, 59(1), 14-19.
National Research Council. (2012). A framework for K-12 science education: Practices, crosscutting concepts, and core ideas. Committee on a Conceptual Framework for New K-12 Science Education Standards. Board on Science Education, Division of Behavioral and Social Sciences and Education. Washington, DC: The National Academies Press.
Pathak, S., Kim, B., Jacobson, M. J., & Zhang, B. (2009). Failures and successes in collaborative inquiry: Learning the physics of electricity with agent-based models. In C. O’Malley, D. Suthers, P. Reimann & A. Dimitracopoulou (Eds.), Computer-supported collaborative learning practices: CSCL2009
conference proceedings (pp. 199-203). Rhodes, Greece: International Society of the Learning Sciences. Railsback, S. F., & Grimm, V. (2011). Agent-based and individual-based modeling: A Practical Introduction.
New Jersey: Princeton University Press.
Reimann, P. (2009). Time is precious: Variable- and event-centred approaches to process analysis in CSCL research. International Journal of Computer-Supported Collaborative Learning, 4(3), 239-257. Romero, C., & Ventura, S. (Eds.). (2006). Data mining in e-learning. Southampton: WITpress.
Romero, C., Ventura, S., Pechenizkiy, M., Ryan, S., & Baker, R. (Eds.). (2010). Handbook of Educational Data Mining. Boca Raton: CRC Press.
Schwartz, D. L., & Bransford, J. D. (1998). A time for telling. Cognition and Instruction, 16(4), 475–522. Shih, B., Koedinger, K. R., & Scheines, R. (2010). Discovery of learning tactics using Hidden Markov Model
clustering. Paper presented at the 3rd International Conference on Educational Data Mining, 2010, Pittsburg, PA, USA.
Southavilay, V., Yacef, K., & Callvo., R. A. (2010, June 11-13). Process Mining to Support Students' Collaborative Writing. Paper presented at the International Conference on Educational Data Mining, Pittsburgh, PA, USA.
Trčka, N., Pechenizkiy, M., & van der Aalst, W. (2011). Process Mining from Educational Data. In C. Romero, S. Ventura, M. Pechenizkiy & R. S. J. d. Baker (Eds.), Handbook of Educational Data Mining (pp. 123-142). Boca Raton: CRC Press.
van der Aalst, W. M. P. (2011). Process Mining: Discovery, Conformance and Enhancement of Business Processes: Springer.
VanLehn, K., Siler, S., & Murray, C. (2003). Why do only some events cause learning during human tutoring? Cognition and Instruction, 2(3), 209-249.
Wilensky, U. (1999). NetLogo. Evanston, IL: Center for Connected Learning and Computer-Based Modeling. Northwestern University (http://ccl.northwestern.edu/netlogo).
Wilensky, U., & Reisman, K. (2006). Thinking like a wolf, a sheep or a firefly: Learning biology through constructing and testing computational theories -- an embodied modeling approach. Cognition & Instruction, 24(2), 171-209.
Zhang, B., Liu, X., & Krajcik, J. S. (2005). Expert models and modeling processes associated with a computer-modeling tool. Science Education, 90, 579-604.