www.scholink.org/ojs/index.php/fet ISSN 2576-1846 (Print) ISSN 2576-1854 (Online)
Original Paper
Student Evaluations of Teaching: Is There a Relationship
between Student Feedback on Teaching and the Student Final
Grade?
Darren Pullen 1*, Steven Collette2, Loan Dao3 & J-F1 1 College of Arts, Law & Education, University of Tasmania, Launceston, Australia
2 The Business Intelligence, Surveys & Analytics Team, University of Tasmania, Launceston, Australia 3 School of Access Education, Central Queensland University, Sydney, Australia
* Darren Pullen, College of Arts, Law & Education, University of Tasmania, Launceston, Australia.
E-mail: [email protected]
Received: June 5, 2019 Accepted: June 28, 2019 Online Published: July 4, 2019 doi:10.22158/fet.v2n3p124 URL: http://dx.doi.org/10.22158/fet.v2n3p124
Abstract
The use of Student Evaluations of Teaching (SET) has become widespread practice in higher education despite inconclusive evidence reported in the literature around its validity. Not surprisingly, the question of the validity of SET continues to be a current debate in higher education, pointing to more research to be conducted in this area. The current study contributes to broadening knowledge and understanding on the validity of SET by drawing on an online unit evaluation completed by students (n=2430 out of total student enrolment of N=7757) in one university across three postgraduate education programs over a two-year period, to determine whether there is a relationship between student feedback on teaching and student final unit grade. Findings revealed that students who achieved very high or very low final unit grades did not participate in the SET, while students who achieved Pass or Credit grades partook in the SET, thus providing feedback. This indicates that teaching and evaluating staff need to be aware that a large subset of their students that are not providing feedback to staff to improve the quality of their courses.
Keywords
1. Introduction
There is much debate surrounding the validity and utility of Student Evaluations of Teaching (SET) within the current literature. Some papers have posited that such evaluations are important mechanisms for improving not only teaching practice but also course content (e.g., Borman & Kimball, 2005; Kinash et al., 2015; Richardson, 2010; Secret, Bentley, & Kadolph, 2016), while some authors have raised concerns around its validity and utility (e.g., Hornstein, 2017; Spooren, Brock, & Mortelmans, 2013). According to Hornstein (2017), studies on the validity of SET “have been beset by questionable conceptual and statistical interpretations … [that] … have rendered the conclusions questionable at best” (p. 5). Thus, the validity of SET is a highly contested topic in which there is inconclusive evidence around its validity (Spooren et al., 2017), which leads to its utility being questioned for purposes, such as improving teaching and promotion and tenure. This situation calls for continued research in the area.
This study contributes to the debate on validity of SET by investigating the relationship between student feedback on teaching and the students’ final unit grade. Some studies have investigated this relationship (e.g., Centra, 2003; Eizler, 2002; March & Roche, 2000), however much of this research is dated. This calls for more recent studies to be conducted in this area, particularly considering online evaluations are becoming more prevalent in universities. The current study contributes to the debate on validity of SET in two key areas. First, we assess who are the key respondents in terms of their final unit grades. Second, students’ feedback on teaching is assessed to determine whether more favourable student feedback on teaching is associated with higher grades, and whether less favourable student feedback on teaching is associated with lower grades. For our analysis we investigated two research questions: 1) Does the grade a student receives from the class affect the likelihood that they will respond to the SET? 2) Does the grade affect the type of response made by the student?
1.1 Background Literature—The Use of SET
Higher education institutions employ several mechanisms for monitoring and evaluating course satisfaction from the end-user/students-perspective. These mechanisms range from the informal, such as a tutor asking their students how they are finding the course, through to formal. In terms of formal student evaluations of teaching and courses (units) Australian universities employ a standard survey tool that contains the same base questions for use across all their courses.
[SES], annual Graduate Outcomes Survey [GOS] and annual Graduate Outcomes Survey-Longitudinal [GOS-L] to measure levels of satisfaction and course performance. These results are being embedded into organisational Key Performance Indicators. Similarly, internal student feedback is also being embedded into organisational Key Performance Indicators and used as evidence for probation, promotion (Fraile & Bosch-Morell, 2015; McClain et al., 2017) and academic achievement in addition to curriculum development (Richardson, 2005).
Within teaching and the education sectors it has been recognised and shown that amongst other aspects, such as content and pedagogical knowledge, teaching quality influences student achievement (Boman & Kimball, 2005; Rozina, Noor, & Mohamed, 2016). In determining the effectiveness of the teaching and content, educators have used amongst other things, student surveys of teaching and content effectiveness. Commonly these types of student evaluations on teaching are used by teachers and institutions to monitor the effectiveness of the teaching instruction and as a mechanism for course quality assurance (Macfadyen, Dawson, Prest, & Gašević, 2016). Indeed, student ratings have a high degree of validity (Cashin, 1995; Felder, 1992; Kong, 2014). After all, it is the students who are being taught and are learning content and attempting to meet course learning outcomes.
The use of SET amongst academics to improve their teaching has been shown to be low (Stein et al., 2012, 2013). Gold and Adam (2016) point out that such low use of SET to improve teaching is attributed to concerns around validity of data from these evaluations, thus making them less likely to be used for improving teaching. The literature on validity of SET is further explored next.
1.2 Validity of SET
Despite reported various uses of data from SET, concerns have been raised in the current literature around the validity of such data (Spooren et al., 2013). There is some discussion amongst the academic community on the validity of online evaluations due to responses being lower in number than paper-based surveys and being less representational of the learning and teaching experience (Rienties, 2014); however, some studies show that lengthier comments are supplied in online surveys (Bennett & De Bellis, 2010) that may be more positive (Sorenson & Reiner, 2003). The meta-analytical review conducted by Spooren et al. (2013) on the validity of SET also found that students provided more comments in these evaluations that are administered online.
Studies that have focused on the relationship between grades and SET have raised further concerns around the validity of these evaluations (e.g., Abrami et al., 1990; Isely & Singh, 2005; McPherson, 2006). According to McClain et al. (2017, such studies confirm the association between grades and SET. Some of these studies (e.g., Johnson, 2003; Lin, 2009) have found evidence of “reciprocity effect” (McClain, Gulbis, & Hays, 2017, p. 4) in which students rate instructors according to the grade they received (i.e., reward instructors who reward them and punish those who punished them), while some studies have shown evidence of “leniency effect” (McClain et al., 2017, p. 4) in which instructors who are seen as lenient in their marking are said to receive more favourable ratings (e.g., Abrami et al., 1990; Johnson, 2003; McPherson, 2006). However, it should be noted that much of these studies are old and as online evaluations become more prevalent in universities, this calls for more research to be conducted on the relationship between grades and SET.
While the above studies have raised questions around the validity of data from SET, it is argued that more research is still necessary to broaden knowledge and understanding in this area. According to Spooren et al. (2013), evidence on the validity of SET continue to be inconclusive and that “the utility and validity ascribed to SET should continue to be called into question” (p. 629). The findings of this study are expected to contribute to broadening knowledge and understanding around validity of data from SET, which may lead to more informed future use of such data.
2. Method
2.1 Data Collection
This research used student feedback data collected from the Unit Survey that was administered online from 2013 to 2015 inclusive in three postgraduate programs in the case university, namely the Masters of Teaching, and Master of Education and Master of Education (TESOL). This provided an opportunity to observe a balanced view of students’ feedback from these programs, which have many units, yet moderate student enrolments. This kept the data set within a reasonable tolerance limit. Students have access to the unit evaluation survey for a period of 6-weeks, 2-weeks prior to the conclusion of the unit and 4-weeks post. At the time of student completion of the SET survey they do not know their final award (grade) for the unit, though many could work out an approximate award based upon their assessments
2.1.1 Instrument
historical data held within the University’s data warehouse enables the pilot to review and compare unit feedback across a reasonable timeframe.
The content of the Unit Survey feedback reports provided to Unit Coordinators includes demographic information derived from the enrolment information. This allowed demographics data on the student cohorts to be accessed and investigated without retrieving extra data.
The survey data were stored within the University’s data warehouse within Information Technology Services (ITS), to which the project team did not have direct access. To investigate the relationship, the ITS technical analyst was able to pair the individual confidential response from the student with the final unit grade received by the student, without supplying raw data with the student ID stored in the data warehouse. This method using ITS as independent custodians of the data guaranteed anonymity for the respondents and allowed mapping of unit demographics (e.g., Fe/Male, Age, Campus/Location, Study Mode, etc.) provided to staff within existing eVALUate reporting.
2.1.2 Analysis
The quantitative data were analysed using IBM SPSS Statistics 22 to review the frequencies and relationships between the feedback from individual Likert scale questions and final unit grades. The qualitative data were analysed by sentiment analysis by reading and coding each comment in the two free text questions individually within Excel according to whether the student provided feedback using positive or negative language, made statements with no sense of sentiment or made no comment at all. The revised coding was then imported into the SPSS for further analysis.
3. Results and Discussions
To better understand the statistical techniques used on the data and its meaning the results are presented with a running commentary (discussion). Such an approach hopefully will provide a context for the analysis and what the findings mean.
Table 1 depicts the courses reviewed and the gender composition of each of those courses. Participant age in years can be grouped into four roughly equal sub-groups, with 49% in the 21-28-year age group, another 27% in the 29-36-year age group, and the final 24% in the 37-69-year age group. Student unit scores can be grouped according to whether students have failed, (27%) passed (18%), achieved a credit (28%), a distinction (20%) or a high distinction (7%). In terms of percentages required to achieve each of the aforementioned grades a pass grade is from 50-59%, credit 60-69%, distinction 70-79% and a high distinction 80+%.
In terms of student responses on their unit teachers’ style and unit content they were asked to provide Likert scale responses to 11 items, using a five-point Likert scale (Strongly disagree=1, Disagree=2, Unable to judge=3, Agree=4, Strongly agree=5).
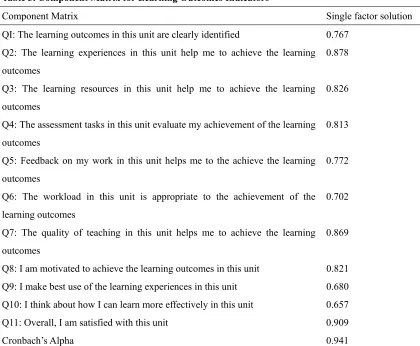
single and multifactorial solutions. These analyses provided evidence for the validity of the identified factor structure with KMO=>.800 and Bartlett’s test of sphericity<.05. Cronbach’s Alpha procedure was utilised to provide evidence for the reliability of the factor structure (CA=>.700). Factor loadings were visible if .250 or above, with the threshold for acceptable loadings set at .300.
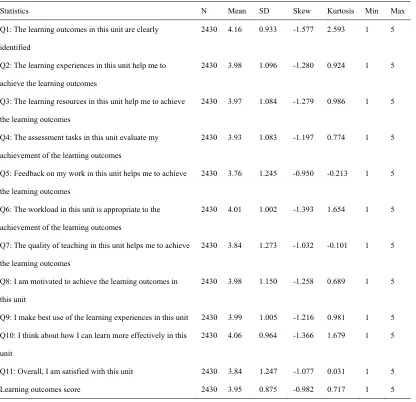
As indicated in Table 2, these students responded most positively to Q1 (the learning outcomes in this unit are clearly identified), Q6 (The workload in this unit is appropriate to the achievement of the learning outcomes), and Q10 (I think about how I can learn more effectively in this unit) with all three sets of mean responses in the Agree (4) to Strongly agree (5) interval. They responded least positively to Q5 (Feedback on my work in this unit helps me to achieve the learning outcome).
Table 1. Female/Male Student Count and Percentage by Year for Enrolled and Responding Students
F M
Year
Course
Name Studen
t enrolme n t % enrolmen t Count of responses
% total en
rolmen t % enrolmen t res ponded Studen t enrolme n t % enrolmen t Count of responses
% total en
rolmen
t
% enrolmen
t res
ponded
Total enrolment Total respondent
s
% Total responde
nts
2014
Master of
Education 94 65 29 20 30 50 34 8 5 16 144 37 25
Master of Education
(TESOL) 14 63 8 36 22 0
Master of Education
with Honours 1 100 1 0
Master of
Teaching 2578 69 718 19 27 1146 30 322 8 28 3724 1040 27
2015
Master of
Education 30 68 12 27 40 14 31 1 2 7.1 44 13 29
Master of Education
(TESOL) 20 74 11 40 55 7 25 4 14 57 27 15 55
Master of
Teaching 2539 66 936 24 36 1256 33 389 10 30 3795 1325 34
Table 2. Descriptive Statistics for 11 Course Outcome Indicators
Statistics N Mean SD Skew Kurtosis Min Max
Q1: The learning outcomes in this unit are clearly identified
2430 4.16 0.933 -1.577 2.593 1 5
Q2: The learning experiences in this unit help me to achieve the learning outcomes
2430 3.98 1.096 -1.280 0.924 1 5
Q3: The learning resources in this unit help me to achieve the learning outcomes
2430 3.97 1.084 -1.279 0.986 1 5
Q4: The assessment tasks in this unit evaluate my achievement of the learning outcomes
2430 3.93 1.083 -1.197 0.774 1 5
Q5: Feedback on my work in this unit helps me to achieve the learning outcomes
2430 3.76 1.245 -0.950 -0.213 1 5
Q6: The workload in this unit is appropriate to the achievement of the learning outcomes
2430 4.01 1.002 -1.393 1.654 1 5
Q7: The quality of teaching in this unit helps me to achieve the learning outcomes
2430 3.84 1.273 -1.032 -0.101 1 5
Q8: I am motivated to achieve the learning outcomes in this unit
2430 3.98 1.150 -1.258 0.689 1 5
Q9: I make best use of the learning experiences in this unit 2430 3.99 1.005 -1.216 0.981 1 5 Q10: I think about how I can learn more effectively in this
unit
2430 4.06 0.964 -1.366 1.679 1 5
Q11: Overall, I am satisfied with this unit 2430 3.84 1.247 -1.077 0.031 1 5 Learning outcomes score 2430 3.95 0.875 -0.982 0.717 1 5
Table 3. Component Matrix for Learning Outcomes Indicators
Component Matrix Single factor solution
QI: The learning outcomes in this unit are clearly identified 0.767 Q2: The learning experiences in this unit help me to achieve the learning outcomes
0.878
Q3: The learning resources in this unit help me to achieve the learning outcomes
0.826
Q4: The assessment tasks in this unit evaluate my achievement of the learning outcomes
0.813
Q5: Feedback on my work in this unit helps me to the achieve the learning outcomes
0.772
Q6: The workload in this unit is appropriate to the achievement of the learning outcomes
0.702
Q7: The quality of teaching in this unit helps me to achieve the learning outcomes
0.869
Q8: I am motivated to achieve the learning outcomes in this unit 0.821 Q9: I make best use of the learning experiences in this unit 0.680 Q10: I think about how I can learn more effectively in this unit 0.657
Q11: Overall, I am satisfied with this unit 0.909
Cronbach’s Alpha 0.941
3.1 Inferential Statistics
Table 4. Spearman’s Rho for Learning Outcomes Relative to Personal Variables
Learning Outcomes Spearman’s Rho Sig.(2-tailed) N
Age .118** 0.000 2430
Unit Score .194** 0.000 2046
Participants are female .052** 0.010 2430
Year .050* 0.015 2430
Semester 0.033 0.103 2377
** Correlation is significant at the 0.01 level (2-tailed); * Correlation is significant at the 0.05 level (2-tailed).
3.1.2 Regression Outcomes
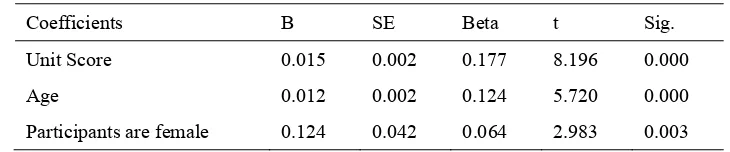
Preliminary to conducting these tests, regression diagnostics were obtained by ticking the Collinearity diagnostics box in the Statistics dialogue box with five selected predictors (Year of course; Semester of course; Gender is female; Age in years, & Unit score) and with learning outcomes as the outcome variable. Also, multivariate outliers were examined by ticking the Mahalanobis box in the Save dialogue box. After excluding year and semester, based on Collinearity testing, eigenvalue condition indices, tolerances, and the Variance Inflation Factor (VIF) values were deemed to be very acceptable. Based on Mahalanobis values, three cases were excluded from subsequent analyses. To simplify the display, all regression outcomes have been reported in tabular format with only significant outcomes per DV included, as indicated in Table 5.
Table 5. Regression Coefficients for Significant Predictors of Learning Outcomes
Coefficients B SE Beta t Sig.
Unit Score 0.015 0.002 0.177 8.196 0.000
Age 0.012 0.002 0.124 5.720 0.000
Participants are female 0.124 0.042 0.064 2.983 0.003
As indicated in Table 5, after excluding year and semester (neither of these significant predictors of learning outcomes), the model was significant (p<.001), with the 5% of variance explained (R2=.057). 3.1.3 ANOVA Outcomes
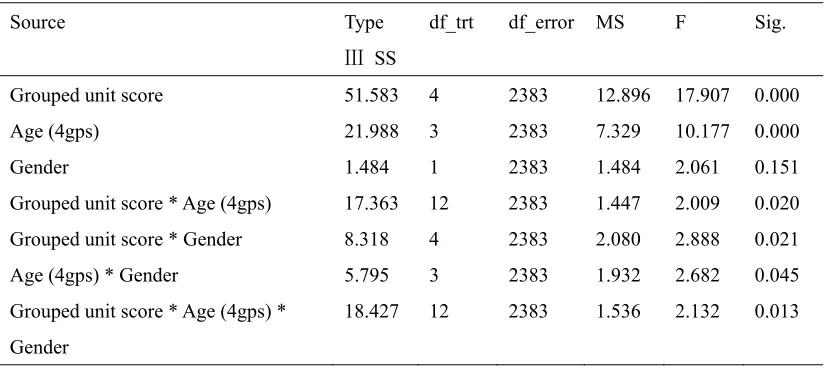
[image:10.595.113.478.468.544.2]Table 6. ANOVA Outcomes
Source Type
Ⅲ SS
df_trt df_error MS F Sig.
Grouped unit score 51.583 4 2383 12.896 17.907 0.000
Age (4gps) 21.988 3 2383 7.329 10.177 0.000
Gender 1.484 1 2383 1.484 2.061 0.151
Grouped unit score * Age (4gps) 17.363 12 2383 1.447 2.009 0.020 Grouped unit score * Gender 8.318 4 2383 2.080 2.888 0.021
Age (4gps) * Gender 5.795 3 2383 1.932 2.682 0.045
Grouped unit score * Age (4gps) * Gender
18.427 12 2383 1.536 2.132 0.013
Levene’s test of equality of error variances was significant, consistent with this analysis being best conducted via non-parametric methods. However, given the interest in interactions, and the robustness of parametric methods, these are reported here.
As indicated in Table 6, the main effects for grouped unit score and age group were significant. Further, the two-way interactions between the grouped unit score and age group, the grouped unit score and gender, and the interaction between age group and gender were all significant as was the three-way interaction between grouped unit score, age group and gender.
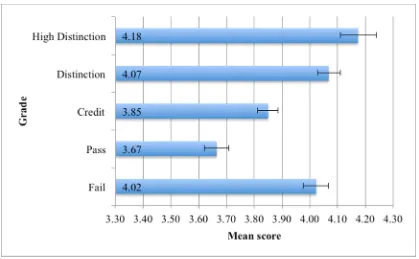
As illustrated in Figure 1, participants with high distinction or distinction scores obtained significantly higher learning outcome scores than those who obtained credit or pass scores. However, participants who failed these courses did about as well in terms of learning outcome scores as those with distinctions or high distinctions.
Figure 1. Mean Learning Outscores for Each Grade Achieved
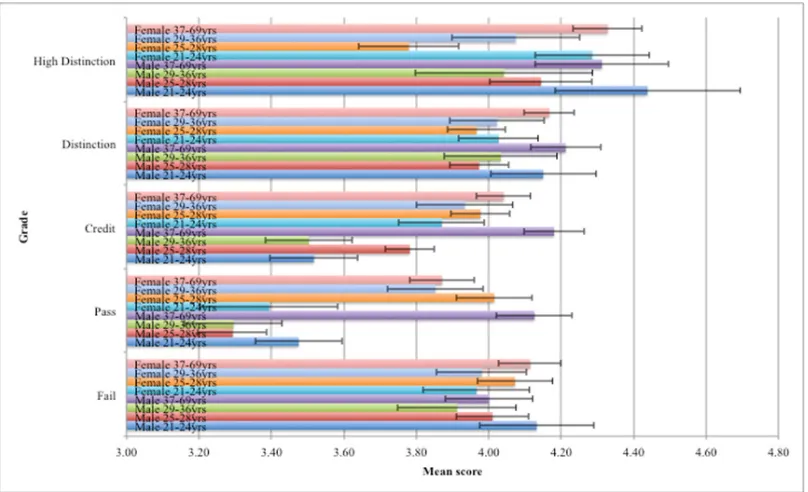
As illustrated in Figure 2, students in the 37-69 year with high distinctions obtained significantly larger learning outcome scores than students with pass or fail grades. In other age groups, students with distinctions obtained significantly higher learning outcome scores than students with pass marks. However, those with fail grades obtained learning outcomes equivalent to those with distinctions or high distinctions.
Figure 2. Two-Way Interaction between Age Group and Grade
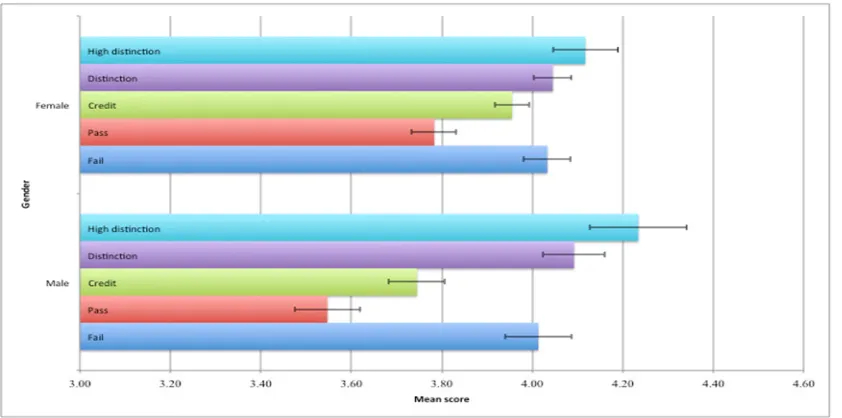
Figure 3. Two-Way Interaction between Gender and Grade
As illustrated in Figure 4, female students in the 37-69-year age group obtained significantly higher learning outcome scores than those in the 21-24-year age group whereas male students in 37-69-year age group obtained significantly higher learning outcomes than those in every other age group.
Three-way interactions are by their nature problematic to interpret. As illustrated by Figure 5, for those with high distinctions, males and females in the 21-24 and 37-69-year age groups obtain significantly higher learning outcome scores than females in the 25-28-year age group, whereas this is not the case for 25-28-year-old males.
[image:13.595.90.511.309.518.2]Figure 4. Two-Way Interaction between Age Group and Gender
Figure 5. Three-Way Interaction between Age Group, Gender, and Grade Le
[image:14.595.97.501.362.608.2]4. Conclusion
All students receiving various grades have provided either quantitative or qualitative feedback through the Unit Survey within the sample group. Low and high achievers were not found to be the key responders, these were mid-range students. Qualitative feedback received was not abusive or unprofessional and was constructive. Of interest were that students who failed rated their instructors nearly as highly as those students who achieved a distinction or high distinction grade.
There is still much work to do within the survey space; from encouraging non-responders to participate and increase response rates to continuing the cycle of student education on why feedback on the courses and student experience is important, plus closing the feedback loop and ensuring that students know that we are listening to their student voice to implement change.
References
Abrami, E., d’Apollonia, S., & Cohen, E. (1990). The validity of student ratings of instruction: What we know and what we do not. Journal of Educational Psychology, 82, 219-231. https://doi.org/10.1037/0022-0663.82.2.219
Bachen, C. M., McLoughlin, M. M., & Garcia, S. S. (1999). Assessing the role of gender in college students’ evaluations of faculty. Communication Education, 48, 193-210. https://doi.org/10.1080/03634529909379169
Basow, S. A., & Silberg, N. T. (1987). Student evaluations of college professors: Are female and male professors rated differently? Journal of Educational Psychology, 79, 308-314. https://doi.org/10.1037//0022-0663.79.3.308
Bennett, T., & De Bellis, D. (2010). The move to a system of flexible delivery mode (online v. paper) unit of study student evaluations at Flinders University. Management issues and the study of initial changes in survey, volume, response rate and response level. Journal of Institutional Research,
15(1), 41-53.
Borman, G., & Kimball, S. (2005). Teacher quality and educational equality: Do teachers with higher standards-based evaluation ratings close student achievement gaps? Elementary School Journal,
106, 3-20. https://doi.org/10.1086/496904
Cashin, W. (1995). Student Ratings of Teaching: The Research Revisited. IDEA Paper No. 32, Kansas State University Center for Faculty Evaluation and Development, September. Retrieved from http://www.idea.ksu.edu/
Centra, J. A. (2003). Will teachers receive higher student evaluations by giving higher grades and less
course work? Research in Higher Education, 44(5), 495-518.
https://doi.org/10.1023/A:1025492407752
Felder, R. (1992). What Do They Know, Anyway? Chem. Eng. Ed., 26(3), 134. Retrieved from http://www.ncsu.edu/felder-public/Columns/Eval.html
Fraile, R., & Bosch-Morell, F. (2015). Considering teaching history and calculating confidence intervals in student evaluations of teaching quality. Higher Education, 70(1), 55-72. https://doi.org/10.1007/s10734-014-9823-0
Gannaway, D., Green, T., & Mertova, P. (2017). So how big is big? Investigating the impact of class size on ratings in student evaluation. Assessment & Evaluation in Higher Education, 1-10. https://doi.org/10.1080/02602938.2017.1317327
Hornstein, H. A. (2017). Student evaluations of teaching are an inadequate assessment tool for
evaluating faculty performance. Cogent Education, 4(1), 1-8.
https://doi.org/10.1080/2331186X.2017.1304016
Isely, P., & Singh, H. (2003). Do grades lead to favourable student evaluations? The Journal of Economic Education, 36(1), 29-42. https://doi.org/10.3200/JECE.36.1.29-42
Johnson, V. E. (2003). Grade Inflation: A Crisis in College Education. New York, USA: Springer. Kinash, S., Naidu, V., Knight, D., Judd, M., Nair, C., Booth, S., … Tulloch, M. (2015). Student
feedback: A learning and teaching performance indicator. Quality Assurance in Education, 23(4), 410-428. https://doi.org/10.1108/QAE-10-2013-0042
Kong, T. (2014). The validity and reliability of the student evaluation of teaching: A case in a private educational institution in Malaysia. International Journal for Innovation Education and Research,
2(9), 57-63.
Lin, T. (2009). Endogenous effects of midterm grades and evaluations: A simultaneous framework.
Economics Bulletin, 29(3), 1731-1742.
Macfadyen, L. P., Dawson, S., Prest, S., & Gašević, D. (2016). Whose feedback? A multilevel analysis of student completion of end-of-term teaching evaluations. Assessment & Evaluation in Higher Education, 41(6), 821-839. https://doi.org/10.1080/02602938.2015.1044421
MacNell, L., Driscoll, A., & Hunt, A. N. (2015). What’s in a name: Exposing gender bias in student ratings of teaching. Innovative Higher Education, 40(4), 291-303. https://doi.org/10.1007/s10755-014-9313-4
Marsh, H. W., & Roche, L. A. (2000). Effects of Grading Leniency and Low Workload on Students’ Evaluations of teaching: Popular myth, bias, validity, or innocent bystanders? Journal of Educational Psychology, 92(1), 202-228. https://doi.org/10.1037//0022-0663.92.1.202
McClain, L., Gulbis, A., & Hays, D. (2017). Honesty on student evaluations of teaching: Effectiveness, purpose, and timing matter! Assessment & Evaluation in Higher Education, 1-17. https://doi.org/10.1080/02602938.2017.1350828
Rienties, B. (2014). Understanding academics’ resistance towards (online) student evaluation.
Richardson, J. (2005). Instruments for obtaining student feedback: A review of the literature.
Assessment and Evaluation in Higher Education, 30, 387-415.
https://doi.org/10.1080/02602930500099193
Rozina, N., Noor, Z., & Mohamed, M. (2016). Student ratings of teaching effectiveness: An Importance-Performance Analysis (IPA). Journal of Educational and Social research, 6(3), 33-44. Secret, M., Bentley, K., & Kadolph, J. (2016). Student voices speak quality assurance: Continuing
improvement in online social work education. Journal of Social Work Education, 52(1), 30-42. https://doi.org/10.1080/10437797.2016.1112630
Shah, M., Cheng, M., & Fitzgerald, R. (2017). Closing the loop on student feedback: The case of Australian and Scottish universities. Higher Education, 74(1), 115-129. https://doi.org/10.1007/s10734-016-0032-x
Spooren, P., Brock, B., & Mortelmans, D. (2013). On the Validity of Student Evaluation of Teaching.
Review of Educational Research, 83(4), 598-642. https://doi.org/10.3102/0034654313496870 Stein, S., Spiller, D., Terry, S., Harris, T., Deaker, L., & Kennedy, J. (2012). Unlocking the Impact of
Tertiary Teachers’ Perceptions of Student Evaluations of Teaching. Wellington: Ako Aotearoa. Stein, S., Spiller, D., Terry, S., Harris, T., Deaker, L., & Kennedy, J. (2013). Tertiary Teachers and
Student Evaluations: Never the Twain Shall Meet? Assessment & Evaluation in Higher Education,