TECHNICAL NOTE
Thermodynamically optimal
whole-genome tiling microarray design
and validation
Hyejin Cho
1and Hui‑Hsien Chou
1,2*Abstract
Background: Microarray is an efficient apparatus to interrogate the whole transcriptome of species. Microarray can be designed according to annotated gene sets, but the resulted microarrays cannot be used to identify novel transcripts and this design method is not applicable to unannotated species. Alternatively, a whole‑genome tiling microarray can be designed using only genomic sequences without gene annotations, and it can be used to detect novel RNA transcripts as well as known genes. The difficulty with tiling microarray design lies in the tradeoff between probe‑specificity and coverage of the genome. Sequence comparison methods based on BLAST or similar software are commonly employed in microarray design, but they cannot precisely determine the subtle thermodynamic com‑ petition between probe targets and partially matched probe nontargets during hybridizations.
Findings: Using the whole‑genome thermodynamic analysis software PICKY to design tiling microarrays, we can achieve maximum whole‑genome coverage allowable under the thermodynamic constraints of each target genome. The resulted tiling microarrays are thermodynamically optimal in the sense that all selected probes share the same melting temperature separation range between their targets and closest nontargets, and no additional probes can be added without violating the specificity of the microarray to the target genome.
Conclusions: This new design method was used to create two whole‑genome tiling microarrays for Escherichia coli MG1655 and Agrobacterium tumefaciens C58 and the experiment results validated the design.
Keywords: Tiling microarray design, Prokaryote transcriptome, Thermodynamics, Hybridization, PICKY software, Microarray validation
© 2016 The Author(s). This article is distributed under the terms of the Creative Commons Attribution 4.0 International License (http://creativecommons.org/licenses/by/4.0/), which permits unrestricted use, distribution, and reproduction in any medium, provided you give appropriate credit to the original author(s) and the source, provide a link to the Creative Commons license, and indicate if changes were made. The Creative Commons Public Domain Dedication waiver (http://creativecommons.org/ publicdomain/zero/1.0/) applies to the data made available in this article, unless otherwise stated.
Findings Background
Different types of microarray exist, and they all have DNA probes on the microarray surface to hybrid-ize, or capture, targeted sequences in the samples that are poured over them. Microarrays differ on how their probes are designed and what are their intended targets. The most common microarrays are designed to detect gene expressions; their probes are designed according to annotated gene sets and are used to detect individual gene expressions. Although gene expression microarrays
have been in use for more than a decade and have pro-duced a large volume of biological data, they are gradu-ally being replaced by next-generation sequencing (NGS) techniques because NGS techniques can detect novel RNA transcripts and provide a better dynamic range of measured gene expression values [1].
Nevertheless, microarrays are still being used in some other applications. For example, sequence fragment cap-turing microarrays work by grabbing specific genome fragments or RNA transcripts of interest to research-ers, hence enriching the targeted samples; the captured fragments can then be sequenced and analyzed using NGS techniques [2, 3]. In this work, we focus on another application where microarrays are still viable—the whole-genome tiling microarrays. A tiling microarray
Open Access
*Correspondence: [email protected]
2 Department of Computer Science, Iowa State University,
Ames, IA 50011, USA
is designed against a genome, not a gene set, and can be used to detect all transcription activities from either annotated genes or novel transcripts; the latter may include short regulatory RNAs that are the interest of recent studies [4–6].
We have developed a new tiling microarray design method based on the whole-genome thermodynamic analysis software Picky that was previously developed to design traditional microarrays [7–9]. We then used our new method to design two whole-genome tiling micro-arrays for Escherichia coli (E. coli) MG1655 and Agro-bacterium tumefaciens (A. tumefaciens) C58. Picky can analyze a whole genome to identify thermodynamically unique probes. The melting temperatures of each probe candidate with its intended target and with its closest nontargets anywhere in the genome are calculated by Picky according to the thermodynamic nearest-neighbor models of prefect matches [10], mismatches [11–14], bulges [15], and dangling-ends [16]. The equations used by Picky are deterministic according to thermodynamic principles, and Picky exhaustively applies these equa-tions to all potential probe-target as well as probe-non-target hybridizations. Picky design qualities have been quantitatively validated [17].
The main advantage of Picky over sequence-level comparison software such as BLAST [18] is its preci-sion. Although BLAST is often used to estimate probe specificity by calculating its identity and match length to nontargets [19, 20], these estimates are less precise than thermodynamics. For example, we screened a pre-vious tiling microarray probe set containing 409,807 probes for a bacterial species using Picky [21], and found 21,773 (5.3 %) of its probes have the potential to hybridize to nontargets (output W83.picky in Additional file 1). In Table 1, sample data from this probe set shows that probes of the same length (50 bp), the same iden-tity to nontarget [24 bp (base-pair); <50 %] and the same match stretch to nontarget (14 bp; <30 %) can still have a wide estimated melting temperatures range from 28 to 68 °C. Furthermore, the lowest probe-to-target melting temperature at 54.33 °C is much lower than the highest probe-to-nontarget melting temperature at 68.56 °C. Essentially, it is impossible to set a single microar-ray hybridization temperature that allows all probes to function effectively. This probe set was designed using a sophisticated pipeline involving BLAST to screen for cross-hybridizations and was considered optimal by that standard [22]. Nevertheless, thermodynamic equa-tions are inherently nonlinear, thus a wide range of melt-ing temperatures can still be calculated from the same sequence-level identities.
Our goal in this work is to adapt Picky, which was originally developed to take annotated gene sets as input
and design traditional microarrays, for the design of tiling microarrays. We hope to achieve maximum probe cover-age of the genome while maintaining the same thermo-dynamic specificity of Picky designed probes. After the tiling microarrays for E. coli MG1655 and A. tumefaciens C58 were designed using our new method and manufac-tured, the two bacteria were grown under 10 different treatment conditions to trigger gene expression changes. Subsequently, samples extracted from them were applied to the two tiling microarrays to validate their design qual-ity and also to uncover novel transcripts.
Methods
Sample procurement and genome confirmation
The E. coli MG1655 strain was obtained from CGSC E. coli genetics resources at Yale University (CGSC #6300) [23]. The A. tumefaciens C58 strain was obtained from Dr. Kan Wang’s lab at Iowa State University [24]. Bac-teria were recovered from the delivery medium and grown under standard conditions (37 °C in Luria–Bertani medium for MG1655 and 28 °C in YEP medium for C58). The QIAGEN DNeasy blood & Tissue kit (#69504) was used to extract total DNA from both bacteria. The Qubit 2.0 Flurometer was used to precisely quantify DNA con-centration in the samples and the Experion DNA 12 K Analysis Kit was used to check the DNA quality. The total DNA was eluted in 100 uL buffer and 50 uL of that was sent for sequencing confirmation.
The genomes of the two bacteria MG1655 and C58 were resequenced using the Illumina HiSeq 2000 instru-ment and de novo assembled using the Velvet software [25]. Minimus2, which is part of the AMOS software package, was used to merge Velvet contigs to form longer scaffolds [26]. BLAT was then used to align merged contigs to the reference genomes [27]. The alignment is important to correctly orient some contigs, find repeated contigs and fill in the gaps among aligned contigs. The reference genomes were used to guide the assembly of the contigs, but not the individual reads. The AT plas-mid of C58 was not successfully assembled due to lack of matched contigs, thus the reference sequence was used in subsequent design.
SRX806654 and the assembled new genomic sequences are provided in Additional file 2.
Tiling microarray design
Based on the assembled genome sequences, we designed the two whole-genome tiling microarrays for E. coli MG1655 and A. tumefaciens C58 using PICKY [9, 28]. The design process is summarized as follows. The genome sequences were broken up into 100 bp fragments without overlaps—these were treated as gene targets for probe design to ensure even distribution of the tiling probes. Separately, 50 bp fragments centered on the boundaries between the target fragments (25 bp on either side of a boundary) were extracted and treated as unintended tar-gets for probe design (i.e., fragments to avoid) to ensure that tiling microarray probes will not inadvertently target the boundaries between fragments. PICKY was run using both the targets and unintended fragments as input. The benefit of this approach is that we can take full advantage of the probe specificity calculation offered by PICKY while making it design tiling microarrays with evenly distrib-uted probes. The following parameters specific to tiling microarray design were given to PICKY: maximum match length 18, minimum match length 8, minimum sequence
similarity 66 %, and minimum melting temperature differ-ence 5 °C. Any probe candidate with the maximum match to any off-targets are automatically ruled out for further consideration. Probe candidates with the minimum match to any off-targets are thermodynamically screened by extending around the matched region up to the minimum sequence similarity level to estimate its melting tempera-ture with potential cross-hybridization off-targets; probe candidates with less than the minimum melting tempera-ture difference between its target and its closest off-target will not be selected. All other PICKY parameters were taken at their default values, including the screening of both strands of each input sequence to ensure probe speci-ficity in either direction. The minimum and maximum match length parameters and the minimum sequence similarity parameter ensure that a wide range of nontarget matches will be screened thermodynamically by PICKY. The minimum melting temperature difference ensures that only probes unique to the target fragments will be selected.
After running PICKY the first time, it turned out that some target fragments did not have matching probes under the stringent design parameters. To increase the number of useful probes, we ran PICKY again with the following new input. The target fragments were separated into two different sets: one containing fragments without probes as a new target set, and the other containing frag-ments that had probes designed for them during the first PICKY run. The second set was combined with a modi-fied boundary fragment set to form the new unintended fragment set. The modified boundary fragments were shortened to 40 bp centered on the boundaries between the target fragments. The second PICKY run used the same parameters as in the first run, but it produced Table 1 Sequence-level comparisons cannot faithfully predict thermodynamic properties
Probe (top strand) and nontarget (lower strand) match (complementary bases in uppercase; mismatched bases in lowercase)
Nontarget match identity (bp)
Nontarget match stretch (bp)
Probe to nontarget melting temp. (°C)
Probe to target melting temp. (°C)
tagagtagAAaaaCAAataAaAGAcattaaAGAAAATGATTTTTgattTttgtgttag
TTaccGTTacgTgTCTcacgccTCTTTTACTAAAAAaagtAt 24 14 28.39 55.14 CTtgAaaTtgaaTacAaattctaTaaaTCAATGATATGAATacaataACAGAtgTgg
AtagaAgcTacctcgaAgggAGTTACTATACTTActcaccTGT 24 14 29.92 54.33 TcaAAgtctAtgatAttcgacAtAtaaTctTGAATCGAAAAAACaGCctcAagTT
tctcTtaccTgtctgaTgTtgaAatACTTAGCTTTTTTGaCGcct 24 14 38.04 61.27 cGGTGCTCGATACGAttGCcCtgatgcTGacaaggCttctaTcgAaTCtca
CCACGAGCTATGCTctCGaGggccacACaagcggGttccgAagTaAGga 24 14 48.01 72.36 agcagTcgCtAcCGcttgcCGGACGAATTGCCGgTCGctccTgtttGggcctaaa
AaaGcTcGCattttGCCTGCTTAACGGCaAGCacaaAaggcCttt 24 14 58.02 80.75 AacGgAGAaggaGagTgCcgggcGGAAGCCGGCGGCGaaaaCgTccaccg
TgcCgTCTaggaCatAgGcttacCCTTCGGCCGCCGCacggGtActgcta 24 14 64.30 82.65 gGCCGGTGGCGGCCGtGagatgtcgctctCggcGAatgGCatTctgAt
[image:3.595.66.539.100.289.2]CTaCGGCCACCGCCGGCtCaaatgttatctcGgaaCTacaCGctAcggTgGA 24 14 68.56 80.10
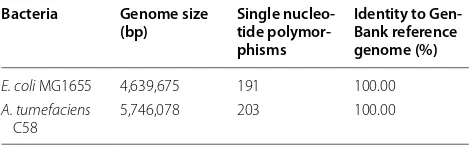
Table 2 Polymorphisms between lab bacteria genomes and official GenBank reference genomes
Bacteria Genome size
(bp) Single nucleo-tide polymor-phisms
Identity to Gen-Bank reference genome (%)
E. coli MG1655 4,639,675 191 100.00
A. tumefaciens
[image:3.595.56.291.340.414.2]additional probes because the shortened boundary frag-ments allow more borderline probes to be selected.
Microarray manufacturing
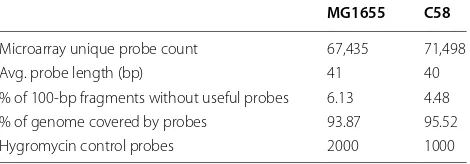
Microarray probes obtained from both PICKY runs were merged to obtain the final design output. When design-ing tildesign-ing microarray for the C58 bacterium, the pTi plasmid of C58 was also added to the design data set to increase the versatility of the C58 tiling microarray. We have chosen the NimbleGen Custom Microarray Service to manufacture the tiling microarrays. The NimbleGen microarray platform has a synthesis cycle limitation of 148 on custom designed microarray probes [29]. There-fore, 19 MG1655 and 20 C58 probes were removed because they exceeded the limit.
Probes for the exogenous gene hygromycin to E. coli and A. tumefaciens were added: 1000 hygromycin probes were added to the C58 probe set and 2000 hygromycin probes were added to the MG1655 probe set. These probes can be used as quality controls if the hygromycin gene is added to each bacteria sample during the microarray hybridization protocol to help detect any technical bias. The manufac-turer also added other control probes to the final probe set for proprietary quality control and microarray image align-ment. All probes are synthesized in situ on the NimbleGen microarray surface using the 4 × 72 K microarray layout, meaning that there are four independent microarrays per each NimbleGen glass chip and each microarray contains up to 72 K probes. Final results of the microarray design are summarized in Table 3. Complete microarray design information and experiment data were deposited into the NCBI gene expression omnibus (GEO) database with the Series Access Number GSE61738, which is a super series combining both microarray series for MG1655 and C58.
Although NimbleGen has exited the custom microar-ray manufacturing business, the tiling microarmicroar-rays can still be manufactured by other manufacturers given the original microarray design information. Naturally, some array-specific protocols such as labeling and image quan-tification may need to be modified accordingly if different microarray platforms are used.
Results and discussion Microarray validations Experiment protocol
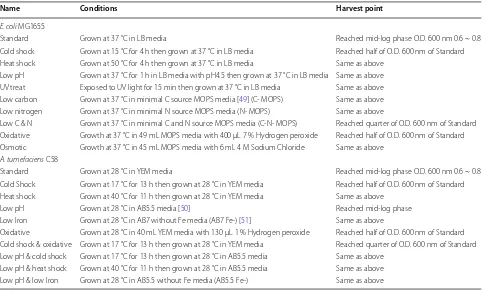
E. coli MG1655 and A. tumefaciens C58 cells were grown under 10 different treatments listed in Table 4 (1 stand-ard and 9 stressed conditions). The significantly varied growth conditions help induce large-scale gene expres-sion changes that ideally should cover most of the tran-scriptome landscape of the two species. Cells were harvested after treatment at the harvest point given in Table 4.
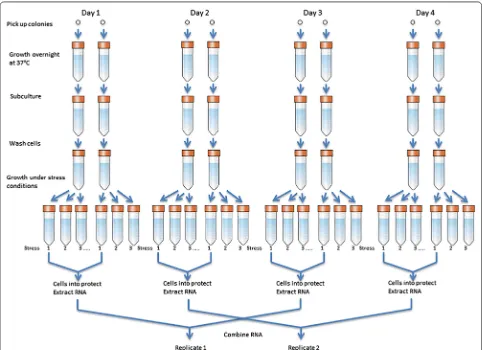
To control noise and bias, samples were pooled, rand-omized, blocked and replicated. We treated each micro-array as a statistical ‘block’ and randomly placed samples onto microarrays to balance variances from batch pro-cesses and positional effects [30]. Two biological rep-licates were produced for each bacterium under each treatment condition. The biological replicates were pre-pared by pooling samples according Fig. 1; each biologi-cal replicate eventually was made from 4 different cell cultures grown at 2 different days [31].
Two biological replicates were performed for each spe-cies under each treatment condition. The Qiagen RNe-asy Mini Kit (#74104) was used to purify total RNA after on-column DNase digestion to remove DNA contamina-tions (#79254). The total RNA were revere-transcribed to cDNA using Life Technologies Superscript double stranded cDNA synthesis kit (#11917-020) with a ran-dom primer set (#48190-011). Residue RNA were then removed using RNase H (NEB #M0297). The cDNA sam-ples were labeled using the NimbleGen One-Color Labe-ling Kit (#06370411001) and quantified using a Nanodrop ND-1000 spectrophotometer.
Microarray hybridizations were carried out on a Nim-blemGen Hybridization Workstation 4 (#05223652001) after dissolving labeled cDNA samples in the Hybridi-zation Kit (#05583683001) with appropriate Sample Tracking Controls added (#05223512001). After the manufacturer recommended overnight hybridization (about 16 h), microarrays were washed with the Nimble-Gen Wash Buffer Kit (#05584507001) and scanned using a GenePix 4100A Microarray Scanner at the maximum resolution of 5 µm for the Cy3 channel.
Scanned microarray images, which contained 4 micro-arrays on each chip, were processed using the Nim-bleGen DEVA 1.2.1 software [32]. The DEVA software aligned and anchored the microarray images using spe-cial alignment probes on the microarray surface and then split the images into 4 subarrays for the 4 × 72 K Nimble-Gen layout before quantifying them into individual probe values. Although manual alignments can be performed, we found it unnecessary for all the microarray images processed. The DEVA software also provided automatic RMA normalizations (robust multi-array analysis) across each set of microarray data for MG1655 and C58 to
Table 3 Results of tiling microarray design
MG1655 C58
[image:4.595.305.540.642.724.2]reduce outliers and make data comparisons more mean-ingful. Two microarray samples were removed from the final data sets due to large bubbles on the microarray sur-face. In all, 38 microarray samples (18 for MG1655 and 20 for C58) were used for the following validation analy-ses. The data can be obtained from NCBI GEO database using the Super Series Access Number GSE61738.
Probe level consistency validations
For each strain and treatment condition that has two successful biological replicates, we calculated Spear-man’s correlation and concordance correlation coeffi-cient (CCC) between them to validate the consistency of the microarrays under biological replicates. Spearman’s correlation was used to measure the reproducibility of two replicates [33]. Concordance correlation coefficient (CCC) provided a better indicator of the accuracy and precision of agreement between two biological replicates [34]. Biological replicates are more variable than techni-cal replicates because the two biologitechni-cal samples were independently grown, harvested and subjected to micro-array protocols, thus correlation between biological rep-licates can be as low as 30 % [35].
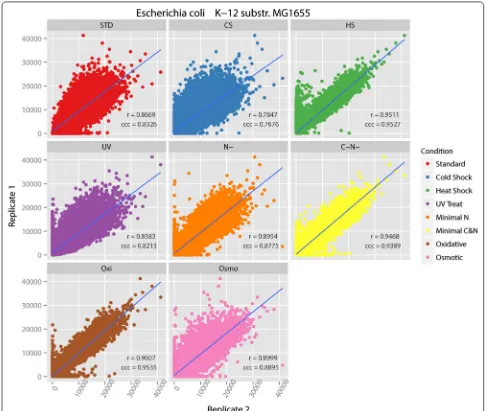
Scatterplots for each pair of replicates with regression line and correlation coefficients are shown in Fig. 2 for E. coli MG1655. Both statistical tests were performed with
95 % confidential level. The oxidative condition shows the highest correlation values. The cold shock condition has the lowest correlation values, but its Spearman’s cor-relation value 0.7847 and CCC value 0.7676 still indicate high correlations between the replicates. Therefore, we conclude that the biological replicates of E. coli MG1655 under all treatment conditions are consistent enough to indicate that the MG1655 tiling microarray is reliable and reproducible at the individual probe level.
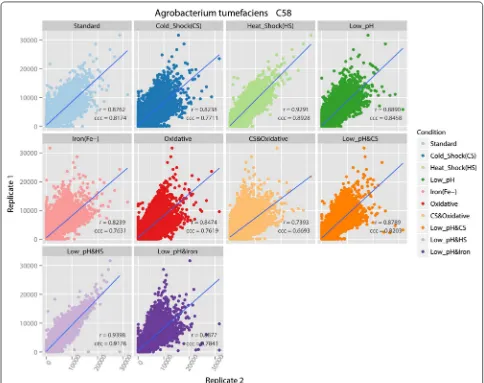
Scatterplots for each pair of biological replicates with regression line and correlation coefficients for A. tume-faciens C58 are similarly shown in Fig. 3. They show that the two biological replicates under each treatment con-dition are consistent with each other with a high corre-lation value at the 95 % confident level. The low pH and heat shock condition produced the highest correlation value of 0.9398. The cold shock and oxidative condition produced a lower correlation value of 0.7393, which is still high enough to conclude the replicates are highly related. Therefore, we also conclude that the C58 tiling microarray is also reliable at the probe level.
Gene level consistency validations
Significant analysis of microarray (SAM) [36, 37] and one-way ANOVA [38] were conducted to detect dif-ferentially expressed genes in E. coli MG1655 and A.
Table 4 Growth conditions of MG1655 and C58
Name Conditions Harvest point
E. coli MG1655
Standard Grown at 37 °C in LB media Reached mid‑log phase O.D. 600 nm 0.6 ~ 0.8 Cold shock Grown at 15 °C for 4 h then grown at 37 °C in LB media Reached half of O.D. 600 nm of Standard Heat shock Grown at 50 °C for 4 h then grown at 37 °C in LB media Same as above
Low pH Grown at 37 °C for 1 h in LB media with pH4.5 then grown at 37 °C in LB media Same as above UV treat Exposed to UV light for 15 min then grown at 37 °C in LB media Same as above Low carbon Grown at 37 °C in minimal C source MOPS media [49] (C‑ MOPS) Same as above Low nitrogen Grown at 37 °C in minimal N source MOPS media (N‑ MOPS) Same as above
Low C & N Grown at 37 °C in minimal C and N source MOPS media (C‑N‑ MOPS) Reached quarter of O.D. 600 nm of Standard Oxidative Growth at 37 °C in 49 mL MOPS media with 400 μL 7 % Hydrogen peroxide Reached half of O.D. 600 nm of Standard Osmotic Growth at 37 °C in 45 mL MOPS media with 6 mL 4 M Sodium Chloride Same as above
A. tumefaciens C58
Standard Grown at 28 °C in YEM media Reached mid‑log phase O.D. 600 nm 0.6 ~ 0.8 Cold Shock Grown at 17 °C for 13 h then grown at 28 °C in YEM media Reached half of O.D. 600 nm of Standard Heat shock Grown at 40 °C for 11 h then grown at 28 °C in YEM media Same as above
Low pH Grown at 28 °C in AB5.5 media [50] Reached mid‑log phase Low Iron Grown at 28 °C in AB7 without Fe media (AB7 Fe‑) [51] Same as above
Oxidative Grown at 28 °C in 40 mL YEM media with 130 μL 1 % Hydrogen peroxide Reached half of O.D. 600 nm of Standard Cold shock & oxidative Grown at 17 °C for 13 h then grown at 28 °C in YEM media Reached quarter of O.D. 600 nm of Standard Low pH & cold shock Grown at 17 °C for 13 h then grown at 28 °C in AB5.5 media Same as above
[image:5.595.57.544.100.393.2]tumefaciens C58 under the 10 treatment conditions. As stated earlier, most of the conditions are stress condi-tions that can promote stress gene responses. The two statistical analyses were performed to validate that the tiling microarrays can detect biologically significant gene expression changes. SAM detects differentially expressed genes across all 10 conditions for each bacterium. One-way ANOVA tests were performed for a few sets of probes targeting some known stress related genes to con-firm that their means differ across the 10 conditions for each bacterium, which also identifies the stress responses of cells.
SAM was performed with unpaired two class (control and treatment), delta value of 0.06 and fold change of 2. It found 34 differentially expressed genes in E. coli MG1655, including 22 known stress response genes such as dnaX [39], entF [40], groL [41], and copA [42, 43]. For A. tumefaciens C58, SAM was ran with unpaired two class
(control and treatment), delta of 0.065 and fold change of 3 to limit the number of differentially expressed genes reported. It detected 46 differentially expressed genes, including 16 known stress genes such as livJ [44], dadA [45], and rpoH [46]. The one-way ANOVA tests were performed with small subsets of known stress response genes at the 95 % confidential level. Stress response genes detected by SAM and/or confirmed by one-way ANOVA test are summarized in Table 5.
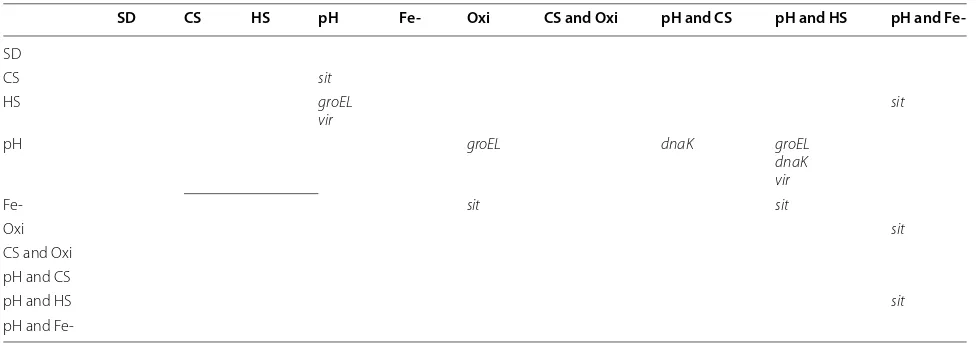
After ANOVA tests, multiple pairwise comparison tests (Tukey HSD [38] and Dunnett’s test [37]) were con-ducted at 95 % confident level as post hoc tests to find out which pairs of treatment conditions have distinc-tive stress gene expression differences. Differentially expressed stress genes tested and detected for each pair of conditions are listed in Table 6 for E. coli MG1655 and Table 7 for A. tumefaciens C58. All differentially expressed stress genes confirmed by ANOVA were also
[image:6.595.57.539.87.437.2]found by the post hoc tests except the ‘fepC’ gene in A. tumefaciens C58. The p value of fepC from ANOVA is 0.00207 but Tukey HSD or Dunnett’s test cannot identify it as differentially expressed in all pairs of conditions. It may be inferred that the means for this gene in all condi-tions are different from each other and there is no pair of conditions that is significantly different to allow detection by the post hoc tests.
It is worth noting that SAM generally detected more differentially expressed stress response genes than ANOVA can confirm. For example, the heat shock response gene hslO was detected by SAM even though ANVOA was not able to confirm that its means are sig-nificantly different among the treatment conditions for E. coli MG1655. More interestingly, many stressful
conditions triggered uvrA gene expressions, which is the SOS response gene in E. coli MG1655. For A. tumefaciens C58, stress response genes are induced more by com-bined treatment conditions. For example, many stress response genes are differentially expressed not just by heat shock but by heat shock and low pH combined. We can conclude that the tiling microarrays detected sensible gene expression changes that conform to our expectation with regard to known cell stress response gene behaviors in the two tested bacteria.
Novel transcript discoveries
One of the stated benefits of a tiling microarray is that it can detect unexpected expressions as well as annotated gene expressions. Indeed, the two tiling microarrays for
[image:7.595.55.541.87.498.2]E. coli MG1655 and A. tumefaciens C58 detected signifi-cant numbers of RNA expressions from non-gene-cod-ing regions on the two genomes. For example, our tilnon-gene-cod-ing microarray detected all 65 non-coding regulatory RNAs (ncRNAs) annotated in GenBank report U00096.3 for E. coli MG1655. Among the 65 ncRNAs, dicF is computa-tionally predicted to target the hslV gene according to the bacterial small regulatory RNA database (BSRD) [47]. Since our tiling microarray covers both the dicF ncRNA and its target gene, we can calculate the correlation value between them is −0.4819401, which agrees with the pre-dictions. Because the whole genome is monitored, when there are new predictions of such regulatory activities, the correlation values can be extracted from our tiling microarray data without having to design new experi-ments to validate the predictions. We have seen many such evidences of ncRNA and target gene correlations,
but it will require more analysis and maybe some inde-pendent validation experiments to report their biological functions. It suffices to say here that the two tiling micro-arrays do allow novel transcript discoveries as we have anticipated.
Conclusions
In this work we have described the design strategies and validation experiments of two whole-genome til-ing microarrays for E. coli MG1655 and A. tumefaciens C58 bacteria. The tiling microarrays are thermodynami-cally optimal for the two genomes based on the rigorous calculations conducted by the PICKY software [17]. This means that all probes selected have maximum specific-ity toward their target genome regions and no additional probes can be added to the microarrays without jeopard-izing its specificity under the given design constraints. In
[image:8.595.56.540.87.470.2]average, there is a unique microarray probe every 100 bp along the genomes to uniquely detect any transcripts coming from that region. Therefore, transcripts longer than 100 bp are likely to be detected by at least one til-ing microarray probe. The 100 bp selection window can be adjusted upward or downward depending on the
microarray probe count and user preferences, but we do not expect the selected probes to increase significantly when this window is reduced because most thermody-namically optimal probes, if not all, should have been found by PICKY at the current 100 bp window size given the ~40 bp non-overlapping probe length.
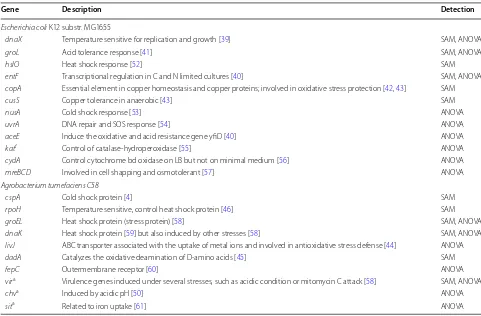
Table 5 Detected stress response genes in MG1655 and C58
a Means gene families
Gene Description Detection
Escherichia coli K12 substr. MG1655
dnaX Temperature sensitive for replication and growth [39] SAM, ANOVA
groL Acid tolerance response [41] SAM, ANOVA
hslO Heat shock response [52] SAM
entF Transcriptional regulation in C and N limited cultures [40] SAM, ANOVA
copA Essential element in copper homeostasis and copper proteins; involved in oxidative stress protection [42, 43] SAM
cusS Copper tolerance in anaerobic [43] SAM
nusA Cold shock response [53] ANOVA
uvrA DNA repair and SOS response [54] ANOVA
aceE Induce the oxidative and acid resistance gene yfiD [40] ANOVA
katf Control of catalase‑hydroperoxidase [55] ANOVA cydA Control cytochrome bd oxidase on LB but not on minimal medium [56] ANOVA
mreBCD Involved in cell shapping and osmotolerant [57] ANOVA
Agrobacterium tumefaciens C58
cspA Cold shock protein [4] SAM
rpoH Temperature sensitive, control heat shock protein [46] SAM
groEL Heat shock protein (stress protein) [58] SAM, ANOVA
dnaK Heat shock protein [59] but also induced by other stresses [58] SAM, ANOVA
livJ ABC transporter associated with the uptake of metal ions and involved in antioxidative stress defense [44] ANOVA
dadA Catalyzes the oxidative deamination of D‑amino acids [45] SAM
fepC Outermembrane receptor [60] ANOVA
vira Virulence genes induced under several stresses, such as acidic condition or mitomycin C attack [58] SAM, ANOVA
chva Induced by acidic pH [50] ANOVA
sita Related to iron uptake [61] ANOVA
Table 6 Differentially expressed stress genes in each pair of conditions for MG1655
SD CS HS pH UV C- N- C-N- Oxi Osmo
SD uvrA entF
CS groL
nusA aceE gadC
uvrA uvrA uvrA
cydA dnaXuvrA kat
HS livJ
pH cydA cydA cydA mreBCD
[image:9.595.56.537.99.415.2] [image:9.595.56.540.462.633.2]The tiling microarray probes can detect transcripts expressed from both strands of the genomes because most of the common cDNA conversion and labeling pro-tocols automatically produced double-stranded DNAs from original RNA transcripts. Given gene annotation information and bioinformatic techniques such as gene predictions, determining the actual strand of expression is not difficult for most genes [48]. One can also use some other methods such as RT-PCR to confirm the expressing strand for a few difficult transcripts.
We believe tiling microarrays are useful for many gene expression studies, especially for novel and non-model species that have not been annotated yet. Actually, til-ing microarrays can help identify novel gene expressions and facilitate the annotation of novel species. Microar-rays tend to produce data much faster (in just 2 days), can tolerate a few mismatched bases due to polymorphisms or sequencing errors, tend not to be overwhelmed by excessive bacterial rRNAs as RNA-Seq does, and does not usually require sophisticated computing capacity to interpret the data. The software used in this study and the data produced by the experiments are freely available to other researchers who may wish to design their tiling microarrays.
Additional files
Additional file 1. Picky analysis results for a previously designed tiling microarray. The tiling microarray created by Yu, et al. [21] was designed using a pipeline [22] that depends on BLAST for sequence‑level probe specificity screening. This compressed ZIP archive contains the summary (W83.report) and detail analysis (W83.picky) produced by Picky for this microarray.
Additional file 2. Assembled genome sequences for E. coli MG1655 and
Agrobacterium tumefaciens C58. Two FASTA files containing the assembled genomic sequences are provided in this compressed ZIP archive.
Abbreviations
NGS: next‑generation sequencing; E. coli: Escherichia coli; A. tumefaciens:
Agrobacterium tumefaciens; GEO: gene expression omnibus; RMA: robust multi‑array analysis; CCC: concordance correlation coefficient; SAM: significant analysis of microarray; BSRD: bacterial small regulatory RNA database.
Authors’ contributions
HJC prepared, sequenced and assembled the two bacteria genomes and used that information to design the tiling microarrays. HJC also performed all experiments including bacteria maintenance, treatment, sample collection, purification, microarray hybridization, image quantification and statistical analysis. HHC conceived of this work, developed the Picky software for microar‑ ray design, and drafted the manuscript. All authors read and approved the final manuscript.
Author details
1 Department of Genetics, Development and Cell Biology, Iowa State Uni‑
versity, Ames, IA 50011, USA. 2 Department of Computer Science, Iowa State
University, Ames, IA 50011, USA.
Acknowledgements
The authors would like to thank Dr. Kan Wang and Dr. Gwyn A. Beattie for their valuable advices to this work. We also thank Dr. Kan Wang and Dr. Keunsub Lee for providing the A. tumefaciens C58 strain and teaching us how to main‑ tain this bacteria. We thank our colleagues Taryn Anderson and Matthew Hunt for their help in bacteria maintenance and RNA extraction, and Jennifer Chang for discussion about statistical methods.
Availability of data and material
The sequencing datasets supporting the conclusions of this article are avail‑ able in the (NCBI Sequence Read Archive) repository, (Accession numbers are SRX806374 and SRX806654 and hyperlink to datasets in http://www.ncbi. nlm.nih.gov/sra/SRX806374[accn] and http://www.ncbi.nlm.nih.gov/sra/ SRX806654[accn]).
The datasets supporting the conclusions of this article are included within the article and its additional files.
Competing interests
The authors declare that they have no competing interests.
Funding
This work is supported by the National Science Foundation grant DBI‑0850195 to HHC, and the publication of this manuscript is supported by the Iowa State University Plant Sciences Institute Scholar Award to HHC. Neither funding agency plays any role in the design, collection, analysis and interpretation of Table 7 Differentially expressed stress genes in each pair of conditions for C58
SD CS HS pH Fe- Oxi CS and Oxi pH and CS pH and HS pH
and Fe-SD
CS sit
HS groEL
vir
sit
pH groEL dnaK groEL
dnaK vir
Fe‑ sit sit
Oxi sit
CS and Oxi pH and CS
pH and HS sit
[image:10.595.55.543.100.273.2]the data, in the writing of the manuscript, and in the decision to submit the manuscript for publication.
Received: 29 May 2016 Accepted: 1 June 2016
References
1. Zhao S, Fung‑Leung W‑P, Bittner A, Ngo K, Liu X. Comparison of RNA‑Seq and microarray in transcriptome profiling of activated T Cells. PLoS One. 2014;9:e78644.
2. Albert TJ, Molla MN, Muzny DM, Nazareth L, Wheeler D, Song X, Rich‑ mond TA, Middle CM, Rodesch MJ, Packard CJ, Weinstock GM, Gibbs RA. Direct selection of human genomic loci by microarray hybridization. Nat Methods. 2007;4:903–5.
3. NimbleGen. http://www.nimblegene.com. Accessed 13 Mar 2013. 4. Lee K, Huang X, Yang C, Lee D, Ho V, Nobuta K, Fan J‑B, Wang K. A
genome‑wide survey of highly expressed non‑coding RNAs and biologi‑ cal validation of selected candidates in Agrobacterium tumefaciens. PLoS One. 2013;8:e70720.
5. Huang H‑Y, Chang H‑Y, Chou C‑H, Tseng C‑P, Ho S‑Y, Yang C‑D, Ju Y‑W, Huang H‑D. sRNAMap: genomic maps for small non‑coding RNAs, their regulators and their targets in microbial genomes. Nucleic Acids Res. 2009;37:D150–4 (Database issue).
6. Gottesman S. Micros for microbes: non‑coding regulatory RNAs in bacte‑ ria. Trends Genet. 2005;21:399–404.
7. Seo YS, Sriariyanun M, Wang L, Pfeiff J, Phetsom J, Lin Y, Jung KH, Chou HH, Bogdanove A, Ronald P. A two‑genome microarray for the rice patho‑ gens Xanthomonas oryzae pv. oryzae and X. oryzae pv. oryzicola and its use in the discovery of a difference in their regulation of hrp genes. BMC Microbiol. 2008;8:99.
8. Jung KH, Dardick C, Bartley LE, Cao P, Phetsom J, Canlas P, Seo YS, Shultz M, Ouyang S, Yuan Q, Frank BC, Ly E, Zheng L, Jia Y, Hsia AP, An K, Chou HH, Rocke D, Lee GC, Schnable PS, An G, Buell CR, Ronald PC. Refinement of light‑responsive transcript lists using rice oligonucleotide arrays: evalu‑ ation of gene‑redundancy. PLoS One. 2008;3:e3337.
9. Chou HH, Hsia AP, Mooney DL, Schnable PS. Picky: oligo microarray design for large genomes. Bioinformatics. 2004;20:2893–902. 10. SantaLucia JJ, Allawi HT, Seneviratne PA. Improved nearest‑neighbor
parameters for predicting DNA duplex stability. Biochemistry. 1996;35:3555–62.
11. Allawi HT, SantaLucia JJ. Thermodynamics and NMR of internal G*T mismatches in DNA. Biochemistry. 1997;36:10581–94.
12. Allawi HT, SantaLucia JJ. Thermodynamics of internal C*T mismatches in DNA. Nucleic Acids Res. 1998;26:2694–701.
13. Allawi HT, SantaLucia JJ. Nearest‑neighbor thermodynamics of internal A*C mismatches in DNA: sequence dependence and pH effects. Bio‑ chemistry. 1998;37:9435–44.
14. Allawi HT, SantaLucia JJ. Nearest neighbor thermodynamic parameters for internal G*A mismatches in DNA. Biochemistry. 1998;37:2170–9. 15. SantaLucia J. A unified view of polymer, dumbbell, and oligonucleo‑
tide DNA nearest‑neighbor thermodynamics. Proc Natl Acad Sci USA. 1998;95:1460–5.
16. Bommarito S, Peyret N. John SantaLucia J: Thermodynamic param‑ eters for DNA sequences with dangling ends. Nucleic Acids Res. 2000;28:1929–34.
17. Chou HH, Trisiriroj A, Park S, Hsing YI, Ronald PC, Schnable PS. Direct calibration of PICKY‑designed microarrays. BMC Bioinform. 2009;10:347. 18. Altschul SF, Gish W, Miller W, Myers EW, Lipman DJ. Basic local alignment
search tool. J Mol Biol. 1990;215:403–10.
19. Kane MD, Jatkoe TA, Stumpf CR, Lu J, Thomas JD, Madore SJ. Assessment of the sensitivity and specificity of oligonucleotide (50mer) microarrays. Nucleic Acids Res. 2000;28:4552–7.
20. Liebich J, Schadt CW, Chong SC, He Z, Rhee S‑K, Zhou J. Improvement of oligonucleotide probe design criteria for functional gene microarrays in environmental applications. Appl Environ Microbiol. 2006;72:1688–91. 21. Yu W‑H, Høvik H, Olsen I, Chen T. Strand‑specific transcriptome profiling
with directly labeled RNA on genomic tiling microarrays. BMC Mol Biol. 2011;12:3.
22. Høvik H, Chen T. Dynamic probe selection for studying microbial tran‑ scriptome with high‑density genomic tiling microarrays. BMC Bioinform. 2010;11:82.
23. Coli Genetic Stock Center. http://cgsc.biology.yale.edu. Accessed 11 Jul 2010.
24. Plant Transformation Facility. http://agron‑www.agron.iastate.edu/ptf/ employee/director.aspx. Accessed 27 Jun 2012.
25. Zerbino DR, Birney E. Velvet: algorithms for de novo short read assembly using de Bruijn graphs. Genome Res. 2008;18:821–9.
26. Amos Consortium. http://amos.sourceforge.net/wiki/index.php/AMOS. Accessed 20 Apr 2014.
27. Blattner FR, Plunkett G III, Bloch CA, Perna NT, Burland V, Riley M, Collado‑ Vides J, Glasner JD, Rode CK, Mayhew GF, Gregor J, Davis NW, Kirkpat‑ rick HA, Goeden MA, Rose DJ, Mau B, Shao Y. The complete genome sequence of Escherichia coli K‑12. Science. 1997;277:1453–62. 28. Chou HH. Shared probe design and existing microarray reanalysis using
PICKY. BMC Bioinform. 2010;11:196.
29. Technical note Roche NimbleGen probe design fundamentals. https://roche‑biochem.jp/products/pdf/custom_design/probe_ design_2008_06_04.pdf. Accessed 15 Jun 2013.
30. Hsu JC, Chang J, Wang T, Steingrímsson E, Magnússon MK, Bergsteinsdot‑ tir K. Statistically designing microarrays and microarray experiments to enhance sensitivity and specificity. Brief Bioinform. 2007;8:22–31. 31. Yu X, Lund SP, Scott RA, Greenwald JW, Records AH, Nettleton D, Lindow
SE, Gross DC, Beattie GA. Transcriptional responses of Pseudomonas syrin‑ gae to growth in epiphytic versus apoplastic leaf sites. Proc Natl Acad Sci USA 2013;110:E425–34
32. Roche NimbleGen|DNA microarray support. http://www.nimblegen. com/support/dna‑microarray‑support.html. Accessed 17 Aug 2014. 33. Kim BS, Rha SY, Cho GB, Chung HC. Spearman’s footrule as a measure of
cDNA microarray reproducibility. Genomics. 2004;84:441–8.
34. Miron M, Woody OZ, Marcil A, Murie C, Sladek R, Nadon R. A methodol‑ ogy for global validation of microarray experiments. BMC Bioinform. 2006;7:333.
35. Churchill GA. Fundamentals of experimental design for cDNA microar‑ rays. Nat Genet. 2002;32(Suppl):490–5.
36. Zhang S. A comprehensive evaluation of SAM, the SAM R‑package and a simple modification to improve its performance. BMC Bioinform. 2007;8:230.
37. Lin D, Shkedy Z, Burzykowski T, Ion R, Göhlmann HWH, De Bondt A, Perer T, Geerts T, Van den Wyngaert I, Bijnens L. An investigation on perfor‑ mance of significance analysis of microarray (SAM) for the comparisons of several treatments with one control in the presence of small‑variance genes. Biom J. 2008;50:801–23.
38. Hulshizer R, Blalock EM. Post hoc pattern matching: assigning significance to statistically defined expression patterns in single channel microarray data. BMC Bioinform. 2007;8:240.
39. Blinkova A, Hermandson MJ, Walker JR. Suppression of temper‑ ature‑sensitive chromosome replication of an Escherichia coli
dnaX(Ts) mutant by reduction of initiation efficiency. J Bacteriol. 2003;185:3583–95.
40. Kumar R, Shimizu K. Transcriptional regulation of main metabolic pathways of cyoA, cydB, fnr, and fur gene knockout Escherichia coli in C‑limited and N‑limited aerobic continuous cultures. Microb Cell Fact. 2011;10:3.
41. King T, Lucchini S, Hinton JCD, Gobius K. Transcriptomic analysis of
Escherichia coli O157:H7 and K‑12 cultures exposed to inorganic and organic acids in stationary phase reveals acidulant‑ and strain‑specific acid tolerance responses. Appl Environ Microbiol. 2010;76:6514–28. 42. Rensing C, Grass G. Escherichia coli mechanisms of copper homeostasis
in a changing environment. FEMS Microbiol Rev. 2003;27:197–213. 43. Outten FW, Huffman DL, Hale JA, O’Halloran TV. The independent cue
and cus systems confer copper tolerance during aerobic and anaerobic growth in Escherichia coli. J Biol Chem. 2001;276:30670–7.
44. Garmory HS, Titball RW. ATP‑binding cassette transporters are targets for the development of antibacterial vaccines and therapies. Infect Immun. 2004;72:6757–63.
• We accept pre-submission inquiries
• Our selector tool helps you to find the most relevant journal
• We provide round the clock customer support • Convenient online submission
• Thorough peer review
• Inclusion in PubMed and all major indexing services
• Maximum visibility for your research
Submit your manuscript at www.biomedcentral.com/submit
Submit your next manuscript to BioMed Central
and we will help you at every step:
46. Rosen R, Büttner K, Becher D, Nakahigashi K, Yura T, Hecker M, Ron EZ. Heat shock proteome of Agrobacterium tumefaciens: evidence for new control systems. J Bacteriol. 2002;184:1772–8.
47. Li L, Huang D, Cheung MK, Nong W, Huang Q, Kwan HS. BSRD: a reposi‑ tory for bacterial small regulatory RNA. Nucleic Acids Res. 2013;41:D233–8
(Database issue).
48. Mockler TC, Chan S, Sundaresan A, Chen H, Jacobsen SE, Ecker JR. Applications of DNA tiling arrays for whole‑genome analysis. Genomics. 2005;85:1–15.
49. Neidhardt FC, Bloch PL, Smith DF. Culture medium for enterobacteria. J Bacteriol. 1974;119:736–47.
50. Yuan Z‑C, Liu P, Saenkham P, Kerr K, Nester EW. Transcriptome profiling and functional analysis of Agrobacterium tumefaciens reveals a general conserved response to acidic conditions (pH 5.5) and a complex acid‑ mediated signaling involved in agrobacterium‑plant interactions. J Bacteriol. 2008;190:494–507.
51. Bhubhanil S, Niamyim P, Sukchawalit R, Mongkolsuk S. Cysteine desulphurase‑encoding gene sufS2 is required for the repressor function of RirA and oxidative resistance in Agrobacterium tumefaciens. Microbiol‑ ogy. 2014;160(Pt 1):79–90.
52. Chuang SE, Blattner FR. Characterization of twenty‑six new heat shock genes of Escherichia coli. J Bacteriol. 1993;175:5242–52.
53. Yamanaka K. Cold shock response in Escherichia coli. J Mol Microbiol Biotechnol. 1999;1:193–202.
54. Michel B. After 30 years of study, the bacterial SOS response still surprises us. PLoS Biol. 2005;3:e255.
55. Papp‑Szabò E, Sutherland CL, Josephy PD. Superoxide dismutase and the resistance of Escherichia coli to phagocytic killing by human neutrophils. Infect Immun. 1993;61:1442–6.
56. Strauss B, Kelly K, Ekiert D. Cytochrome oxidase deficiency protects
Escherichia coli from cell death but not from filamentation due to thymine deficiency or DNA polymerase inactivation. J Bacteriol. 2005;187:2827–35.
57. Winkler JD, Garcia C, Olson M, Callaway E, Kao KC. Evolved osmotolerant
Escherichia coli mutants frequently exhibit defective N‑acetylglucosamine catabolism and point mutations in cell shape‑regulating protein MreB. Appl Environ Microbiol. 2014;80:3729–40.
58. Rosen R, Büttner K, Schmid R, Hecker M, Ron EZ. Stress‑induced proteins of Agrobacterium tumefaciens. FEMS Microbiol Ecol. 2001;35:277–85. 59. Segal G, Ron EZ. The dnaKJ operon of Agrobacterium tumefaciens:
transcriptional analysis and evidence for a new heat shock promoter. J Bacteriol. 1995;177:5952–8.
60. Hungria M, Nicolás MF, Guimarães CT, Jardim SN, Gomes EA, de Vascon‑ celos ATR. Tolerance to stress and environmental adaptability of Chromo-bacterium violaceum. Genet Mol Res GMR. 2004;3:102–16.