applied to complex diffusion in mica supported
lipid bilayers
Matysik and Kraut
T E C H N I C A L N O T E
Open Access
TrackArt: the user friendly interface for single
molecule tracking data analysis and simulation
applied to complex diffusion in mica supported
lipid bilayers
Artur Matysik and Rachel S Kraut
*Abstract
Background:Single molecule tracking (SMT) analysis of fluorescently tagged lipid and protein probes is an attractive alternative to ensemble averaged methods such as fluorescence correlation spectroscopy (FCS) or fluorescence recovery after photobleaching (FRAP) for measuring diffusion in artificial and plasma membranes. The meaningful estimation of diffusion coefficients and their errors is however not straightforward, and is heavily dependent on sample type, acquisition method, and equipment used. Many approaches require advanced computing and programming skills for their implementation.
Findings:Here we present TrackArt software, an accessible graphic interface for simulation and complex analysis of multiple particle paths. Imported trajectories can be filtered to eliminate spurious or corrupted tracks, and are then analyzed using several previously described methodologies, to yield single or multiple diffusion coefficients, their population fractions, and estimated errors. We use TrackArt to analyze the single-molecule diffusion behavior of a sphingolipid analog SM-Atto647N, in mica supported DOPC (1,2-dioleoyl-sn-glycero-3-phosphocholine) bilayers. Fitting with a two-component diffusion model confirms the existence of two separate populations of diffusing particles in these bilayers on mica. As a demonstration of the TrackArt workflow, we characterize and discuss the effective activation energies required to increase the diffusion rates of these populations, obtained from Arrhenius plots of temperature-dependent diffusion. Finally, TrackArt provides a simulation module, allowing the user to generate models with multiple particle trajectories, diffusing with different characteristics. Maps of domains, acting as impermeable or permeable obstacles for particles diffusing with given rate constants and diffusion coefficients, can be simulated or imported from an image. Importantly, this allows one to use simulated data with a known diffusion behavior as a comparison for results acquired using particular algorithms on actual,“natural”samples whose diffusion behavior is to be extracted. It can also serve as a tool for demonstrating diffusion principles.
Conclusions:TrackArt is an open source, platform-independent, Matlab-based graphical user interface, and is easy to use even for those unfamiliar with the Matlab programming environment. TrackArt can be used for accurate simulation and analysis of complex diffusion data, such as diffusion in lipid bilayers, providing publication-quality formatted results.
Keywords:Fluorescence, Single molecule tracking, Diffusion, Lipid bilayers, Total internal reflection, Microscopy, Mica, MSD
* Correspondence:[email protected]
School of Biological Sciences, Nanyang Technological University, 60 Nanyang Drive, Singapore 637551, Singapore
© 2014 Matysik and Kraut; licensee BioMed Central Ltd. This is an Open Access article distributed under the terms of the Creative Commons Attribution License (http://creativecommons.org/licenses/by/2.0), which permits unrestricted use, distribution, and reproduction in any medium, provided the original work is properly credited. The Creative Commons Public Domain Dedication waiver (http://creativecommons.org/publicdomain/zero/1.0/) applies to the data made available in this article, unless otherwise stated.
Findings Background
Studies on membrane dynamics using lipid- or protein-based probes specific for different membrane regions or local environments, such as domains of ordered lipids enriched in cholesterol and sphingolipids, provide deep insight into the organization of both plasma membranes and artificial lipid bilayers [1-8].
Ensemble averaging methods such as FCS or FRAP are effective for accurately determining diffusion over large data sets consisting of mobile particles. Although multiple component diffusion can be quantified using these methods, they provide limited ability to visualize single particle behaviors, such as switching between fast and slow diffusion, or confined diffusion [9,10]. Single molecule tracking (SMT) is a complementary technique that can analyze individual particle trajectories in detail, and thus is able to extract such information from re-cordings of diffusing particles.
For over 20 years, numerous authors have described ap-proaches for SMT data acquisition, analysis, extraction of diffusion coefficients, and uncertainty estimation [11-15]. For each experimental paradigm, several factors that may introduce bias into the data need to be considered. The sample type and preparation (i.e. live cell, artificial mem-brane, mica or glass support) and the microscope setup, including the detector type, lens characteristics, labeling strategy and filter quality, all affect the signal-to-noise ra-tio, a crucial parameter for sensitive particle recognition and linking of detected particles into trajectories with high accuracy [16]. Acquisition parameters such as frame rate, detector gain, binning, and light intensity should be opti-mized. For example, a too low frame rate will result in motion- blur of moving particles. On the other hand, a too high frame rate might lead to a low signal-to-noise ra-tio. High light intensity increases the signal-to-noise ratio, but also results in rapid bleaching, shortening particle life-times (and thus trajectories). Moreover, light exposure over too long a period of time may cause sample photo-damage i.e. by lipid oxidation, changing the diffusion char-acteristics of the sample [17]. Finally, acquired datasets must be analyzed with a view to the nature of the observed diffusion type. In both artificial and plasma membranes, dif-fusion is often more complex than simple Brownian diffu-sion in a homogenous medium, and anomalous or confined diffusion with multiple diffusing fractions are observed. This might be caused by membrane inhomogeneity, the ex-istence of domains or impermeable clusters to the label used, or even the presence of fluorescent contaminants [13,15,18]. SMT datasets are relatively large and require ini-tial filtering before further processing. Consequently, the final results of such analyses are extremely sensitive to the choice of proper fitting models and filtering parameters. Ideally, results on unknown data from real membranes
should be supported by adequate simulations in silico. Thus, a meaningful characterization of probe dynamics requires not only good datasets, but also strong pro-gramming skills for their analysis. To simplify the process of SMT data analysis, and thereby to make it more accessible to a wide range of researchers, we de-signed TrackArt as a graphic user interface (GUI) imple-menting commonly used methods for diffusion coefficient estimation from acquired SMT data, and data filtering, as well as various modes of diffusion simulation.
Here we present features of the TrackArt interface for analysis of single molecule tracking data, and apply the workflow to describe the dynamic behavior of a fluores-cently tagged sphingolipid analog, SM-Atto677N, on mica supported DOPC bilayers.
Implementation
The TrackArt software consists of five modules: SIM for diffusion simulations,IMPORTfor importing and filtering trajectories stored in an external file, MSD for classical MSD curve fitting, andCPDandFITmodules for resolv-ing theDs of multiple subpopulations within a data set.
Diffusion simulation
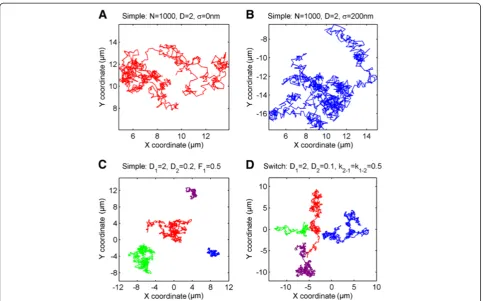
As a method of validating implemented tracking data algorithms, by challenging acquired data with simula-tion, as well as for teaching and illustrative purposes, a simulation module was developed and included in the TrackArt ensemble. Trajectories are simulated using the Monte Carlo algorithm, for any given number of trajector-ies and steps, with an optional simulation of localization error (Figure 1A,B). Three simulation modes are available:
Simple diffusion mode - each particle moves with constant D throughout its lifetime. Particles can be di-vided into two separate populations, each moving with a differentD(Figure 1C).
Switching mode -particles switch between two states, each one with a characteristic diffusion coefficients D1 and D2 with switch rates k1-2 and k2-1 (Figure 1D) ac-cording to an equilibrium:
D1⇄ k1−2
k2−1
D2 ð1Þ
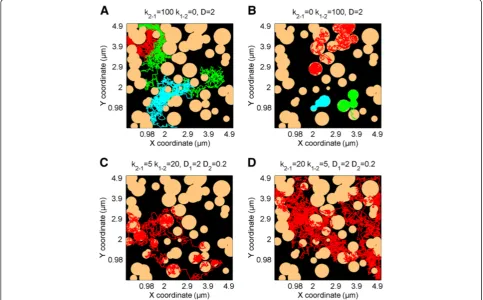
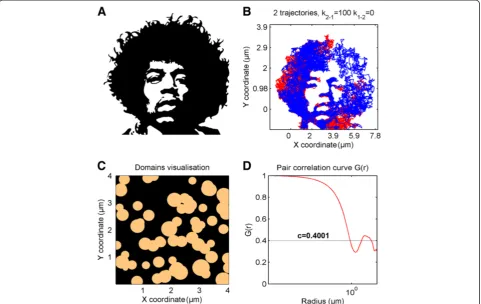
diffusion. Moreover, different diffusion coefficients can be defined for particles moving within or outside of domains. A very useful feature is that the domain map can also be imported from a binary image file, as shown in Figure 3A and 3B. This gives a user the option of running diffusion simulation on images derived from, e.g., atomic force micros-copy (AFM) or other maps of actual membrane‘landscapes’ where domains with different shapes and characteristics such as fractal dimensions, percolation, confined or hop diffusion, or grid-patterns occur. For each domain map (either simu-lated or imported), the pair correlation curve G(r) can also be calculated and plotted (Figure 3C,D). G(r) is the probabil-ity of finding a domain at distancerand allows more detailed domain map characterization [19,20].
Data import
The import module is used to import trajectories into TrackArt from a file, such as an ImageJ plugin: Particle Tracker [21] results, or coordinates exported previously from TrackArt Simulation module. Data from other track-ing software also can be imported after formatttrack-ing (see Additional file 1). Once imported, one can inspect quality of tracks, and filter out unwanted trajectories, including trajectories which are too short, not linked properly, or
[image:4.595.57.541.87.388.2]derived from contaminants or aggregates. Filtering of imported experimental data is essential for meaningful dif-fusion coefficient estimation thereafter. There are several possible factors contributing to further error: samples (or surface) contamination by other fluorescent contami-nants, probes forming aggregates, the existence of an im-mobile probe fraction (as can happen when probe sticks to a glass surface), spurious particle recognition (noise) or errors in linking coordinates into trajectories due to high particle concentration and/or fluorophore blinking. Al-though many of these factors can be minimized by careful surface cleaning procedures during sample preparation, the use of sensitive EMCCD cameras, high grade filters, ultra-pure lipids and solvents, and pre-bleaching of con-taminants with a strong laser pulse, several exclusion cri-teria should be used to dismiss trajectories which may be inaccurate. In TrackArt, the aforementioned criteria are ap-plied through various parameters: 1) a minimum number of frames required for each trajectory, 2) a minimum and max-imum diffusion coefficient value calculated for each trajec-tory, 3) a minimum R-squared value of the linear MSD fit for each trajectory, and 4) minimum and maximum average trajectory intensity. The optimal value for each parameter is specific for the measurement conditions, equipment used, Figure 1TrackArt SIM.Simulations inSimple and Switch mode.A-B. A single trajectory of a particle diffusing withD= 2μm2/s, with simulated localization uncertaintyσ= 0 nm andσ= 200 nm respectively.C.Simple modesimulation of four particles diffusing withD1= 2 andD2= 0.2μm
2 /s, fraction = 50%.D.Switch modesimulation of four particles diffusing withD1= 2 andD2= 0.2μm
2
/s. Constant rates for switch between states are equal to 0.5. For all simulations(A-D)N= 1000 steps per trajectory,Δt = 10 ms.
Matysik and KrautBMC Research Notes2014,7:274 Page 3 of 10
type of sample and fluorescent label. Thus, these must be determined empirically for each imaging setup. To aid in that process, TrackArt offers a wide variety of plots and data representations, such as histograms of individualD, trajectory length and intensity, MSD plots, and trajectory preview.
Mean square displacement fits
Analysis of the mean square displacement (MSD) curves is the most common approach for extracting the diffusion co-efficient, when only one population of particles with a single characteristic diffusion is observed. There are four models of possible MSD fits implemented in TrackArt, all of which assume particle movement in 2-dimensional space:
Normal (Brownian) diffusion –particles move in an isotropic medium with pure Brownian characteristics. The diffusion coefficient is extracted from the linear MSD fit:
<r2>¼aþbΔt; b¼4D ð2Þ
whereαis the intercept andtis time. The fit can be op-tionally weighted by the inverse of the MSD standard
deviation. In analyzing the MSD curve (and thus esti-mating and minimizing the error in D), it is important to take into account effects such as localization uncer-tainty, finite camera exposure and the effect of diffusion on the MSD curve. TrackArt simplifies this process by providing on output consisting of MSD standard devi-ation, parameter errors for weighted and unweighted fits, static and dynamic localization error, reduced localization error, error in D and finally the optimum number of time-lags to use for fitting (minimizing the aandberror). For these calculations, TrackArt imple-ments algorithms and methods described in detail by Michalet et al. [11,12].
Remaining MSD fitting models include selected models described by Saxton et al. [22]:
Anomalous diffusion (subdiffusion) - particles dif-fuse among immobile obstacles, which cause deviation from Brownian diffusion;
Free diffusion with flow - particles undergo direc-tional motion due to drift or active transport;
[image:5.595.56.540.91.391.2]Confined/corralled diffusion –MSD approaches a maximum value for large time-lags, due to limitation of diffusion to within a region of confinement.
Figure 2TrackArt SIM.Simulations inDomain mode. Simulations show particles behaving with different constant rates, on the same domain map.A-B. Trajectories of particles diffusing withD= 2μm2/s, withk
1-2= 0 (domains acting as obstacles) andk2-1= 0 (domains acting as region of
confined diffusion), respectively.C-D. Particles diffusing withD1= 2 andD2= 0.2μm2/s and constant rates(C)k2-1= 5,k1-2= 20 and(D)k2-1= 20,
Extraction of multiple diffusion coefficients
Analysis of MSD curves is extremely valuable for diffu-sion coefficient extraction. However the tracked mole-cules often exist as populations with different diffusion behaviors, e.g. a slow and a fast population, or a single population of particles that switch intermittently be-tween different states. Both situations can be effectively simulated in the TrackArt simulation module. When dealing with relatively large numbers of trajectories, in both cases the overall MSD fit will provide only the mean value ofD. Different methods of analyzing track-ing data can be used to disttrack-inguish between these frac-tions and extract their individualDs [15,18,23]. The one implemented in TrackArt was proposed by Schütz et al. [15] and was successfully used in several diffusion studies [13,24-27]. Briefly, MSDs for each population and their frac-tion are extracted as parameters from multi-exponential fits to cumulative probability distribution (CPD) of square dis-placements. In TrackArt, the CPD module is used for CPD calculation and fits, whereas the FIT module calculates final values ofD, the size of fractions diffusing with given Ds, and their errors. More detailed descriptions of each module and their algorithms can be found in Additional file 1 and user manual.
Results and discussion
Diffusion in a mica-supported DOPC bilayer
To show the capabilities and standard workflow of TrackArt we used single molecule data derived from diffu-sion of a head-labeled sphingolipid analog Sphingomyelin-Atto647N in a mica supported DOPC bilayer. We chose this probe because of its sphingolipid backbone, which might be expected to have a more complex behavior than commonly used DHPE probes.
[image:6.595.58.540.90.394.2]Image stacks were acquired using TIRF microscope setup, with 10 ms time resolution at 25°C. By visual inspec-tion, the existence of separate populations diffusing with different speeds is clearly evident. Moreover, switching be-tween these states was often observable. An example of such a trajectory is shown in Figure 4. The summed pro-jection (the sum of values for each pixel through the whole stack) with additional color coding was overlaid into a tra-jectory, to better visualize regions where the particle was residing for longer times (diffusing more slowly). To ensure that the particles remain in a confined region longer than particles undergoing normal Brownian diffusion would re-main, Analyzing Particle Movement (APM_GUI) software was used [28]. Some particles were observed to be immo-bile for the entirety of their lifetimes, which might be Figure 3TrackArt SIM. A. Binary image used for import as a domain map.B. Simulation of two particle trajectories moving withD= 2μm2/s,
k12= 0 andk21= 100.N= 7000,Δt = 10 ms.C-D. Image of domains simulated with the domain concentration c = 0.4 (see Additional file 1) and its
pair correlation function are calculated.
Matysik and KrautBMC Research Notes2014,7:274 Page 5 of 10
attributable to membrane defects or particle adherence to the surface.
For detailed analysis of the diffusion behavior, first Mosaic Particle Tracker plugin [21] was used to recognize single particles and link them into trajectories. At this stage, the data must be filtered to dismiss spurious or immobile tra-jectories. Although this process is not complicated per se, and can be done using a variety of available programming environments or statistical software, in all cases it requires good programming skills from the user. This is especially true when dealing with large datasets, which are typical for lipid bilayer diffusion data. In TrackArt, trajectories can be easily imported, inspected and filtered. For the case of the experiment discussed above, trajectories were filtered ac-cording to criteria summarized in Table 1, and the statistics, such as number of filtered coordinates, trajectories, average Dvalue and trajectory size for each dataset before and after filtering are listed in Table 2. For better visualization of the filtering process, combined trajectories and their MSD curves in log-log scale are presented in Figure 5.
Datasets were then analyzed in TrackArt MSD module, by linear MSD fitting. Typically, calculation of MSDs and their linear fit to extract the diffusion coefficient can be done in a simple spreadsheet. However, a more detailed analysis returning MSD standard deviation, error in D (calculated using recently published algorithms [11,12]), localization error and number of optimal time-lags to use, requires more complex programming tools. Although there are direct solutions that deal effectively with the cal-culation of parameters mentioned [11,12], the raw code used for their implementation is daunting for those not fa-miliar with Matlab or C++ environments. In contrast to these options, the TrackArt GUI in this example allowed easy calculation of the diffusion coefficient to 1.503 ± 0.009μm2/s and the dynamic localization error to 71 nm.
Because of the aforementioned existence of multiple populations, the diffusion coefficient estimated from sim-ple MSD fits gives only an average value ofD. Thus, CPD and FIT modules are used to find individualDs of each population and their fractions. The cumulative probability distribution (CPD) of square displacements (SD) was cal-culated and fit in the TrackArt CPD module for the first 10 time-lags. Plots of CPD and fits aid in choosing the right model for analysis, based on residuals and calculated MSD values. As expected, a single population model failed to fit, in contrast to a two-population model (P1 and P2), which fit well (Figure 6). The three-population model did not show any fitting improvement according to an F-test and was dismissed as data over-fitting. Calculated r2
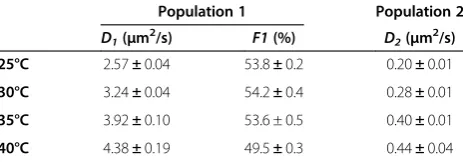
1, r22 and F1 were then plotted in the TrackArt FIT module (Figure 7). Diffusion coefficients were estimated from the linear MSD fits, while the fraction was estimated by aver-aging F1 parameters, resulting in: D1= 2.57 ± 0.04 μm2/s, D2= 0.20 ± 0.01μm2/s andF1= 53.8% ± 0.2%. The diffusion coefficient of the fast population, at 2.57 ± 0.04μm2/s, is in general agreement with a recent report (2.7 ± 0.3 μm2/s) obtained from FCS studies on a similar mica supported bi-layer [29]. In that case however, a one population model was validated and used.
[image:7.595.57.292.89.220.2]A FRAP study on similar DMPC bilayers clearly indi-cated the existence of two populations with different dif-fusion rates, explained as particles diffusing in the upper and lower bilayer leaflet [30]. This explanation, however, Figure 4Sum projection of a single molecule image stack, with
color coding for better visualization: brighter color indicates longer time spent by the particle in a certain area.The detected particle trajectory is overlaid on the image. It can be clearly seen that a particle is switching between two states: fast diffusion and slow diffusion. This behavior is typical for most of the observed molecules. Analyzing Particle Movement (APM_GUI) software was used to ensure that the particles remain in a confined region longer than particles undergoing normal Brownian diffusion would remain. Scale bar 1μm.
Table 1 Exclusion criteria used for filtering spurious trajectories of SM-Atto647N diffusing on a mica-supported DOPC bilayer at 25°C
Exclusion criterion Value
Min frames number 20
Min D (μm2/s) 0.1
Max D (μm2/s) 10
Min individual MSD fit R2 0.9
Min average trajectory intensity 0.3
[image:7.595.302.539.124.192.2]Max average trajectory intensity 1.5
Table 2 Statistics of non-filtered and filtered tracking data for SM-Atto647N diffusing on a mica-supported DOPC bilayer at 25°C
DOPC SM-Atto647N on mica, 25°C
Non-filtered Filtered
Coordinates 166159 90954
Trajectories 2562 986
[image:7.595.57.290.636.732.2]Figure 5TrackArt IMPORT. A-B. Visualization of imported trajectories(A)before and(B)after filtering.C-D. MSD curves of all trajectories (C)before and(D)after filtering. Axes are in log-log scale to better visualize the filtering effect.
Figure 6TrackArt CPD.Cumulative probability distribution square displacements and their fits using different models, for the 10thtime-lag of a DOPC-SM Atto647N sample at 25°C.A. A 1p model failed to fit to the data points.B. A 2p model successfully fit to the data points.
Matysik and KrautBMC Research Notes2014,7:274 Page 7 of 10
[image:8.595.55.539.423.701.2]is not consistent with our observation of switching be-tween fast and slow states occurring in time range of seconds. Transmembrane lipid flip-flop transitions are known to occur at a rate several orders of magnitude lower [31], and will therefore be essentially unobserv-able. Thus, we conclude that the slowly diffusing com-ponent is more likely a result of direct interaction of individual lipid molecules with the surrounding bilayer.
Temperature effect on diffusion
To further analyze factors controlling diffusion behavior in detail, the experiment described in the previous para-graph was repeated at four temperatures: 25°C, 30°C, 35°C and 40°C. Trajectories were filtered using the same exclu-sion criteria (as in Table 1). For all four conditions, CPD fits suggested the existence of two populations, and thus a 2p model was used for calculation of diffusion coefficients, which were summarized in Table 3. As expected from the Einstein relation, an increase inDis observed for both the fast and slow populations. Increasing error values for higher temperatures can be related to several factors. The diffusion rate increasing with temperature typically results in bigger localization errors. For the same reason, more er-rors are introduced during particle recognition and link-ing, for example because spots were below the intensity cutoff, or travelled too far between frames to be linked into the same trajectory, resulting in shorter and/or less accurate trajectories. The faster photo-bleaching rate at higher temperature may also contribute to shortening of
average trajectory length. Consequently, the number of calculated squared displacements for longer time-lags was reduced drastically, increasing the final error.
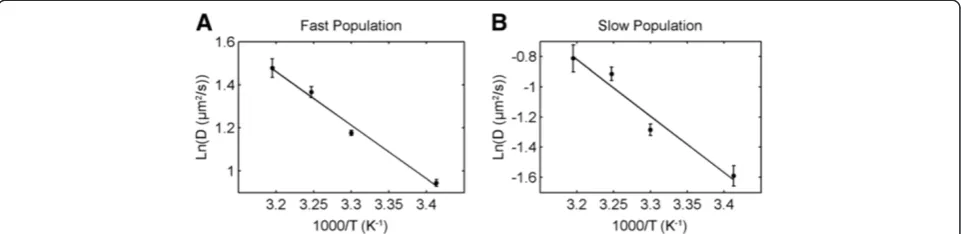
Results of diffusion at different temperatures were dis-played as Arrhenius plots of ln(D) as a function of 1/T, shown in Figure 8. Both populations showed highly corre-lated linear dependence, in perfect agreement with values expected from the Arrhenius plots, since experiments were conducted at temperatures above the DOPC melting point (Tm= - 20°C). The effective activation energy EArr, was calculated from the slope of the least squares linear fit, yielding 30.61 ± 2.78 kJ/mol and 48.24 ± 7.20 kJ/mol for the fast and slow population, respectively. The > 1.5 times higher EArr value for the slow population supports the idea that the slower diffusion rate is due to lipid inter-action with the mica surface. This would result in higher activation energy being required to overcome the surface adhesive energy, in addition to the forces from the sur-rounding lipids, in order to increase diffusion rate. Activa-tion energy for the fast fracActiva-tion was higher comparing to previous reports (17-20 kJ.mol) [32,33]. In those cases however, only one diffusion component was observable in bilayers supported on glass, also different lipid marker was used, and for that reason the results cannot be directly compared.
Future directions
[image:9.595.59.540.90.214.2]TrackArt can be further developed for the analysis of sin-gle molecule behavior in supported lipid bilayers and plasma membrane derived bilayers, where the role of dif-ferent species of sphingolipids (e.g. complex glycolipids) on phase separation and formation of ordered domains, and the behavior of novel lipid analogs can be studied. Further, it will be interesting to characterize glycolipid-and domain- specific fluorescently tagged peptides [34] in comparison to other phase-specific probes. Indeed, the analysis of any given lipid or peptide probe in relation to a second probe or domain marker will be very informative, and can be easily achieved via the use of an emission split-ting device, which records two labels simultaneously on Figure 7MSD plots.MSD plots for fast(A)and slow(B)populations, and fraction of the fast population(C)calculated for SM-Atto647N diffusing on a mica-supported DOPC membrane at 25°C.
Table 3 Diffusion coefficients and fractions for SM Atto647N diffusing on a mica-supported DOPC bilayer at different temperatures
Population 1 Population 2 D1(μm2/s) F1(%) D2(μm2/s)
25°C 2.57±0.04 53.8±0.2 0.20±0.01
30°C 3.24±0.04 54.2±0.4 0.28±0.01
35°C 3.92±0.10 53.6 ± 0.5 0.40±0.01
[image:9.595.58.290.651.732.2]adjacent halves of the camera chip [35]. Given its precision and sensitivity to heterogeneity in diffusion behaviors among populations of particles, TrackArt should be an ef-fective tool for analyzing the effects of drugs and small compounds on membrane fluidity, organization, and dy-namics. These studies will be done in parallel with analysis by TIRF- and confocal-FCS methods [36-39], which are complementary to SMT.
Conclusions
SMT is a commonly used and effective technique for analysis of diffusion in lipid bilayers, and while it is trad-itionally viewed as being overly labor-intensive for the extraction of very precise diffusion coefficients from large data sets, the method provides different and comple-mentary information to other statistical methods such as FCS or FRAP. Most importantly, SMT allows direct obser-vation and measurement of individual molecules in a lipid membrane, and because of this it can give insights into the behavior of individuals with respect to their environment. However, the accurate quantitative analysis of diffusion data requires a careful approach that includes trajectory fil-tering, as well as selection of proper models, and methods of analysis. Although many methods have been described and effectively used for ~20 years, their application often assumes good programming skills, and their adoption by the non-specialist community is hampered by the lack of easy to use tools. In this manuscript, we presented the TrackArt software ensemble for SMT data analysis and simulation. As an example of its effectiveness, we used TrackArt to analyze and describe the complex diffusion be-havior of a sphingolipid analog in mica-supported DOPC bilayers. Encouragingly, we were able to detect in this sys-tem the existence of different diffusion components, their dependence on temperature, and finally their effective acti-vation energies, suggesting transient interactions of the slower-diffusing molecules with the mica surface. The graphical interface of TrackArt allows fast and accurate SMT data processing, even for those not familiar with any programming environment, and the workflow can be
repeated on test data provided. TrackArt will help to achieve the goal of making a very useful, but sometimes esoteric and tricky technique more accessible to the bio-logical community.
Availability and requirements
Project name:TrackArt
Project home page:
http://www2.sbs.ntu.edu.sg/staff/rskraut/index.php/ trackart
http://sourceforge.net/projects/trackart/
Operating system(s):Platform independent
Programming language:Matlab
Other requirements:none
License:GNU General Public License
Any restrictions to use by non-academics:none
Additional file
Additional file 1:TrackArt: the user friendly interface for single molecule tracking data analysis and simulation applied to complex diffusion in mica supported lipid bilayers - supplementary materials.
Abbreviations
AFM:Atomic force microscopy; CPD: Cumulative probability distribution; DOPC: 1,2-dioleoyl-sn-glycero-3-phosphocholine; EMCCD: Electron multiplying charge coupled device; FCS: Fluorescence correlation spectroscopy; FRAP: Fluorescence recovery after photobleaching; GUI: Graphic user interface; MSD: Mean square displacement; SMT: Single molecule tracking; TIR: Total internal reflection.
Competing interest
The authors declare that they have no competing interests.
Authors’contributions
AM and RK conceived and designed this study. AM carried out experiments and designed and coded the software. AM and RK wrote the manuscript. Both authors read and approved the final manuscript.
Acknowledgements
[image:10.595.58.539.90.207.2]The authors acknowledge Dr. Xavier Michalet, Dr. Thorsten Wohland, Nirmalya Bag and Dr. Jagadish Sankaran for helpful discussions and suggestions. RK was supported by a start-up grant from Nanyang Technological University and Tier II grant from the Singapore Ministry of Education Academic Research Fund
Figure 8Arrhenius plots for fast and slow populations of SM-Atto647N diffusing on a mica-supported DOPC membrane.Activation energies calculated from the slopes for the fast(A)and slow(B)population are 30.61 ± 2.78 kJ/mol and 48.24 ± 7.20 kJ/mol respectively.
Matysik and KrautBMC Research Notes2014,7:274 Page 9 of 10
(MOE2009-T2-2-019). AM gratefully acknowledges funding from the Singapore International Graduate Award (SINGA) issued by Agency for Science, Technology and Research (A*STAR).
Received: 6 June 2013 Accepted: 23 April 2014 Published: 1 May 2014
References
1. Garcia-Saez AJ, Schwille P:Surface analysis of membrane dynamics.
Biochim Biophys Acta2010,1798(4):766–776.
2. Sanchez SA, Tricerri MA, Ossato G, Gratton E:Lipid packing determines protein-membrane interactions: challenges for apolipoprotein A-I and high density lipoproteins.Biochim Biophys Acta2010,1798(7):1399–1408. 3. Sezgin E, Levental I, Grzybek M, Schwarzmann G, Mueller V, Honigmann A,
Belov VN, Eggeling C, Coskun U, Simons K, Schwille P:Partitioning, diffusion, and ligand binding of raft lipid analogs in model and cellular plasma membranes.Biochim Biophys Acta2012,1818(7):1777–1784. 4. Mueller V, Ringemann C, Honigmann A, Schwarzmann G, Medda R,
Leutenegger M, Polyakova S, Belov VN, Hell SW, Eggeling C:STED nanoscopy reveals molecular details of cholesterol- and cytoskeleton-modulated lipid interactions in living cells.Biophys J2011,101(7):1651–1660.
5. Kraut R, Bag N, Wohland T:Fluorescence correlation methods for imaging cellular behavior of sphingolipid-interacting probes.Methods Cell Biol
2012,108:395–427.
6. Veatch SL, Keller SL:Seeing spots: complex phase behavior in simple membranes.Biochim Biophys Acta2005,1746(3):172–185.
7. Szmodis AW, Blanchette CD, Longo ML, Orme CA, Parikh AN:Thermally induced phase separation in supported bilayers of glycosphingolipid and phospholipid mixtures.Biointerphases2010,5(4):120–130.
8. Sezgin E, Kaiser HJ, Baumgart T, Schwille P, Simons K, Levental I:Elucidating membrane structure and protein behavior using giant plasma membrane vesicles.Nat Protoc2012,7(6):1042–1051.
9. Elson E:Fluorescence correlation spectroscopy measures molecular transport in cells.Traffic (Copenhagen, Denmark)2001,2(11):789–796. 10. Basit H, Lopez S, Keyes T:Fluorescence correlation and lifetime correlation
spectroscopy applied to the study of supported lipid bilayer models of the cell membrane.Methods (San Diego, Calif )2014.
11. Michalet X:Mean square displacement analysis of single-particle trajectories with localization error: Brownian motion in an isotropic medium.Phys Rev E Stat Nonlin Soft Matter Phys2010,82(4 Pt 1):041914.
12. Michalet X, Berglund AJ:Optimal diffusion coefficient estimation in single-particle tracking.Phys Rev E Stat Nonlin Soft Matter Phys2012, 85(6 Pt 1):061916.
13. Knight JD, Falke JJ:Single-molecule fluorescence studies of a PH domain: new insights into the membrane docking reaction.Biophys J2009, 96(2):566–582.
14. Qian H, Sheetz MP, Elson EL:Single particle tracking. Analysis of diffusion and flow in two-dimensional systems.Biophys J1991,60(4):910–921. 15. Schutz GJ, Schindler H, Schmidt T:Single-molecule microscopy on model
membranes reveals anomalous diffusion.Biophys J1997,73(2):1073–1080. 16. Wieser S, Schutz GJ:Tracking single molecules in the live cell plasma
membrane-Do's and Don't's.Methods2008,46(2):131–140. 17. Borst JW, Visser NV, Kouptsova O, Visser AJ:Oxidation of unsaturated
phospholipids in membrane bilayer mixtures is accompanied by membrane fluidity changes.Biochim Biophys Acta2000,1487(1):61–73. 18. Knight JD, Lerner MG, Marcano-Velazquez JG, Pastor RW, Falke JJ:Single molecule diffusion of membrane-bound proteins: window into lipid contacts and bilayer dynamics.Biophys J2010,99(9):2879–2887. 19. Skaug MJ, Faller R, Longo ML:Correlating anomalous diffusion with lipid
bilayer membrane structure using single molecule tracking and atomic force microscopy.J Chem Phys2011,134(21):215101.
20. Saxton MJ:Lateral diffusion and aggregation. A Monte Carlo study.
Biophys J1992,61(1):119–128.
21. Sbalzarini IF, Koumoutsakos P:Feature point tracking and trajectory analysis for video imaging in cell biology.J Struct Biol2005,151(2):182–195. 22. Saxton MJ:Single-particle tracking: the distribution of diffusion
coefficients.Biophys J1997,72(4):1744–1753.
23. Matsuoka S, Shibata T, Ueda M:Statistical analysis of lateral diffusion and multistate kinetics in single-molecule imaging.Biophys J2009,97(4):1115–1124.
24. Pinaud F, Dahan M:Targeting and imaging single biomolecules in living cells by complementation-activated light microscopy with split-fluorescent proteins.Proc Natl Acad Sci U S A2011,108(24):E201–E210. 25. Weigel AV, Simon B, Tamkun MM, Krapf D:Ergodic and nonergodic
processes coexist in the plasma membrane as observed by single-molecule tracking.Proc Natl Acad Sci U S A2011,108(16):6438–6443. 26. de Keijzer S, Galloway J, Harms GS, Devreotes PN, Iglesias PA:Disrupting
microtubule network immobilizes amoeboid chemotactic receptor in the plasma membrane.Biochim Biophys Acta2011,1808(6):1701–1708. 27. Sahl SJ, Leutenegger M, Hilbert M, Hell SW, Eggeling C:Fast molecular
tracking maps nanoscale dynamics of plasma membrane lipids.Proc Natl Acad Sci U S A2010,107(15):6829–6834.
28. Menchón S, Martín M, Dotti C:APM_GUI: analyzing particle movement on the cell membrane and determining confinement.BMC Biophys2012,5:4. 29. Przybylo M, Sýkora J, Humpolíčková J, Benda A, Zan A, Hof M:Lipid
diffusion in giant unilamellar vesicles is more than 2 times faster than in supported phospholipid bilayers under identical conditions.
Langmuir2006,22(22):9096–9099.
30. Scomparin C, Lecuyer S, Ferreira M, Charitat T, Tinland B:Diffusion in supported lipid bilayers: influence of substrate and preparation technique on the internal dynamics.Eur Phys J E Soft Matter2009,28(2):211–220. 31. McConnell HM, Kornberg RD:Inside-outside transitions of phospholipids
in vesicle membranes.Biochemistry1971,10(7):1111–1120. 32. Derzko Z, Jacobson K:Comparative lateral diffusion of fluorescent lipid
analogues in phospholipid multibilayers.Biochemistry1980,19(26):6050–6057. 33. Bag N, Yap DHX, Wohland T:Temperature Dependence of Diffusion in
Model and Live Cell Membranes Characterized by Imaging Fluorescence Correlation Spectroscopy.Biochimica et Biophysica Acta (BBA) - Biomembranes
2013,1838(3):802–813. Article submitted for publication.
34. Hebbar S, Lee E, Manna M, Steinert S, Kumar GS, Wenk M, Wohland T, Kraut R: A fluorescent sphingolipid binding domain peptide probe interacts with sphingolipids and cholesterol-dependent raft domains.J Lipid Res2008, 49(5):1077–1089.
35. Webb SE, Zanetti-Domingues L, Coles BC, Rolfe DJ, Wareham RJ, Martin-Fernandez ML:Multicolour single molecule imaging on cells using a supercontinuum source.Biomed Opt Express2012,3(3):400–406. 36. Sankaran J, Manna M, Guo L, Kraut R, Wohland T:Diffusion, transport, and
cell membrane organization investigated by imaging fluorescence cross-correlation spectroscopy.Biophys J2009,97(9):2630–2639. 37. Sankaran J, Shi X, Ho LY, Stelzer EH, Wohland T:ImFCS: a software for imaging
FCS data analysis and visualization.Opt Express2010,18(25):25468–25481. 38. Guo L, Har JY, Sankaran J, Hong Y, Kannan B, Wohland T:Molecular
diffusion measurement in lipid bilayers over wide concentration ranges: a comparative study.Chemphyschem2008,9(5):721–728.
39. Kolin D, Wiseman P:Advances in image correlation spectroscopy: measuring number densities, aggregation states, and dynamics of fluorescently labeled macromolecules in cells.Cell Biochem Biophys2007, 49(3):141–164.
doi:10.1186/1756-0500-7-274
Cite this article as:Matysik and Kraut:TrackArt: the user friendly interface for single molecule tracking data analysis and simulation
applied to complex diffusion in mica supported lipid bilayers.BMC
Research Notes20147:274.
Submit your next manuscript to BioMed Central and take full advantage of:
• Convenient online submission
• Thorough peer review
• No space constraints or color figure charges
• Immediate publication on acceptance
• Inclusion in PubMed, CAS, Scopus and Google Scholar
• Research which is freely available for redistribution