DOI 10.1007/s00214-016-1859-z
REGULAR ARTICLE
Density functional theory studies of MTSL nitroxide side chain
conformations attached to an activation loop
Maria Grazia Concilio1 · Alistair J. Fielding1 · Richard Bayliss2 · Selena G. Burgess2
Received: 15 January 2016 / Accepted: 8 March 2016 / Published online: 23 March 2016 © The Author(s) 2016. This article is published with open access at Springerlink.com
1 Introduction
The most widely employed spin label for studies of the
structure and dynamics of biomolecules [1, 2], through
electron paramagnetic resonance (EPR) spectros-copy, is the methane-thiosulfonate spin label (MTSL).
Figure 1 shows a model of MTSL attached to a fragment
extracted from the activation loop of Aurora-A kinase, a serine/threonine protein kinase that regulates many cel-lular pathways and is overexpressed in a number of can-cers [3, 4].
The MTSL is endowed of high flexibility and the knowledge of the potential surface is required in order to
model its internal dynamics [5–7]. In this work, a
quan-tum mechanical (QM) method based on density functional theory (DFT) was employed to determine features of the energy surface of the five dihedral angles of MTSL. The DFT theory was employed since it induces the electron correlations effect, representing an appropriate method to reproduce short electrostatic interactions between sulphur
atoms and backbone atoms [7].
In the previous literature, similar approaches were
adopted by Tombolato et al. [5] using the Hartree–Fock
(HF) theory to study conformations of the MTSL in α-helix
systems of the T4 Lysozyme protein [5–7] and results
obtained were used to complement subsequent MD studies
[8, 9]. Considering our system, the question arose whether
the conformational states determined in the α-helix are the
same in the activation loop of a different protein.
We performed a conformational analysis of the poten-tial energy surfaces of the MTSL side chain attached to a fragment extracted from activation loop of Aurora-A kinase protein with the purpose to characterize its geometrical parameters and describe the system in a limited number of rotamers. We carried out this work to establish a basis for
Abstract A quantum mechanical (QM) method rooted on density functional theory (DFT) has been employed to determine conformations of the methane-thiosulfonate spin label (MTSL) attached to a fragment extracted from the activation loop of Aurora-A kinase. The features of the calculated energy surface revealed low energy barri-ers between isoenergetic minima, and the system could be described in a population of 76 rotamers that can be also considered for other systems since it was found that the
χ3, χ4 and χ5 do not depend on the previous two dihedral
angles. Conformational states obtained were seen to be
comparable to those obtained in the α-helix systems
stud-ied previously, indicating that the protein backbone does not affect the torsional profiles significantly and suggesting the possibility to use determined conformations for other protein systems for further modelling studies.
Keywords DFT · EPR · Computational chemistry
Electronic supplementary material The online version of this article (doi:10.1007/s00214-016-1859-z) contains supplementary material, which is available to authorized users.
* Maria Grazia Concilio
* Alistair J. Fielding
1 The Photon Science Institute and School of Chemistry, EPSRC National EPR Facility and Service, University of Manchester, Manchester M13 9PY, UK
more advanced modelling approaches involving molecular dynamics (MD) simulations that require different initial starting conformations of the MTSL for appropriate statis-tical analyses.
2 Methods
2.1 QM calculations of the conformations of the MTSL
A short unit peptide was extracted from the X-ray crystal structure of the Aurora-A kinase domain (residues
122-403 C290A C393A; PDB 4CEG [10] with a resolution of
2.10 Å and R-value of 0.202) obtained after minimization and equilibration processes performed using the AMBER
15 package [11] in conjunction with ff14SB protein force
field [12] in order to clean the structure and to remove bad
contacts. Subsequently, the protein was solvated using the Extended Simple Point Charge (SPC/E) water model (9721 water molecules) in a truncated octahedral box with
a buffer of 12 Å between the protein atoms and the edge
of the box. Afterwards, a short energy minimization was
performed in two steps using the Simulated Annealing with NMR-derived Energy Restraints (SANDER) module of AMBER. In the first stage, the water molecules and coun-ter ions were relaxed with 200 cycles of minimization. In the second step, the entire system as a whole was relaxed with 1000 cycles of minimization. Subsequently, the sys-tem was heated at constant volume for 20 ps from 10 to 300 K with 10 kcal/mol weak restraints on the protein. This process was followed by two equilibration steps: the first was performed at constant pressure (1 atm) and tempera-ture (300 K) for 200 ps with no restraints and the second was performed in a microcanonical (NVE) ensemble for 1 ns. Relaxed scans were performed subsequently using
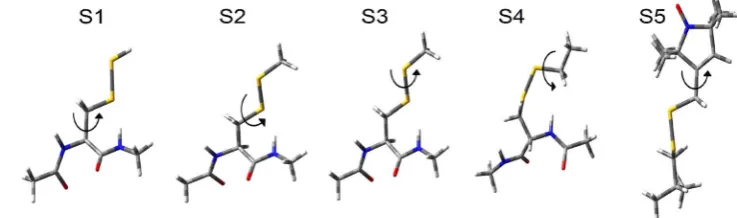
subsystems shown in Fig. 2 where the MTSL side chain
was gradually built by adding atoms to the unit peptide extracted from the crystal structure of the Aurora-A kinase.
In order to provide reliable reproductions of the equilib-rium geometries of the rotamers, the energy torsional
pro-files Vi(χi) were calculated by performing relaxed scans in
thirty-seven steps of 10° with the B3LYP hybrid functional
[13, 14] and the 6-31G(d) basis set [15] in gas phase around
each dihedral angle (χ1, χ2, χ3, χ4 and χ5) of the MTSL side
chain. The same model system was used in previous work
[5–9]. The ab initio relaxed scans were performed in 37
steps of 10° using the opt=mod redundant keyword in the
Gaussian 09 software [16] that fixes coordinates but
opti-mizes or relaxes the other atoms.
These scans helped to identify the minima of the tor-sional energy profiles of all five dihedral angles. The Gibbs free energies were determined with the B3LYP hybrid
functional and the 6-31G(d) basis set using the Freq=
hin-drot keyword.
3 Results and discussion
3.1 Conformational analysis of the MTSL side chain from QM calculations
The MTSL side chain was gradually built in by
add-ing atoms to the Cα atom of the CH3–CO–NH–Cα–CO–
NH–CH3 fragment extracted from the minimized and
Fig. 1 Structure of the Aurora-A kinase domain with the MTSL side chain (black circle) attached at position 288 within the activation loop which comprises residues 274–299 (grey). The unit peptide extracted for the DFT analysis is indicated by a blue arrow. All five dihedral angles of the MTSL side chain are enlarged and shown, with the pyr-roline ring containing the nitroxide group highlighted in a red circle
[image:2.595.55.289.55.208.2] [image:2.595.174.543.604.713.2]equilibrated structure of the Aurora-A kinase domain in which the Cartesian coordinates of the peptide atoms were kept fixed in the configuration obtained after the previous scan. The relaxed scans were performed following the
strat-egy shown in Fig. 3. The energy minima of the χi+1
dihe-dral angle were determined at the minima of the χi dihedral
angle.
The first torsional energy profile of the dihedral angle,
χ1, was obtained by performing relaxed scans in the range
from −180° to +180°, considering the rotation of the Cα–
CβH2 group attached to the CH3–CO–NH–CαH–CO–NH–
CH3 fragment. The torsional energy profile showed three
minima at the values of −160° and ±60° (Fig. 4a).
The high energy barriers corresponded to eclipsed con-figurations, while the lower energy barriers correlated to
configurations in which the Sγ and Sδ atoms were
interact-ing with the protein backbone. The first torsional profile (Fig. 4a) V(1)
(χ1) showed three broad minima and two
transitions between −160° ↔−60° and −60° ↔+60° that
were separated by an energy barrier of ∼3 and ∼5 kcal/
mol, respectively. These energy barriers are somewhat small, and transitions between them would be expected
to occur frequently. Subsequently, the V(2)
(χ2) torsional
profiles were calculated considering the rotation around
the CβH2–Sγ group attached to the Cα atom of the CH3–
NH–CO–CαH–NH–CO–CH3 fragment. The χ1 dihedral
angle was set at −160° and ±60° (minima in the previous
scan). In the calculated V(2)
(χ2) torsional profiles (Fig. 4b),
energy barriers of ∼1–2 kcal/mol between −120° ↔+80°
for χ1 equal to −160° and +60°, and −160° ↔−70° and
−160° ↔+80° for χ1 equal to −60° were observed. These
transitions would be expected to occur very frequently since they are separated by very small energy barriers, but are unlikely to do so considering the electrostatic
interac-tions between the Sγ sulphur atom and the protein
back-bone. The torsional profiles about χ3 were calculated at all
these minima keeping the χ1 and χ2 dihedral angles fixed
at the selected values shown in Fig. 4c. For the
calcula-tion of the V(3)
(χ3) torsional profiles, the rotation around
the CβH2Sγ–SδCH2 group attached to the Cα atom of the
CH3–NH–CO–CαH–NH–CO–CH3 fragment was
consid-ered. Similar energy torsional profiles and two minima at
±90° separated by a higher energy barrier of ∼14 kcal/mol
were found for V(3)
(χ3) for all seven possible combinations
of the minima found for χ1 and χ2 (Fig. 4c). The energy
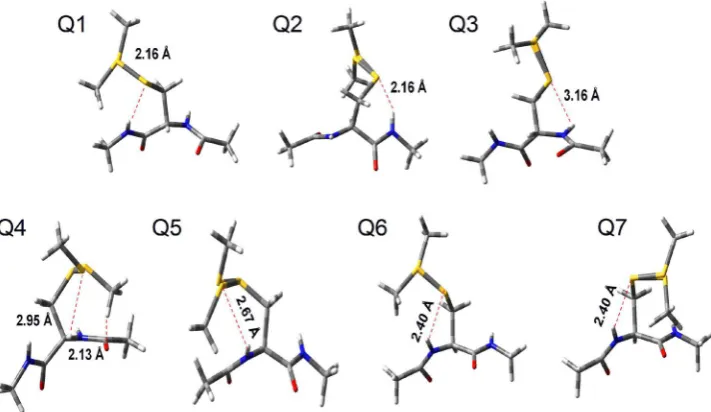
minima corresponded to the structures stabilized by short electrostatic interactions between atoms of the MTSL side
chain and the unit peptide model as shown in Fig. 5.
The Sγ atom interacts with the NH group for χ1=−160°
at χ2 = −120° (Fig. 5Q1), +80° (Fig. 5Q2) and for
χ1=−60° at χ2=−160° (Fig. 5Q3). The conformation at
χ1=−60°, χ2=−70° and χ3=+ 90° was stabilized by
two short electrostatic interactions between the Sδ atom of
the MTSL chain and the CαH group in the fragment, and
the CH2 group and the CO group (Fig. 5Q4). The Sδ atom
interacts with the NH group for χ1=−60° and χ2=+80°
(Fig. 5Q5). The conformation at χ1=+60°, χ2=−120°
and +80° and χ3=±90° (Fig. 5Q6 and Q7) was stabilized
by interactions between the Sγ atom of the MTSL and the
NH group of the protein backbone. The remaining V(4)
(χ4)
-120°, +80° -160° -70° +80°
±90°
-70° +70° 180°
± 0°
-90°+30° -10° °
-160° -60° +60°
-120°, +80°
Relaxed scan around
Relaxed scan around
Relaxed scan around
Relaxed scan around
Relaxed scan
around Relaxed scan around Relaxed scan around
Fig. 3 Strategy used to find minima of the torsional energy profile around χ1, χ2, χ3, χ4 and χ5 dihedral angles from the relaxed scans.
The first relaxed scan was performed around χ1, and three minima at −160°, −60° and +60° were found. Subsequently, the energy tor-sional profile was calculated around χ2 at the minima of χ1, and two minima, one broad between −160° and −120° and another at +80°, were found for χ1=−160° and +60°. Three minima (−160°, −70°
and +80°) were found for χ1=−60°. The relaxed scan around χ3
was performed at the minima of χ2, and two minima ±90° for all the possible combination of χ1 and χ2 were found. Three minima ±70°
and V(5)
(χ5) torsional profiles (Fig. 4d–i) were calculated
considering the rotations around the Sδ–CH2 group (for
χ4) and Sδ–CH2 pyrroline nitroxide ring (for χ5) with the
previous dihedral angles kept fixed at the selected values. Like for V(3)
(χ3), the V(4)(χ4) torsional profiles (Fig. 4d–f)
were found to be independent from the values of the previ-ous dihedral angles, probably due to the distance from the
protein backbone. Similar torsional profiles for V(4)(χ4) and
three minima (±70° and 180°) were observed for all
possi-ble combinations of χ1, χ2 and χ3. Two low energy barriers
of 1–2 kcal/mol were found between the minima at ±70°
and 180°, and one high energy barrier between –70° and
+70° was found. The V(5)
(χ5) torsional profile was
meas-ured at ±70° and 180°, and three different profiles were
-180-150-120 -90 -60 -30 0 30 60 90 120 150 180 -2 0 2 4 6 8 10 12 14
-180-150-120 -90 -60 -30 0 30 60 90 120 150 180 -2 0 2 4 6 8 10
-180-150-120 -90 -60 -30 0 30 60 90 120 150 180 -2 0 2 4 6 8 10 -180-150-120 -90 -60 -30 0 30 60 90 120 150 180 -2 -1 0 1 2 3 4 5 6 7
-180-150-120 -90 -60 -30 0 30 60 90 120 150 180 -2 0 2 4 6 8
-180-150-120 -90 -60 -30 0 30 60 90 120 150 180 -10 -5 0 5 10 15
-180-150-120 -90 -60 -30 0 30 60 90 120 150 180 -1 0 1 2 3 4 5 6
-180-150-120 -90 -60 -30 0 30 60 90 120 150 180 -8 -6 -4 -2 0 2 4
-90-80-70-60-50-40-30-20-10 0 10 20 30 40 50 60 70 80 90 -2 -1 0 1 2 3 4 5 +70 -70
V (kcal mo
l
-1)
χ4( )
χ1 = -160, χ2 = -120, χ3 = +90
χ1 = -160, χ2 = -120, χ3 = -90
χ1 = -160, χ2 = +80, χ3 = +90
χ1 = -160, χ2 = +80, χ3 = -90
180 V (kcal mo -90
l
-1)
χ1 = +60, χ2 = −120, χ3 = +90
χ1 = +60, χ2 = −120, χ3 = −90
χ1 = +60, χ2 = +80, χ3 = +90
χ1 = +60, χ2 = +80, χ3 = −90
-70 +70
180 +70
-70
V (kcal mo
l
-1)
χ1 = -60, χ2 = -160, χ3 = +90 χ1 = -60, χ2 = -160, χ3 = -90 χ1 = -60, χ2 = +80, χ3 = +90 χ1 = -60, χ2 = +80, χ3 = -90 χ1 = -60, χ2 = -70, χ3 = +90
χ1 = -60, χ2 = -70, χ3 = -90
180
V (kcal mo
l
-1)
χ1(ο
ο
ο
χ4( )ο χ
4( )
ο
)
-160 -60 +60
A B
+80 -70
-160 -120
V (kcal mo
l
-1)
χ2(ο)
χ1= −160 χ1= −60 χ1= +60
C
G H I
D E F
-90
V (kcal mo
l
-1)
χ3(ο)
χ1 = −60, χ2 = −160
χ1 = −60, χ2 = −70
χ1 = −60, χ2 = +80
χ1 = −160, χ2 = −120
χ1 = −160, χ2 = +80
χ1 = +60, χ2 = +80
χ1 = +60, χ2 = −120
+90
V (kcal mo
l
-1)
χ5 ( ) χ ο
5 ( )
ο
χ5 ( )
χ4 = 180
+90 -90
V (kcal mo
l
-1)
χ4 = -70
+90 -10
V (kcal mo
l
-1)
χ4 = +70
+30 -90
Fig. 4 Energy torsional profiles about the five dihedral angles χ1,
χ2, χ3, χ4 and χ5 of the MTSL side chain. a Energy torsional profile
about the dihedral angle, χ1. b Energy torsional profiles about the
dihedral angle, χ2, at the minima of χ1. c Energy torsional profiles
about the dihedral angle, χ3, at the minima of χ2. d–f Energy torsional
[image:4.595.55.541.50.545.2]observed (Fig. 4g–i). The V(5)
(χ5) profile at χ4 = +70°
was calculated between –90° and +90° due to a clash
between one of the methyl groups of the pyrroline nitroxide
ring and the Cβ carbon of the MTSL chain for angles over
this range. The shape of the torsional profiles obtained in
this work is similar to those seen in α-helices and values of
the minima were found to be only slightly different [5–9],
indicating the protein backbone does not significantly influ-ence the torsional profiles. No relevant changes in the
tor-sional profile of χ1 and χ2 were observed on extension of
the atoms in the unit peptide (data not shown) but longer
computational times. This was also observed for χ3, χ4 and
χ5.
After calculation of the torsional energy profiles for all five dihedral angles in the unit peptide model, a population of 76 conformations was found at the minima of the tor-sional energy profiles. The tortor-sional profiles showed low energy barriers from 1 to ~20 kcal/mol and isoenergetic minima in the potential energy surface, indicating that the rotamer population would be fully sampled at room temper-ature and conformational states are expected to be obtained in the same amount. Also, the Gibbs free energy of the dif-ferent conformations were seen to be comparable and equal
to −6,556,624, −6,556,624 and −6,556,623 kcal mol−1 for
Q2, Q5 and Q7 (characterized by different χ1), respectively.
Similarly, it was observed for Q1 and Q2 (characterized by
different χ2) with Gibbs free energy equal to −6,556,624
and −6,556,622 kcal mol−1, and for conformations with
χ3
equal to +90° and +90° that have a free energy equal to
−655,624 and −655,623 kcal mol−1. After having
deter-mined conformers of the MTSL side chain, we tested the effect of the geometric variation of the side chain on the magnetic parameters in order to exclude the contribution of the side chain to the EPR spectrum. Previous literature
showed variations of Azz and gxx components upon
geo-metrical variations (NO bond length and the CNOC
out-of-plane dihedral angle) in the proxyl radical [17] and in
aro-matic radical rings [18]. Hence, we tested the effect of the
geometry of the MTSL side chain on the magnetic proper-ties in order to exclude any contribution of the chain on the spectrum. Six conformations were selected at the minima
of the torsional profiles (Fig. 4) with different values of the
dihedral angles (Table S1 ESI), and the magnetic param-eters were computed at DFT level. Conformers showed comparable magnetic parameters, and minor changes were observed in the 94 GHz EPR spectra (Fig. S1 ESI). This indicated that the addition of the side chain and variations of its geometry do not alter significantly the spin density and shape of the molecular orbital that remained well local-ized on the NO moiety, like observed in the case of the
proxyl radical ring described in previous work [17].
4 Conclusions and future work
The conformational analysis of the MTSL side chain on a short fragment of the Aurora-A kinase activation loop revealed torsional profiles comparable to those observed in
Fig. 5 Interactions between atoms of the MTSL side chain and the unit peptide model for different values of χ1, χ2 and χ3 (red dashed
lines). Note that two conformations of χ3 are shown in each panel.
(Q1) Conformation at χ1=−160°, χ2 =−120° and χ3= ±90°.
(Q2) Conformation at χ1=−160°, χ2 =+80° and χ3=±90°. (Q3)
Conformation at χ1=−60°, χ2 =−160° and χ3=±90°. (Q4)
Con-formation at χ1=−60°, χ2 =−70° and χ3=±90. (Q5)
Conforma-tion at χ1=−60°, χ2 =+80° and χ3=±90°. (Q6) Conformation
at χ1=+60°, χ2 =−120° and χ3=±90°. (Q7) Conformation at
[image:5.595.120.476.58.264.2]fragments of α-helix studied in previous work [5–9]. This
indicated that the backbone structure does not influence the torsional profiles significantly. A population of 76 conform-ers was found at the minima of the torsional profiles, and
in addition, it was observed that the χ3, χ4 and χ5 do not
depend on the previous two dihedral angles, suggesting that the determined set of rotamers can be considered also for other systems. This analysis can be used to determine some starting conformations for MD simulations of the MTSL spin-labelled Aurora-A kinase or other systems. On the basis our own experience and previous work performed
using MD of MTSL spin-labelled proteins [8, 9], it was
observed that transitions of χ4 and χ5 are much faster than
transitions of χ1, χ2 and χ3, so the starting structures can be
established fixing χ1, χ2 and χ3. It was observed that
con-formers have comparable potential and Gibbs free energy
allowing the fixing of values χ1=±60°, −160°, χ2=+80°
and χ3=±90° in order to perform more advanced
model-ling studies.
Acknowledgments This work was supported by a studentship from Bruker Ltd. and a Cancer Research UK grant (C24461/A12772 to R.B). The authors would like to acknowledge the use of the EPSRC UK National Service for Computational Chemistry Software (NSCCS) and its staff (Dr. Alexandra Simperler and Dr. Helen Tsui for some technical advice) at Imperial College London in carrying this work. M. G. Concilio acknowledges Dr. A. Baldansuren, Dr. N. Burton and Dr. A. Simperler for useful discussions and feedback.
Open Access This article is distributed under the terms of the Creative Commons Attribution 4.0 International License (http://crea-tivecommons.org/licenses/by/4.0/), which permits unrestricted use, distribution, and reproduction in any medium, provided you give appropriate credit to the original author(s) and the source, provide a link to the Creative Commons license, and indicate if changes were made.
References
1. Drescher M, Jeschke G (2012) EPR spectroscopy: application in chemistry and biology. Springer, Berlin, p 237
2. Hoff AJ (1989) Advanced EPR: applications in biology and bio-chemistry. Elsevier, Amsterdam, p 918
3. Barr AR, Gergely F (2007) J Cell Sci 120:2987–2996
4. Bischoff JR, Anderson L, Zhu Y, Mossie K, Ng L, Souza B, Schryver B, Flanagan P, Clairvoyant F, Ginther C, Chan CS, Novotny M, Slamon DJ, Plowman GD (1998) EMBO J 17:3052–3065
5. Tombolato F, Ferrarini A, Freed JH (2006) J Phys Chem B 110:26248–26259
6. Tombolato F, Ferrarini A, Freed JH (2006) J Phys Chem B 110:26260–26271
7. Warshaviak DT, Serbulea L, Houk KN, Hubbell WL (2011) J Phys Chem B 115:397–405
8. Sezer D, Freed JH, Roux B (2008) J Phys Chem B 112:5755–5767
9. Sezer D, Freed JH, Roux B (2008) J Phys Chem B 112:11014–11027
10. Burgess SG, Bayliss R (2015) Acta Crystallogr F Struct Biol Commun 71:315–319
11. Case DA, Berryman JT, Betz RM, Cerutti DS, Cheatham TE III, Darden TA, Duke RE, Giese TJ, Gohlke H, Goetz AW, Homeyer N, Izadi S, Janowski P, Kaus J, Kovalenko A, Lee TS, LeGrand S, Li P, Luchko T, Luo R, Madej B, Merz KM, Monard G, Need-ham P, Nguyen H, Nguyen HT, Omelyan I, Onufriev A, Roe DR, Roitberg A, Salomon-Ferrer R, Simmerling CL, Smith W, Swails J, Walker RC, Wang J, Wolf RM, Wu X, York DM, Kollman PA (2015) AMBER 2015. University of California, San Francisco 12. Maier JA, Martinez C, Kasavajhala K, Wickstrom L, Hauser KE
(2015) J Chem Theory Comput 11:3696–3713
13. Lee C, Yang W, Parr RG (1988) Phys Rev B 37:785–789 14. Becke AD (1993) J Chem Phys 98:5648–5652
15. Ditchfield R, Hehre WJ, Pople JA (1971) J Chem Phys 54:724–728
16. Frisch MJ, Trucks GW, Schlegel HB, Scuseria GE, Robb MA, Cheeseman JR, Scalmani G, Barone V, Mennucci B, Petersson GA, Nakatsuji H, Caricato M, Li X, Hratchian HP, Izmaylov AF, Bloino J, Zheng G, Sonnenberg JL, Hada M, Ehara M, Toyota K, Fukuda R, Hasegawa J, Ishida M, Nakajima T, Honda Y, Kitao O, Nakai H, Vreven T, Montgomery JA, Peralta JE Jr, Ogliaro F, Bearpark M, Heyd JJ, Brothers E, Kudin KN, Staroverov VN, Kobayashi R, Normand J, Raghavachari K, Rendell A, Burant JC, Iyengar SS, Tomasi J, Cossi M, Rega N, Millam JM, Klene M, Knox JE, Cross JB, Bakken V, Adamo C, Jaramillo J, Gomperts R, Stratmann RE, Yazyev O, Austin AJ, Cammi R, Pomelli C, Ochterski JW, Martin RL, Morokuma K, Zakrzewski VG, Voth GA, Salvador P, Dannenberg JJ, Dapprich S, Daniels AD, Farkas Ö, Foresman JB, Ortiz JV, Cioslowski J, Fox DJ (2009) Gaussian 09, Revision D.01. Gaussian, Inc., Wallingford CT
17. Pavone M, Cimino P, Crescenzi O, Sillanpää A, Barone V (2007) J Phys Chem B. 111:8928–8939