This is a repository copy of
Jet impingement heat transfer on a concave surface in a wing
leading edge: Experimental study and correlation development
.
White Rose Research Online URL for this paper:
http://eprints.whiterose.ac.uk/105974/
Version: Accepted Version
Article:
Bu, X, Peng, L, Lin, G et al. (2 more authors) (2016) Jet impingement heat transfer on a
concave surface in a wing leading edge: Experimental study and correlation development.
Experimental Thermal and Fluid Science, 78. pp. 199-207. ISSN 0894-1777
https://doi.org/10.1016/j.expthermflusci.2016.06.006
© 2016, Elsevier. Licensed under the Creative Commons
Attribution-NonCommercial-NoDerivatives 4.0 International
http://creativecommons.org/licenses/by-nc-nd/4.0/
[email protected] https://eprints.whiterose.ac.uk/
Reuse
Unless indicated otherwise, fulltext items are protected by copyright with all rights reserved. The copyright exception in section 29 of the Copyright, Designs and Patents Act 1988 allows the making of a single copy solely for the purpose of non-commercial research or private study within the limits of fair dealing. The publisher or other rights-holder may allow further reproduction and re-use of this version - refer to the White Rose Research Online record for this item. Where records identify the publisher as the copyright holder, users can verify any specific terms of use on the publisher’s website.
Takedown
If you consider content in White Rose Research Online to be in breach of UK law, please notify us by
Jet impingement heat transfer on a concave surface in a wing
leading edge: experimental study and correlation development
Xueqin Bu
1Long Peng
2Guiping Lin
1Lizhan Bai
1,3,*Dongsheng Wen
31 Laboratory of Fundamental Science on Ergonomics and Environmental Control, School of Aeronautic Science and Engineering,
Beihang University, Beijing 100191, PR China
2 Institute of Engineering Thermophysics, Chinese Academy of Sciences, Beijing 100190, PR China
3 School of Chemical and Process Engineering, University of Leeds, Leeds, LS2 9JT, UK
Abstract: Extensive experimental studies of the heat transfer characteristics of jet impingement on a
variable-curvature concave surface in a wing leading edge were conducted for aircraft anti-icing applications. The
experiments were performed on a piccolo tube with three rows of aligned jet holes over a wide range of
parameters: the jet Reynolds number (Rej) from 50,000 to 90,000, the relative tube-to-surface distance (H/d) from 1.74 to 20.0, the jet impingement angle ( ) from 66° to 90°, and the relative chordwise arc length in the jet impingement zone (r/d) from 13.2 to 34.8. The experimental results indicated that the heat transfer performance at
the stagnation point was enhanced with increasing Rej and , and an optimal H/d existed to achieve the best heat
transfer performance at the stagnation point. It was found that the attenuation coefficient curve of the jet
impingement heat transfer in the chordwise direction exhibited an approximate bell shape with the peak located at
the stagnation point, affected only by r/d in the peak zone. In the non-peak zone, however it was affected
significantly by a variety of factors including Rej, H/d and r/d. Experimental data-based correlations of the Nusselt
number at the stagnation point and the distribution of the attenuation coefficient in the chordwise direction were
developed and validated, which can be used to predict the performance of a wing leading edge anti-icing system.
Keywords: jet impingement; heat transfer; wing anti-icing; experiment; correlation
* Corresponding author. Tel.: +86 10 8233 8600; Fax: +86 10 8233 8600
1 Introduction
Jet impingement promises excellent heat transfer performance, which has attracted worldwide interests for
decades. As an effective measure to enhance the local heat transfer coefficient, it has been applied in a wide
variety of fields, such as glass tempering, metal annealing, food and paper drying, and gas turbine blade and
electronics cooling [1-5]. Because jet impingement is a very complex heat and mass transfer process, which is
influenced by many parameters such as the shape and size of the nozzle, the nozzle layout, the nozzle to target
surface distance, the jet Reynolds number, the impingement angle and the curvature of impinging surface,
comprehensive experimental and theoretical studies have been conducted especially for jet impingement on a flat
or cylindrical surface [6-13].
In aeronautical engineering, anti-icing or de-icing system is generally used in both civil and military aircraft to
guarantee flight safety. The wing leading edge hot-air anti-icing system (WHAAIS) has been widely employed so
far, where jet impingement heat transfer of hot air introduced from the engine compressor and sprayed from the jet
holes on a piccolo tube is utilized to prevent the occurrence of icing on the external surface of a wing leading edge,
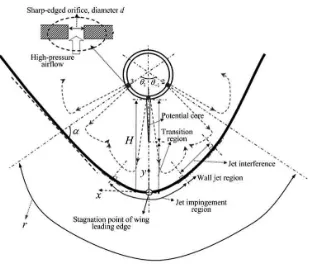
as shown schematically in Fig. 1 [14]. Fig. 2 shows the schematic of the jet impingement on a variable-curvature
concave surface in a wing leading edge hot air anti-icing system. Comparing to the common jet impingement on a
flat surface, there are some notable differences in a WHAAIS as summarized below: 1) the pressure of the hot air
supplied is usually very high, and the air in the jet holes is in the choked state with the outlet velocity reaching the
speed of sound; 2) the jet hole profile is very sharp, and the air at the outlet of the jet holes may be still under
expansion; 3) the piccolo tube usually has a single one, two or three rows of jet holes, and the circumferential
angle of jet holes on the piccolo tube can significantly affect the fluid flow and heat transfer processes on the
target surface; and 4) for piccolo tube with two or three rows of jet holes, the interaction of jets between adjacent
3
that on a cylindrical concave surface due to its continuous variable curvature character in the leading edge.
For the jet impingement heat transfer in a WHAAIS, only very limited experimental and theoretical studies has
been reported to date. Jusionis [15] reported perhaps the first experimental study of jet impingement heat transfer
on an enclosed surface in 1970. A piccolo tube with a single one row of jet holes was used in his study, and the
correlation of the average heat transfer coefficient over the target surface was obtained considering the influences
of the jet Reynolds number, the distance from the jet holes to the target surface and the circumferential angle of
the jet holes on the piccolo tube. Brown et al. [16] investigated the performance of a piccolo tube with three rows
of jet holes, and developed a correction of the average convective heat transfer coefficient on the jet impingement
region, where the distance between the jet holes and the jet Reynolds number were considered. The review from
Wright [17] suggested that Goldstein correlation [18] could be used for a first order estimation on the piccolo tube
performance
In 2003, by using the computational fluid dynamics (CFD) method, Fregeau, Saeed and Paraschivoiu [19]
studied the thermal performance of a 3-D hot air jet flow impinging on a normal semicircular concave surface
instead of the leading edge of an aircraft wing. The correlations of the average and stagnation Nusselt number
were obtained. In their study, only the layout of single one row of jet holes was considered. The average Nusselt
number was found to be remarkably dependent on the tube-to-surface distance. The maximum Nusselt number
occurred at the jet stagnation point, and the distance between adjacent jet holes had negligible effect on it. In 2008,
Saeed [20] conducted a simulation study to further understand the jet impingement heat transfer performance
employing a piccolo tube with single one row and two rows of staggered jet holes impinging on the internal
surfaces of a typical aircraft wing/slat. The 3-D distributions of the Nusselt number and heat transfer coefficient
on the target surface were illustrated, and the results showed that the jet impingement heat transfer performance
two rows of 10 degree staggered jet holes. In 2009, Fregeau, Paraschivoiu and Saeed [21] simplified the single
one row of jet holes as one-quarter of the jet to reduce the size of computational domain, and the simulation
results indicated that the local Nusselt number distribution on the surface was enhanced with the decrease of the
tube-to-surface distance and increase of jet Mach number and the distance between adjacent jet holes.
In 2006, Papadakis and Wong et al. [22-24] performed an extensive parametric study to investigate the
influence of tube-to-surface distance, jet hole location, the diffuser geometry, hot air temperature and mass flow
rate on the jet impingement heat transfer performance of a bleed air ice-protection system by both experimental
and numerical methods. The impinging surface simulated the NACA 23012 airfoil leading edge shape, and three
rows of aligned jet holes were manufactured on the piccolo tube in this study. It was found that once the air flow
in the jet holes was choked, air supply mass flux would have less influence on the anti-icing surface temperature
than that of the supplied air temperature, and the tube-to-surface distance and the jet hole locations on the piccolo
tube were critical in affecting the impinging surface temperature, however, the anti-icing cavity shape only
exhibited very small effect. The system performance variation trends in the chordwise direction as a function of
relevant parameters were also qualitatively presented.
Recently Imbriale and Ianiro et al. [25] reported the detailed temperature and heat flux distribution of a wing
leading edge upon impingement from a single row of jets by using the IR thermography and the heated thin foil
heat transfer sensor. The presence of streamwise vortices was observed, which was considered to be influenced by
the surface curvature, jet hole spacing and jet impingement angle, and an average Nusselt number correlation was
proposed based on the Meola’s correlation [26] for jet impingement on a flat surface. The authors have recently
reported an extensive experimental investigation of the jet impingement heat transfer characteristics on a
variable-curvature concave surface in a wing leading edge [27]. In the experiments, different jet hole layouts were
5
circumferential angle of jet holes on the piccolo tube were varied over a wide range. An optimal relative
tube-to-surface distance of 4.5 under Rej = 51021 was determined for the jet impingement with a single one row of
jet holes. It was observed that the Nux curves exhibited much different shapes for jet impingement with two and
three rows of aligned jet holes on the piccolo tube due to different intensities of interference between adjacent air
jets.
As briefly reviewed above, different jet impingement heat transfer correlations have been proposed mainly for
one row of jet holes, and the studies on impingement from two or three rows of jet holes on a piccolo tube are still
less established. For practical applications, jets from multiple holes are more effective for anti-icing applications
due to the increased heat transfer area in the wing leading edge. This paper reported an extensive experimental
study of the heat transfer characteristics of jet impingement on a variable-curvature concave surface in a wing
leading edge with three rows of aligned jet holes. A parametric study of the effects of the jet Reynolds number, the
relative tube-to-surface distance, the jet impingement angle and the relative chordwise arc length in the jet
impingement zone on the jet impingement heat transfer was conducted. Experimental data-based correlation
equations at the stagnation point and the attenuation coefficient distribution in the chordwise direction were
developed to advance our understanding on the design of a WHAAIS.
2 Experimental Setup
The experimental rig was the same as that in our previous paper [27], and only a brief introduction is provided
here. The experimental system was composed of an air supply system, a test unit including an anti-icing cavity
and piccolo tubes with three rows of aligned jet holes, a heating system and a data acquisition system. Interested
readers can find detailed information in Ref. [27].
In order to minimize the heat loss to the ambience, rubber sponge insulation material with the thickness of
which can be safely neglected. Type T thermocouple junctions were placed in the blind holes with a depth of
2.5mm in the outer surface and fixed by adhesives with good heat conduction and electrical insulation. Because
all the thermocouple wires were arranged outside the anti-icing cavity, the flow field in the cavity was not affected.
The thermocouple junctions were located only 0.5 mm from the inner surface of the leading edge, which could
represent the temperatures at the inner surface under the experimental conditions. The relevant parameter ranges
in the experiments are listed in Table 1, where Cn is the spanwise distance between adjacent jet holes.
3 Data processing and uncertainty analysis
The inverse heat transfer method was adopted in the experiment, i.e., heat was transferred to the wing anti-icing
cavity from the outside, just opposite to the actual situation. In order to investigate the flow and heat transfer in
the wing anti-icing cavity, the outer surface of the leading edge of the anti-icing cavity was heated under a
constant heat flux, and high pressure air with a fixed temperature of 300K was introduced into the cavity as a
cooling medium.
Based on the experimental principle in this paper, the local convective heat transfer coefficient can be
calculated as:
q h
T T
x
w x in
(1)
where q is the heat flux at the outer surface of the leading edge; Twx is the local temperature at the inner surface of
the leading edge and Tin is the inlet temperature of the supplied air.
In equation (1), the air temperature at the inlet of the piccolo tube (Tin) should represent the total temperature of
7
the anti-icing cavity in this experimental system. At the same time, for aircraft wing anti-icing applications, because the jet velocity is usually very large, i.e. at the sonic speed, and the tube-to-surface distance is not very long, i.e. < 40 mm, the effect of ambient heating to the air jet is very slight, and the calculated Nusselt numbers using the jet inlet temperature are acceptable for engineering design, as confirmed by our experimental results.
In addition, in the calculation of the local convective heat transfer coefficient, we did not take into account the
tangential thermal conduction in the wall, so the results obtained here would slightly deviate from the actual ones
to some extent. For practical applications as in this study, i.e., the anti-icing cavity model came from a real
regional plane, this approach is preferable to guide the anti-icing cavity design without considering the tangential
thermal conduction effect of the wall, which will make the design process more convenient.
The local Nusselt Number is expressed by equation (2):
x x
h d Nu
(2)
where d is the diameter of the jet hole and is the thermal conductivity of air.
The jet Reynolds Number is defined by Equation (3):
22
2 4 4
G d
N d G d G
Re N d N d
m m mj (3)
where Gm is the mass flowrate of air, N is the number of jet holes, is the density of air, and and are the
kinetic and dynamic viscosities, respectively.
In order to investigate the distribution characteristics of the local heat transfer performance in the chordwise
direction of the leading edge, a new parameter that shows the ratio of the local Nussel number, Nux, over the
stagnation value, i.e. the attenuation coefficient x, is defined in Equation (4):
x Nux/Nustag 100%
(4)
resistance, temperature and flow rate. The uncertainties of h, Nu and were calculated to be smaller than 5.0%.
4 Comparison and validation of the experimental results
To ensure the validity and reliability of the experimental results achieved in this work, a comparison with other
available experimental data was attempted. However due to the difference in the geometry, it is very difficult to
find an appropriate comparative case. The only similar example was from the work by Brown et al [16], who
experimentally investigated a full-scale, 2-D model of an aircraft nacelle anti-icing system. The profile of the
impingement surface as well as the operating conditions from Ref. [16] was quite similar to those in this work. Fig.
3 shows the comparison between our results and those from Brown et al. [16], where d = 1.5mm and H/d = 5,
while in our experiment, d = 2mm and H/d = 6.63. As shown in Fig. 3, our experimental results for averaged
Nusselt number exhibited a very similar trend with those from Brown et al.[16], with slightly smaller values
caused by a higher relative tube-to-surface distance in our experiment. Such a comparison shows the reliability of
the experimental results in this work.
5 Experimental Results and Discussions
Two aspects of the jet impingement heat transfer were considered in this part: the heat transfer performance at
the stagnation point and the attenuation distribution characteristics in the chordwise direction. For the first aspect,
the influences of the jet Reynolds number Rej, the relative tube-to-surface distance H/d and the jet impingement
angle on the stagnation Nusselt number, Nustag, were studied; and for the second one, the influences of the Rej,
H/d and the relative chordwise arc length in the jet impingement zone r/d on the distribution characteristics of the
attenuation coefficient x were investigated. Finally the correlations of the Nustag and x were acquired and
experimentally validated.
5.1 Effects of jet Reynolds number and relative tube-to-surface distance on Nustag
9
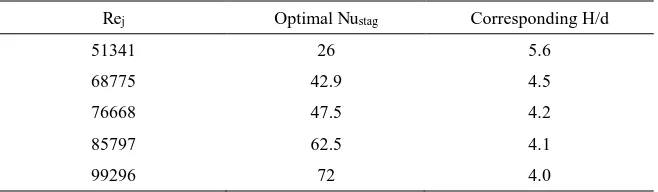
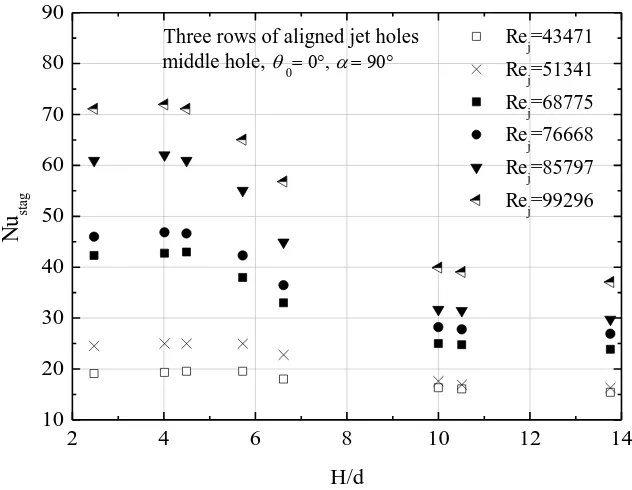
the higher the Nustag. While the effect of H/d on the Nustag under different Rej were almost the same, and there was
an optimal H/d to obtain the maximum Nustag. With the increase of Rej, the optimal H/d value decreased slightly,
as shown in Table 3. This phenomenon can be theoretically analyzed below. For a given Rej, when the
tube-to-surface distance was smaller than the length of the potential core, the jet arriving at the impinging surface
was not fully developed and the central velocity of the jet there would remain unchanged. As H/d decreased, the
travelling distance of the jet before arriving at the impinging surface decreased accordingly, and the shear-driven
interaction between the jet and the surrounding air was weakened, resulting in the drop of Nustag due to the
decrease of the jet turbulence level at the stagnation point. When the tube-to-surface distance was larger than the
length of the potential core, the jet would be fully developed before impinging onto the target surface. Under this
condition, the target surface was in the downstream of the jet potential core. As H/d increased, the travelling
distance of the jet before arriving at the impinging surface increased accordingly, and the momentum and velocity
in the jet core zone would decrease gradually due to the shear-driven interaction between the jet and the
surrounding air, resulting in a decrease of the heat transfer performance at the jet impingement stagnation point.
Therefore when the tube-to-surface distance was approximately equal to the length of the potential core, the best
heat transfer performance at the stagnation point could be obtained. However, the optimal H/d was generally not a
fixed value but fell within a range. That was attributed by the tradeoff between an increased jet turbulence due to
the interaction with the surrounding air and a decreased jet central velocity. Meanwhile, the length of the potential
core would vary with the jet Reynolds number. For example, Gardon and Cobonpue [28] found that the optimal
tube-to-surface distance was equal to the length of the potential core to achieve the best heat transfer performance
at the stagnation point on a flat plate. Whereas Ashforth-Frost and Jambunathan [29] showed that the optimal
tube-to-surface distance was 110% of the length of the potential core for a flat plate. It was because at that H/d
paper, the fluid flow and heat transfer of the jet impingement was more complex because the target surface was
a variable-curvature concave one in a wing leading edge, and the optimal H/d was found to be within 4 ~ 5.75.
5.2 Effect of jet impingement angle on Nustag
Fig. 5 shows the influence of the jet impingement angle on Nustag with different Rej at a fixed H/d =10. The jet
impingement angle exhibited a significant effect on the heat transfer performance of the jet impingement at the
stagnation point. For instance, Nustag was increased by 47.4% ~ 59.5% when = 90°, comparing with that when
= 66°. The effect of jet impingement angle was more notable at a larger Rej. Moreover, the effect of within 82° ~
90° on the Nustag was much stronger compared with that = 66° ~ 82°. Therefore, when the air jet was changed
from a vertical to an oblique jet, the Nustag would decreased rapidly until = 82°, after which the attenuation of
the Nustag became much slower.
When the air jet changes from a vertical to an oblique jet, the direction of the jet centerline was no longer
perpendicular to the impinging surface at the stagnation point, causing the decrease of the normal velocity
component at the stagnation point. The smaller the jet impingement angle, the lower the normal velocity
component at the stagnation point, which corresponded to a decreased heat transfer performance at the stagnation
point.
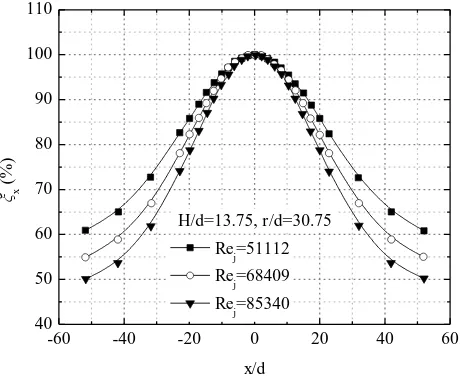
5.3 Effect of jet Reynolds number on x
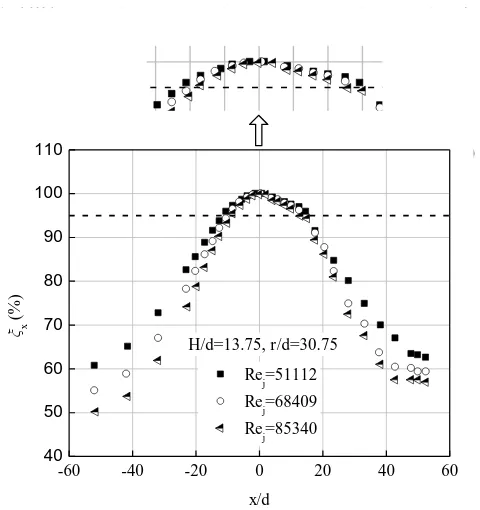
Fig. 6 shows the distribution of x in the chordwise direction of the wing leading edge with different Rej
numbers where the curves exhibited a bell shape attenuating from the stagnation point to both sides. The
negative-value zone on the abscissa x/d represents the lower surface of the anti-icing cavity, and the positive-value
zone represented the upper surface. From Fig. 6 it can be concluded that: 1) the distribution curves of x at both
sides of the stagnation point for three rows of aligned jet holes were obviously different, and the attenuation
11
specific anti-icing cavity structure as shown in Fig. 1, where the only slot for hot air venting was adjacent to the
upper surface, and the wall jet along the lower surface was strongly inhibited by the barrier wall. 2) The effect of
Rej on x in the peak region (x/d=±10) was very small, and the peak regions of the distribution curves of x
corresponding to different Rej almost overlapped. 3) Rej obviously affected x in the non-peak region of the
distribution curve, and the larger the Rej, the faster the attenuation rate of the x. When Rej was increased from
51112 to 85340, x on the lower surface at x/d=-50 decreased by nearly 11%.
5.4 Effect of relative tube-to-surface distance on x
Fig. 7 shows the distribution of the x in the chordwise direction of the wing leading edge with different relative
tube-to-surface distance H/d. It is observed that the effect of the H/d was very similar to that of Rej, i.e. the
influence of H/d on the x was very small in the peak region, and it became salient in the non-peak region on the
distribution curve. The smaller the H/d, the faster the attenuation rate of x. When the relative tube-to-surface
distance decreased from 13.75 to 6.63, x value on the lower surface at x/d=-52 dropped by about 8.5%.
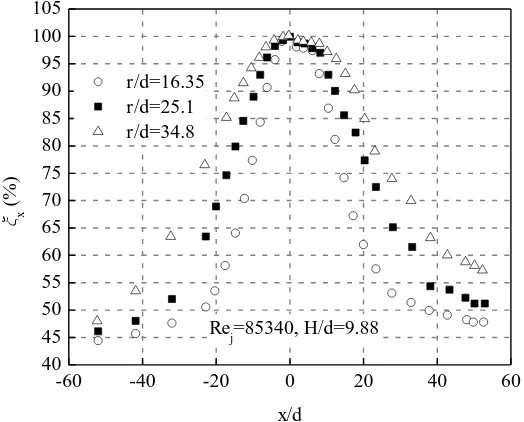
5.5 Effect of relative chordwise arc length in the jet impingement zone r/d on x
Fig. 8 shows the distribution of x in the chordwise direction of the wing leading edge with different relative
arc length r/d. It suggests that the effect of r/d on the x was much different from those of Rej and H/d. First, r/d
obviously affected x in the peak region on the distribution curve, and the larger the r/d, the higher the x in the
peak region on the distribution curve. Secondly, r/d also significantly affected x in the non-peak region. However,
on the lower surface of the anti-icing cavity far away from the stagnation point, the effect of r/d on the x became
much weakened compared with those of Rej and H/d. For instance, when r/d was increased from 16.35 to 34.8, the
variation of the x at x/d= -52 on the lower surface of the anti-icing cavity was within 3.0.
6 Experimental data-based correlation equations
Based on the experimental results, the correlation of the stagnation Nusselt number Nustag in terms of the jet
Reynolds number Rej, relative tube-to-surface distance H/d and jet impingement angle rad was obtained as
follows:
4 1.124 0.847 0.487
1.827 10 ( / )
Nu Re H d
j
stag rad (5)
The above correlation is valid for a wide range of parameters, i.e., 50,000 Rej 90,000, 1.74 H/d 20.0, 66° 90°, and the average difference between the calculated and experiment results was within 4.0%, as shown in Fig. 9.
6.2 Correlation of the attenuation coefficient
It is of high interest to propose a correlation for the attenuation coefficient x, to obtain quickly and accurately
the distribution characteristics of the jet impingement heat transfer in the chordwise direction if the correlation of
the stagnation Nusslet number is available. For the structure of three rows of aligned jet holes, the correlation of x
in terms of three dimensionless parameters Rej, H/d and r/d was established. As explained above, the x x/d
curve exhibited an approximate bell shape attenuating from the stagnation point to both sides along the upper and
lower surfaces of the anti-icing cavity. To neglect the effect of the slot structure on the heat transfer on the upper
surface, which made this issue much more complex, and on a basis of conservative design, the x x/d curve on
the upper surface was replaced by the one on the lower surface, thus forming a strictly symmetrical and
bell-shaped curve of x. The Gauss function expressed by Equation (6) was applied to fit the experimental data of
x. 2 2 ( ) 2 0 / 2 stag
x d x d
w x A e w
(6)
where 0 is the value of x at the farthest position from the stagnation point; xstag is the coordinate of the stagnation
point whose value is zero in the paper;
/ 2 A
w is the attenuation height Ha, which is equal to stag- 0; stag is
13
curve width at the half of the attenuation height Ha/2.
The attenuation coefficient M is defined asM2 w2
and Equation (7) was derived from Equation (6) as
follows:
2 2
( ) 0.5 0.5 0.5 0.5 ( )
x ( stag ) (100 )
stag
M x d x d M x d
H H e AM AM e
(7)
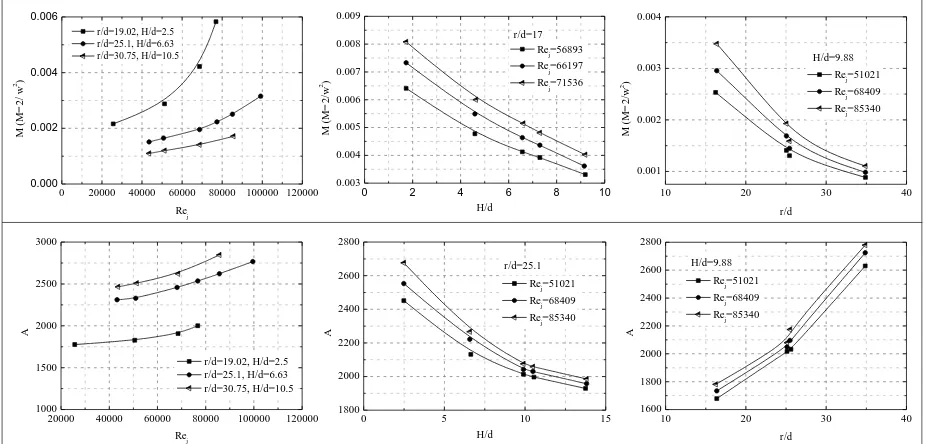
According to Equation (7), non-linear fitting technique was applied to fit the experimental data samples, each of
which yielded a certain A and M value, with the fitting correlation factor, R, ranging from 0.980 to 0.996. Further
analysis indicated that both M and A in Equation (7) were strong functions of Rej, H/d and r/d. As shown in Fig.
10, the unary effects of Rej, H/d and r/d on both M and A exhibited approximate exponential relationship, so
exponential functions were applied to fit M and A, respectively, in terms of Rej, H/d and r/d, as shown in
Equations (8) and (9), and the correlation factors were 0.96 and 0.98, respectively.
0.1320
2.11340.4970 j
0.009385
M Re H d r d (8)
0.1331
1.10950.1512 j
14.0566
A Re H d r d (9)
Substituting Equations (8) and (9) into Equation (7), Equation (10) was derived, which was applicable in the
following parameter ranges: 5.0×10⁴ Re
j 9×10⁴, 1.74 H/d 20.0 and 13.2 r/d 34.8.
0.19912 0.052781 0.19912 0.052781
0.39970 0.39970
j j
0.1320 2.1134 2
0.4970 j
100 0.76828 0.76828
exp 0.009385
x Re H d r d Re H d r d
Re H d r d x d
(10)
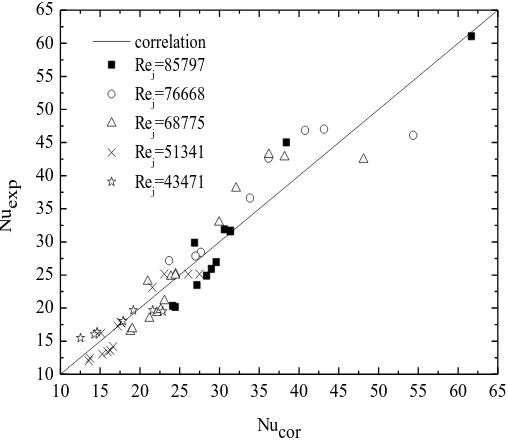
To validate the correlation of x, a comparison between the experimental data including both the sample and
non-sample data and the calculation results based on the correlation equation was conducted, as presented in Fig.
11. The deviations between the experiment data and the calculation results from the correlation were all lower
than 2.4%, indicating that the correlation was effective within the proposed parameter range. For this specific
structure, the correlation can accurately predict the distribution characteristics of the jet impingement heat transfer
in the chordwise direction on the surface of the anti-icing cavity, which is of great use to guide the design and
7 Conclusions
Extensive experimental studies of the heat transfer characteristics of jet impingement on a variable-curvature
concave surface in a wing leading edge were conducted in this work, which can be summarized as follows:
The Rej and H/d exhibited significant effects on the jet impingement heat transfer performance at the
stagnation point. The larger the Rej, the higher the heat transfer performance, and there existed an optimal
H/d corresponding to the maximum Nustag. For the experimental conditions in this work, the optimal H/d was
in the range of 4 ~ 5.75 with the structure of three rows of aligned jet holes on the piccolo tube.
Increasing jet impingement angle ( ) can enhance the jet impingement heat transfer performance at the
stagnation point. It was found that the Nustag decreased much faster with the decrease of the jet impingement
angle when 82° 90° than that when 66° 82°.
The distribution curve of the attenuation coefficient in the chordwise direction exhibited a bell shape. In the
peak region of the distribution curve, the attenuation coefficient was mainly affected by r/d, and the larger
the r/d, the higher the x in the peak region; while in the non-peak region, it was significantly affected by Rej,
H/d and r/d.
Based on the experimental data, correlations of the stagnation Nusselt number (Nustag) and the distribution of
the attenuation coefficient ( x) in the chordwise direction were developed and validated, which are applicable
to the following parameter ranges: 5.0 × 10⁴ Re
j 9 × 10⁴, 1.736 H/d 20.0, 66° 90° and
13.21 r/d 34.8.
As the piccolo tube-based anti-icing cavity design is well adopted by many aircraft engineers, especially for the
piccolo tube with two or three rows of jet holes, this work is of great help to the design and performance
evaluation of the aircraft wing leading-edge anti-icing system.
15
This work was supported by the National Natural Science Foundation of China (Grant No. 51206008) and the
EU Marie Curie Actions-International Incoming Fellowships (FP7-PEOPLE-2013-IIF-626576). The authors
would like to express our gratitude to Ying Zhou and Lu Xin from the Laboratory of Fundamental Science on
References
[1] T. S. O’Donovan, D. B. Murray, Jet impingement heat transfer - Part I: Mean and root-mean-square heat transfer and velocity
distributions, Int. J. Heat Mass Transfer 50 (2007) 3291-3301
[2] T. S. O’Donovan, D. B. Murray, Fluctuating fluid flow and heat transfer of an obliquely impinging air jet, Int. J. Heat Mass
Transfer 51 (2008) 6169-6179
[3] D.H. Lee, Y.S. Chung, S.Y. Won, The effect of concave surface curvature on heat transfer from a fully developed round
impinging jet, Int. J. Heat Mass Transfer 42(1999) 2489-2497
[4] D. Lytle, B. W. Webb, Air jet impingement heat transfer at low nozzle-plate spacings, Int. J. Heat Mass Transfer 37 (1994)
1687-1697
[5] G.M. Carlomagno, A. Ianiro, Thermo-fluid-dynamics of submerged jets impinging at short nozzle-to-plate distance: A review,
Experimental Thermal and Fluid Science 58(2014) 15-35
[6] E. Öztekin, O. Aydin, M. Avcı, Hydrodynamics of a turbulent slot jet flow impinging on a concave surface, Int. Commun. Heat
Mass Transfer 39 (2012) 1631-1638
[7] G. Yang, M. Choi, J. S. Lee, An experimental study of slot jet impingement cooling on concave surface: effects of nozzle
configuration and curvature, Int. J. Heat Mass Transfer 42 (1999) 2199-2209
[8] E. Öztekin, O. Aydin, M. Avcı, Heat transfer in a turbulent slot jet flow impinging on concave surfaces, Int. Commun. Heat
Mass Transfer 44 (2013) 77-82
[9] X. Yan, N. Saniei, Heat transfer from an obliquely impinging circular, air jet to a flat plate, Int. J. Heat Flui Flow 18 (1997)
591-599
[10] M. Attalla, M. Salem, Experimental investigation of heat transfer for a jet impinging obliquely on a flat surface, Exp. Heat
Transfer 28 (2015) 378-391
17 Sci. 13 (1996) 29-37
[12] C. Cornaro, A. S. Fleischer, R. J. Goldstein, Flow visualization of a round jet impinging on cylindrical surfaces, Exp. Therm.
Fluid Sci. 20 (1999) 66-78
[13] M. Fenot, E. Dorignac, J.-J. Vullierme, An experimental study on hot round jets impinging a concave surface, Int. J. Heat Fluid
Flow 29 (2008) 945-956
[14] P. Planquart, G.V. Borre, J.M. Buchlin, Experimental and numerical optimization of a wing leading edge hot air anti-icing
system, AIAA paper 2005-1277, 2005.
[15] V.J. Jusionis, Heat transfer from impinging gas jets on an enclosed concave surface, J. Aircraft, 7 (1) (1970) 87-88.
[16] J. M. Brown, S. Raghunathan, J.K. Watterson, et al., Heat transfer correlation for anti-icing systems. J. Aircraft 39(1) (2002)
65-70.
[17] W.B. Wright, An evaluation of jet impingement heat transfer correlations for piccolo tube application, AIAA paper 2004-62,
2004.
[18] R. J. Goldstein, A. I. Behbahani, K. Heppelmann, Streamwise distribution of the recovery factor and the local heat transfer
coefficient to an impinging circular air jet, Int. J. Heat Mass Transfer 29 (1986) 1227-1235.
[19] M. Fregeau, F. Saeed and I. Paraschivoiu, Numerical heat transfer correlation for array of hot-air jets impinging on
3-dimensional concave surface, J. Aircraft 42(3) (2005) 665-670.
[20] F. Saeed, Numerical simulation of surface heat transfer from an array of hot-air jets, J. Aircraft 45(2) (2008) 700-714.
[21] M. Fregeau, M. Gabr, I. Paraschivoiu and F. Saeed, Simulation of heat transfer from hot-air jets impinging a three-dimensional
concave surface, J. Aircraft 46(2) (2009) 721-725.
[22] M. Papadakis, S.J. Wong, Parametric investigation of a bleed air ice protection system, AIAA paper 2006-1013, 2006.
[23] M. Papadakis, S.J. Wong, H.W. Yeong, et al., Icing tunnel experiments with a hot air anti-icing system, AIAA paper 2008-444,
[24] M. Papadakis, S.J. Wong, H.W. Yeong, et al., Icing tests of a wing model with a hot-air ice protection system, AIAA Paper
2010-7833, 2010.
[25] M. Imbriale, A. Ianiro, C. Meola, et al., Convective heat transfer by a row of jets impinging on a concave surface. Int. J. Therm.
Sci. 75(2014) 153-163.
[26] C. Meola, A new correlation of Nusselt number for impinging jets, Heat Transfer Eng. 30(3) (2009) 221-228.
[27] X. Bu, L. Peng, G. Lin, L. Bai, et al., Experimental study of jet impingement heat transfer on a variable-curvature concave
surface in a wing leading edge, Int. J. Heat Mass Transfer 90 (2015) 92-101.
[28] R. Gardon, J. Cobonpue, Heat transfer between a flat plate and jets of air impinging on it, Int. Heat Transfer Conf. Pt. 2 (1961)
454-460.
[29] S. Ashforth-Frost, K. Jambunathan, Effect of nozzle geometry and semi-confinement on the potential core of a turbulent
19
Nomenclature
A attenuation coefficient
Cn spanwise distance between adjacent jet holes, m
cp pressure coefficient
d jet hole diameter, m
Gm Mass flowrate, g/s
hx local convective heat transfer coefficient, W/(m2 ∙ K)
H piccolo tube-to-surface distance, m;
Ha attenuation height
M attenuation coefficient
N number of jet holes
Nux local Nusselt number
Nustag stagnation Nusselt number
q heat flux, W/m2
r arc length between jet stagnation points, mm
Rej jet Reynolds number
Tin supplied air temperature, K
Twx local temperature on the internal surface of the wall, K
Greek symbols
jet impingement angle (°)
density, kg/m3
thermal conductivity, W/(m ∙ K)
v kinetic viscosity, m2/s
dynamic viscosity, Pa∙s
21
Table captions
Table 1 Parameter range in the experiments
Table 2 Uncertainties of measuring equipments
Figure captions
Fig. 1 Schematic of a typical wing leading edge hot-air anti-icing cavity
Fig. 2 Schematic of jet impingement on a concave surface from a piccolo tube
Fig. 3 Comparison and validation of the experimental results
Fig. 4 Influence of relative tube-to-surface distance on Nustag
Fig. 5 Influence of jet impingement angle on Nustag
Fig. 6 Influence of Rejon the x distribution in the chordwise direction
Fig. 7 Influence of H/d on the x distribution in the chordwise direction
Fig. 8 Influence of r/d on the x distribution in the chordwise direction
Fig. 9 Comparison between calculated and experimental results for stagnation Nusselt number
Fig. 10 Fitted curves of M and A in terms of Rej H/d and r/d
23
Table 1 Parameter range in the experiments
Parameters Range
Cn (mm) 50
d (mm) 2
H/d 1.74 ~ 20.0
r/d 13.2 ~ 34.8
66° ~ 90°
Rej 50000 ~ 90000
Table 2 Uncertainties of measuring equipments
Equipment Accuracy grade Measuring error
T Type thermocouple I ±0.004|T|
PT100thermal resistance II ±(0.30±0.005|T|)
Pressure transmitter II ±0.2%F.S
Standard 24-volt outlet II 0.2%
[image:24.595.134.463.539.635.2]air mass flow meter II ±0.2%F.S
Table 3 The maximum Nustag at corresponding H/d under different Rej
Rej Optimal Nustag Corresponding H/d
51341 26 5.6
68775 42.9 4.5
76668 47.5 4.2
85797 62.5 4.1
Fig. 1 Schematic of a typical wing leading edge hot-air anti-icing cavity
[image:25.595.141.453.366.630.2]25
40000 50000 60000 70000 80000
10 15 20 25 30 35 40 45 50
Experimental results in this paper, d=2.0mm, H/d=6.63
Experimental results from Brown et al (piccolo pipe 2), d=1.5mm, H/d=5.0
N
u avg
Re
[image:26.595.143.442.114.346.2]j
Fig. 3 Comparison and validation of the experimental results
2 4 6 8 10 12 14
10 20 30 40 50 60 70 80 90
middle hole, 0
Rej=43471
Rej=51341
Re
j=68775
Rej=76668
Re
j=85797
Rej=99296
N
u
stagH/d
Three rows of aligned jet holes
[image:26.595.132.448.430.675.2]65 70 75 80 85 90 10 15 20 25 30 35 40 45 50
= 82
Rej=51341 Re
j=68775
Rej=85797 Rej=102613
Three rows of aligned jet holes middle hole, H/d = 10
N
usta
g
[image:27.595.167.413.117.310.2]
Fig. 5 Influence of jet impingement angle on Nustag
-30 -25 -20 -15 -10 -5 0 5 10 15 20 25 30 90
100 110
x/d
-60 -40 -20 0 20 40 60
40 50 60 70 80 90 100 110 x (% ) x/d Re j=51112 Re j=68409
Rej=85340 H/d=13.75, r/d=30.75
[image:27.595.174.414.417.672.2]27
-30 -25 -20 -15 -10 -5 0 5 10 15 20 25 30 90
100 110
x/d
-60 -40 -20 0 20 40 60
40 50 60 70 80 90 100 110 x (% ) x/d H/d=6.63 H/d=10.5 H/d=13.75
[image:28.595.179.421.112.358.2]Rej=85340, r/d=30.75
Fig. 7 Influence of H/d on the x distribution in the chordwise direction
-60 -40 -20 0 20 40 60
40 45 50 55 60 65 70 75 80 85 90 95 100 105 x ( % ) x/d r/d=16.35 r/d=25.1 r/d=34.8 Re
j=85340, H/d=9.88
[image:28.595.159.421.446.657.2]10 15 20 25 30 35 40 45 50 55 60 65 10
15 20 25 30 35 40 45 50 55 60 65
correlation Re
j=85797
Re
j=76668
Re
j=68775
Re
j=51341
Re
j=43471
N
uex
p
[image:29.595.166.420.332.553.2]Nucor
29
0 20000 40000 60000 80000 100000 120000
0.000 0.002 0.004 0.006 M ( M = 2/ w 2) Re j r/d=19.02, H/d=2.5 r/d=25.1, H/d=6.63 r/d=30.75, H/d=10.5
0 2 4 6 8 10
0.003 0.004 0.005 0.006 0.007 0.008 0.009 M ( M = 2/ w 2) H/d
Rej=56893
Re
j=66197
Rej=71536
r/d=17
10 20 30 40
0.001 0.002 0.003 0.004 M ( M = 2/ w 2) r/d
Rej=51021
Re
j=68409
Re
j=85340
H/d=9.88
20000 40000 60000 80000 100000 120000
1000 1500 2000 2500 3000 A Re j r/d=19.02, H/d=2.5 r/d=25.1, H/d=6.63 r/d=30.75, H/d=10.5
0 5 10 15
1800 2000 2200 2400 2600 2800 A H/d
Rej=51021
Re
j=68409
Rej=85340
r/d=25.1
10 20 30 40
1600 1800 2000 2200 2400 2600 2800 A r/d Re j=51021
Rej=68409
Rej=85340
[image:30.595.59.522.235.457.2]H/d=9.88
-60 -40 -20 0 20 40 60 40
50 60 70 80 90 100 110
x
(
%
)
x/d Rej=51112
Rej=68409
Rej=85340 H/d=13.75, r/d=30.75
(a) sample experimental data
-60 -40 -20 0 20 40 60
40 50 60 70 80 90 100 110
x
(
%
)
x/d Equation (10) Experiment data Rej=85340, H/d=9.88
[image:31.595.176.406.145.333.2](b) non-sample experimental data