Differential gene expression according to race and host
plant in the pea aphid
I S O B E L E Y R E S , * J U L I E J A Q U IE R Y ,† A K I K O S U G I O ,‡ L U D O V I C D U V A U X , * K A R I M G H A R B I ,§ J I N G - J I A N G Z H O U ,¶ F A B R I C E L E G E A I ,‡ M I C H A E L A N E L S O N , * * J E A N - C H R I S T O P H E S I M O N ,‡ C A R O L E M . S M A D J A ,† †1 R O G E R B U T L I N *1 and J U L I A F E R R A R I * *1
*Department of Animal and Plant Sciences, University of Sheffield, Alfred Denny Building, Western Bank, Sheffield S10 2TN, UK,†CNRS UMR 6553 ECOBIO, Universite de Rennes 1, Avenue du General Leclerc, Campus de Beaulieu, 35042 Rennes Cedex, France,‡INRA, Institut de Genetique, Environnement et Protection des Plantes, UMR 1349 IGEPP, Domaine de la Motte, 35653 Le Rheu Cedex, France,§Edinburgh Genomics, Ashworth Laboratories, University of Edinburgh, Edinburgh, UK,
¶Department of Biological Chemistry and Crop Protection, Rothamsted Research, Harpenden AL5 2JQ, UK,**Department of Biology, University of York, York, UK,††Institut des Sciences de l’Evolution (UMR 5554 CNRS-IRD-CIRAD-Universite de Montpellier), Universite Montpellier 2, cc065, Place Bataillon, 34095 Montpellier Cedex 05, France
Abstract
Host-race formation in phytophagous insects is thought to provide the opportunity for local adaptation and subsequent ecological speciation. Studying gene expression dif-ferences amongst host races may help to identify phenotypes under (or resulting from) divergent selection and their genetic, molecular and physiological bases. The pea aphid (Acyrthosiphon pisum) comprises host races specializing on numerous plants in the Fabaceae and provides a unique system for examining the early stages of diversifi-cation along a gradient of genetic and associated adaptive divergence. In this study, we examine transcriptome-wide gene expression both in response to environment and across pea aphid races selected to cover the range of genetic divergence reported in this species complex. We identify changes in expression in response to host plant, indicating the importance of gene expression in aphid–plant interactions. Races can be distinguished on the basis of gene expression, and higher numbers of differentially expressed genes are apparent between more divergent races; these expression differ-ences between host races may result from genetic drift and reproductive isolation and possibly divergent selection. Expression differences related to plant adaptation include a subset of chemosensory and salivary genes. Genes showing expression changes in response to host plant do not make up a large portion of between-race expression dif-ferences, providing confirmation of previous studies’ findings that genes involved in expression differences between diverging populations or species are not necessarily those showing initial plasticity in the face of environmental change.
Keywords: gene expression, host adaptation, pea aphid, plant–insect interactions, speciation, transcriptome
Received 22 May 2015; revision received 7 July 2016; accepted 11 July 2016
Introduction
Understanding how natural selection acts on genetic vari-ation to facilitate adaptvari-ation to different environments is a
central question in evolutionary biology. Host-race for-mation in insects provides many useful examples in which to study local adaptation and has long been a focus of speciation research (Dres & Mallet 2002; Bush & Butlin 2004; Forister et al. 2011). The huge species richness of many insect groups is associated with spe-cialization by individual species on very limited ranges of host taxa (Farrell 1998) implying that a combination Correspondence: Isobel Eyres, Fax: +44 (114) 222 0002;
E-mail: [email protected]
1Joint last author.
of cospeciation with hosts and speciation via host-switching (Weiblen & Bush 2002) are major drivers of diversity. Host races, genetically distinct populations adapted to different host species but still exchanging genes, provide excellent models for understanding the selection pressures and genetic changes involved in adaptation to new hosts and the consequent evolution of reproductive isolation.
Measures of gene expression can provide an impor-tant bridge between genotype and phenotype (Huestis & Marshall 2009), and expression profiles provide many more phenotypes than can easily be documented through morphological or behavioural analysis (Pavey et al.2010). In recent years, the study of gene expression has been greatly facilitated by high-throughput sequencing-based methods such as RNA-Seq (Mortazavi et al. 2008), and the analysis of gene expression now has the potential to contribute to the understanding of the genetics of both local adaptation and speciation.
Comparative gene expression studies enable the iden-tification of biological functions involved in the adapta-tion of organisms to their surrounding environments. Gene expression can also provide a novel source of information on the extent and nature of divergence between species (Khaitovich et al. 2004) or between populations that experience partial reproductive isola-tion (Wolfet al.2010). Gene expression differences may result from drift, but unusually strong differentiation in expression could indicate divergence under selection, analogous to genome scans based on allele frequencies (Roberge et al. 2007), and there may be more opportu-nity to associate expression outliers with adaptive traits than for the anonymous markers used in many genome scans. In a few cases, loci of major effect that operate via control of expression have been identified (Chan et al.2010). Where expression patterns are environment-dependent, divergence may be especially informative about ecological speciation (Paveyet al.2010).
The clearly defined yet often spatially intermingled habitats represented by host plants provide examples of divergent selection that illuminate the process of local adaptation particularly clearly (Dres & Mallet 2002). Genomic analyses in some systems have begun to pro-vide insights into the genetic architecture of divergence. For example, in the apple maggot fly, Rhagoletis pomo-nella, targets of selection during adaptation to the novel apple host appear to be genomically widespread (Michelet al.2010), perhaps because divergence in mul-tiple traits is needed. Many loci also appear to be under selection in the walking stick, Timema cristinae, some associated with habitat components other than host plant (Gompertet al.2014; Soria-Carrascoet al.2014). A role for gene expression changes during local adapta-tion has been highlighted by Raglandet al.(2015), who
found both a plastic response and genetically based adaptations enhancing host-associated fitness differ-ences.
The pea aphid, Acyrthosiphon pisum, was the first aphid species to have its genome sequenced (The Inter-national Aphid Genomics Consortium 2010). In Europe, at least 15 genetically distinct populations (races) are reported, each associated with one or a few species of the Fabaceae. Several of these races are found in sympa-try from Europe to Japan, and some have also been introduced in South and North America (Via 1991; Pec-coud et al. 2008, 2009a). These 15 races form a contin-uum of levels of isolation from those producing around 10% F1 hybrids up to highly genetically differentiated host races (FST>0.8 in sympatry) that probably
experi-ence no current gene flow (Peccoud et al.2009a, 2015). There is evidence that these races have diverged recently, possibly at around the time of the Neolithic expansion of farming (Peccoud et al. 2009b). Despite overlapping host plant ranges (Peccoud et al. 2009a), this results in assortative mating since host races feed, multiply and reproduce sexually on their specific plants, and offers opportunities for the evolution of reproductive isolation.
Whiteman & Pierce 2008). Their mode of evolution under a birth-and-death model and evidence for posi-tive selection in some branches of these multigene fami-lies suggest rapid and adaptive evolution in specialized lineages of insects including aphids (Matsuo 2008; Smadja et al. 2009; Schymura et al. 2010; Zhou et al. 2010; Briscoeet al. 2013). In the pea aphid, population-based studies also revealed the potential role of chemosensory genes in host plant specialization and the ability of these genes to evolve quite rapidly at smaller evolutionary scales, by means of divergent selection (Smadjaet al.2012) and copy number variation amongst specialized races (Duvaux et al. 2015). However, the rapid evolution of chemotactic behaviours involved in host plant specialization and/or mate choice in the pea aphid could also be driven by regulatory changes. Indeed, some studies identify a role for regulatory changes at OBPs and ORs in host plant choice in Droso-phila sechellia specialized on Morinda fruit, showing some downregulated or upregulated genes in this spe-cialized species (Kopp et al. 2008; Dworkin & Jones 2009), and that a 4-bp insertion in the regulatory region of Obp57e may be involved in host plant specialization (Matsuo et al. 2007). These two classes of genes, chemosensory genes and genes for salivary proteins, are important candidates because of their potential roles in plant–aphid interactions (Simon et al. 2015). While sev-eral gene families have potential for influencing host plant recognition and speciation in the pea aphid system, here we focused on these two functional categories.
While puncturing plant cells with their stylets, aphids are thought to sample plant cell contents and also secrete saliva containing various proteins (Miles 1999; Tjallingii 2006; Carolanet al.2009). As salivary proteins come into direct contact with plant cells, they have been hypothesized to function like virulence proteins of microbial pathogens (effectors), suppressing host plant defence mechanisms to facilitate aphid feeding (Kaloshian & Walling 2005; Dogimont et al. 2010; Hogenhout & Bos 2011; Elzinga et al. 2014). It is also hypothesized that some aphid saliva proteins might eli-cit plant defence reactions in specific plant species; indeed, several studies have shown that aphid saliva or saliva proteins promote or reduce aphid fitness (Will et al.2007; Muttiet al.2008; De Vos & Jander 2009; Bos et al.2010; Atamian et al.2012). Furthermore, some sali-vary proteins have been shown to promote aphid colo-nization in a plant-specific manner, and the genes encoding these aphid saliva proteins are under positive selection (Pitino & Hogenhout 2013), suggesting that they may play a role in adaptation to host plants.
To be able to detect differences in gene expression at lowly expressed genes such as chemoreceptor genes (Shiao et al. 2013) while still gaining insight into other
possible genes implicated in host acceptance in the pea aphid, we have deeply sequenced the entire transcrip-tome of pea aphid heads using RNA-seq (Wang et al. 2009). Using multiple aphid clones from each of six host races along the continuum of divergence, we have examined gene expression both on their collection host and on a ‘universal’ host, Vicia fabaused as a common garden. This large-scale sequencing approach has allowed us to test for expression variation between races when all aphids are reared on the same host plant species (universal host), the changes in gene expression when a clone is reared on its collection host compared to the universal host, and the interaction between these two, that is the differences between races in the way they respond to the change of host plant. As ‘home’ environment is different in each race, we aim to identify expression changes underlying the ability of each race to cope with their unique host environment, and as the difference in environment between Vicia faba and ‘home’ plant is not constant across races, we would expect to identify a strong interaction effect. In addition to analysing overall patterns of expression, we have specifically examined expression of salivary and chemosensory genes.
Materials and methods
Aphid collection and rearing
Pea aphids reproduce asexually from spring to autumn in temperate zones, so it is possible to obtain natural clones from individual aphids. For each aphid race, sev-eral genotypes (clones) were derived from single asex-ual aphids collected in the field in Southern England (May–July 2003 or May and August 2010). The aphids were collected fromMedicago sativaL., Lotus peduncula-tus Cav.,Lotus corniculatus L., Pisum sativum L., Ononis spinosa L. or O. repens L. and Lathyrus pratensis L. (Table S1, Supporting information). Races associated with these hosts are situated along a continuum from least to most genetic divergence as described by Pec-coudet al.(2009a). Aphids from the same plant species were collected at least 30 m apart to avoid collecting the same genotype twice. Clones collected from a par-ticular host plant do not necessarily belong to the race associated with that host because there is some move-ment of aphids between hosts and the possibility of clones of hybrid origin. We used assignments from Duvaux et al. (2015) based on SNP and microsatellite data, and retained aphid clones whose genotypes were correctly assigned to their respective race-associated genetic cluster (Table S1, Supporting information).
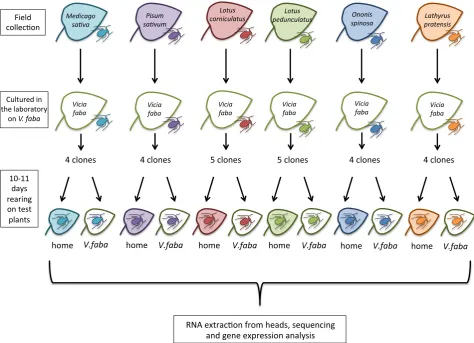
were reared at 15°C, 60% r.h. and a 16-h light: 8-h dark cycle. Most pea aphids perform well onV. faba: aphids’ acceptance, survival and fecundity are uniformly higher on their home plant and on V. faba than on nonhome plants (Ferrariet al.2008), and as such, it is considered as ‘universal host’ (Sandstr€om & Pettersson 1994; Fer-rariet al., 2006; Ferrariet al., 2008).
For expression experiments, each aphid clone was reared on the plant species that it was collected from (‘home’, for Ononis we used O. spinosa) or on V. faba (‘Vicia’) (Fig. 1). The plants had been grown in a green-house for 6 weeks for most plant species, except for the P. sativumplants, which were three weeks old, and the V. faba plants, which were two weeks old. Wingless adult females were taken from the culture on V. faba and transferred to Petri dishes that contained a leaf of the test plant species in 2% agar. After 24 h, up to 15 offspring were transferred to a potted test plant and kept at 20°C, 60% r.h. and a 16-h light: 8-h dark cycle. At 10–11 days old, aphids were collected from the plant, immediately flash-frozen and stored at 80°C until dissection. This procedure was repeated two to three times per clone/test plant combination, and these repeats were separated by several weeks to reduce the probability that differences between aphid clones were due to environmental variation. All samples per clone/ test plant species combination were pooled in the RNA extractions.
Dissection and RNA extraction
We analysed gene expression in aphid heads as we were chiefly interested in salivary and chemosensory genes. Dissections were conducted on ice to prevent thawing. Heads were dissected from all frozen samples by cutting behind the first pair of legs and then remov-ing the legs. This ensured that the salivary glands were included in the sample. Typically, the RNA of 20 heads from wingless adult aphids per clone/test plant combi-nation was extracted and pooled for RNA-seq analysis. RNA extractions were performed using the Macherey– Nagel NucleoSpin RNA II kit (Macherey–Nagel, Duren,€ Germany), following the manufacturer’s instructions. The quality of the RNA samples was checked using an Agilent Bioanalyzer 2100 (Agilent Technologies, Santa Clara, CA, USA).
Sequencing
Barcoded RNAseq libraries were prepared using Illu-mina TruSeq RNA Sample Prep Kit version 2 (non-strand-specific) using 1lg of total RNA input and 10 PCR cycles, as per the manufacturer’s recommenda-tions. Final libraries were quantified by qPCR and
combined into 6-plex pools prior to sequencing. Each pool was run across one HiSeq 2000 lane, using 75-bp paired-end reads (version 3 chemistry). Library prepara-tion and sequencing were carried out at Edinburgh Genomics (University of Edinburgh, UK). Libraries that did not pass Edinburgh Genomics’ quality threshold were resequenced (in two additional sequencing runs, Table S1, Supporting information).
Read mapping
Reads were quality-trimmed using the programs SICKLE andSCYTHE (https://github.com/najoshi/sickle, https:// github.com/vsbuffalo/scythe), using a quality cut-off of 20 and retaining sequences longer than 50 bp. Sequences containing Ns were discarded. Reads were mapped to the pea aphid reference genome (M. sativa-associated strain; IAGC, 2010). The reads from each library were mapped separately using version 2.08 of TopHat2 (Kim et al. 2013), a mapper that handles spliced-read alignments, that is reads mapping over exon/intron junctions, with default parameters except for the following options (-g 1, -no_mixed, –no-discor-dant). The number of reads mapped to each gene from the Official Gene Set annotation from AphidBase (Legeai et al. 2010) was calculated by summing each read that overlaps at least one exon of any particular gene (script available on Dryad upon publication). Mul-timapped reads (reads mapping to multiple locations in the genome) can sometimes be an issue when measur-ing expression and can particularly affect genes belong-ing to multigene families such as our candidate genes (Robert & Watson 2015). However, in our case, chang-ingTopHat2parameters to allow reads to map to multi-ple locations did not affect downstream results, so we therefore kept our original TopHat2 settings for subse-quent analyses. There was no strong bias in mapping for nonreference races, in fact counts from mapping marginally increased in samples more distantly related to the reference genome (Spearman’s rho = 0.056, P<0.05).
Sample selection, filtering steps and expression patterns amongst samples
Gene Set corresponding to rRNA sequences (589) were excluded from further analysis, leaving 36 401 genes.
Normalization of expression data
Differential expression analyses were performed using the DESEQ2 package (version 1.2.10; Love et al. 2014) implemented in the R statistical software (version 3.0.2; R Development Core Team 2013). There are numerous analytical methods available for detecting differential expression in RNA-seq data (e.g. Smyth 2005; Hard-castle & Kelly 2010; Robinsonet al.2010; Tarazonaet al. 2011), and there is little consensus on which is most robust (high true positive rate, low false positive rate and low false negative rate). Seyednasrollah et al. (2015), Schurch et al. (2016) and Soneson & Delorenzi (2013) all conclude that the best method is highly dependent on experimental design, and DESeq2 (Love et al. 2014) and other methods based on the negative binomial are often found to be an appropriate choice with <5 replicates per condition. Rocke et al. (2015)
found an inflated false positive rate using negative binomial methods, especially for genes with high expression and/or dispersion, but as we were most interested in candidate genes with typically very low expression levels we considered DESeq2 an appropriate choice of analytical method here.
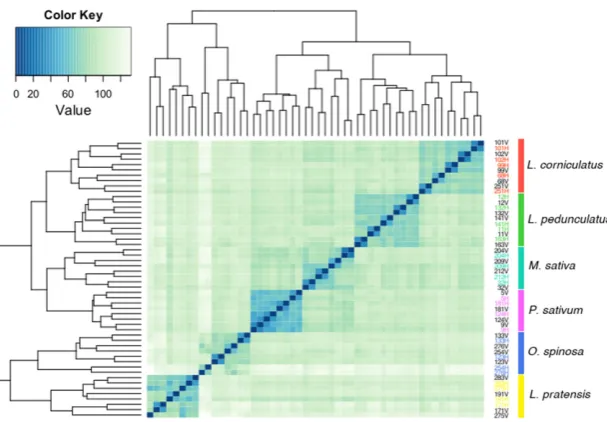
To ensure that no outlier samples (sequencing libraries with experimental irregularities rendering them unhelpful in detecting differentially expressed genes) were included in the final analyses, sample qual-ity was assessed by clustering based on similarqual-ity of expression. Sample-to-sample distances were visualized using a heatmap with hierarchical clustering (Fig. 2). A principal components analysis (PCA) was used to con-firm the absence of sequencing batch effects (Fig. S1, Supporting information), and guided PCA using the GPCApackage in R (GPCAversion 1.0) found no evidence for a statistically significant effect of sequencing batch (delta=0.98, P=0.385). Count data were normalized using DESeq2 default settings (Love et al.2014). Shared information across genes was used to calculate
[image:5.595.54.529.70.413.2]dispersion estimates (within-group variability) as described in Love et al. (2014). Normalization size fac-tors are recorded in Table S1 (Supporting information), and count data before and after normalization are shown in Fig. S2 (Supporting information). Details of DESeq2 methods and settings can be found in supplementary file 1.
Differential expression analyses
Differentially expressed genes were called by imple-menting generalized linear models in DESeq2. Indepen-dent filtering was employed using the genefilter package (Gentleman et al. 2011) in DESeq2, which removes very low expression genes on the basis of mean normalized counts, optimizing the number of genes with an adjustedP-value<0.1.
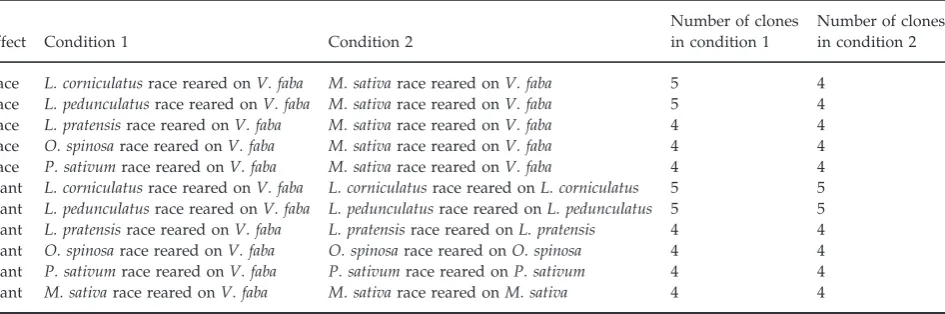
To identify genes differentially expressed between different races ofA. pisum, we used only aphids grown on V. faba as a common garden. We compared gene expression in samples from theM. sativa-associated race to expression in each other race in turn (Table 1); con-trasts were evaluated using Wald tests, and P values were adjusted for multiple testing using the Benjamini– Hochberg procedure (FDR P<0.05) (Benjamini & Hochberg 1995). The M. sativa-associated race makes a suitable baseline for contrasts as the reference genome used here for mapping and counting sequencing reads was of this race (IAGC 2010).
To identify genes differentially expressed in response to plant type, gene expression was compared between aphids grown on their home plants and those grown on V. faba, for each race in turn (Table 1). Plant response was not examined across all races at once because,
although the V. faba condition was consistent across races, home plant is by definition different in each race and it may not be appropriate to consider them as equivalent. Within each race, a likelihood ratio test was used to compare the full model (~clone+plant) to a reduced model with plant removed (~clone), andP val-ues were adjusted for multiple testing using the Ben-jamini–Hochberg procedure (FDRP<0.05).
Genes that respond differently to plant conditions in different races represent a particularly interesting set since they show a lineage-specific response to environ-ment (comparing Vicia faba with their home plant). To identify genes differentially expressed between plant con-ditions in a way that was dependent on race, all 52 sam-ples were analysed, and a likelihood ratio test was used to compare a model containing the interaction term plant: race (~ clone + plant + race + plant:race) to a reduced model (~ clone +plant + race) without the interaction term, and P values were adjusted for multiple testing using the Benjamini–Hochberg procedure (FDRP<0.05). Genes differentially expressed between plant conditions in a way that differed in each individual race were identi-fied by fitting the model clone+plant+race+plant:race and then using Wald tests to determine whether the log2-fold change for ‘home plant’ over ‘Vicia’ was different between races;Pvalues were adjusted for multi-ple testing using the Benjamini–Hochberg procedure (FDRP<0.05).
Functional annotation and gene ontology (GO) category enrichment
Gene ontology (GO) annotations from theA. pisum gen-ome were retrieved from AphidBase (http://
[image:6.595.64.368.66.277.2]www.aphidbase.com) and matched to the expressed genes. In total, 11 412 of the 36 401 expressed genes received GO annotations (Table S5, Supporting informa-tion). Blast2GO (Conesaet al. 2005) was used to imple-ment Fisher’s exact tests for enrichimple-ment of GO categories in each set of differentially expressed genes, using default settings. REVIGO (Supeket al.2011) was used to summa-rize enriched GO categories for plant-effect and race-effect differentially expressed genes, using default parameters.
Analyses of salivary and chemosensory gene families
A list of 307 candidate salivary genes (Table S2, Sup-porting information) was compiled by taking all sali-vary genes identified in seven publications (Harmel et al.2008; Carolan et al.2009, 2011; Boset al.2010; Ata-mianet al.2012; Jaquieryet al.2012; Elzinga et al.2014) and identifying their corresponding sequences (or their orthologues’ sequences) in the 36 401 genes present in our RNAseq libraries. Carolanet al.(2011) used ACYPI identification numbers (see www.aphidbase.com) from the v1 annotation of the pea aphid genome; we identi-fied corresponding ACYPI numbers in the v2 annota-tion of the genome using BLASTP (Altschul et al. 1990), retaining the best hit with ane-value cut-off of 1e 20. It was not possible to assign v2 ACYPI numbers to 11 of the genes identified in the seven publications. The TMH-MMalgorithm version 2.0c (Krogh et al.2001) was used to predict transmembrane domains in the salivary gene catalog created by Carolanet al.(2011), and 65 proteins with predicted transmembrane domains in addition to their signal peptides were not included in the final gene set as they are most likely not secreted in saliva.
A list of 113 candidate chemosensory genes (Table S2, Supporting information) was produced by identifying genes in our expression data set corresponding to odor-ant receptor (OR) and gustatory receptor (GR) genes
listed in Smadja et al. (2009), odorant binding protein (OBP) and chemosensory protein (CSP) genes listed in Zhou et al. (2010) and ionotropic glutamate receptor (IR) and sensory neuron membrane protein (SNMP) genes listed in Duvauxet al.(2015).
The twelve sets of differentially expressed genes iden-tified using DESeq2 [between each race and the M. sativa reference race (5), between hosts within race (6) and those with significant plant:race interaction (1)] were used to perform the following tests for the rela-tionship between the salivary and chemosensory candi-date gene sets and differential expression.
Categorical test: was there a significant over-representation of differentially expressed genes in candidate gene cate-gories?. As it is easier to identify highly expressed genes as significantly differentially expressed, we expected a bias towards detection of differentially expressed genes in categories with an over-representa-tion of highly expressed genes (Oshlack & Wakefield 2009; Young et al. 2010). Although mean normalized expression of chemosensory genes across races did not differ significantly from that of nonchemosensory genes (Mann–WhitneyU-test, W=2 098 210,Pvalue=0.667), it did differ significantly between salivary and non sali-vary genes (Mann–Whitney U-test, W=1 288 540, P value<2.2e 16), so it was necessary to take expression bias into account.
The bioconductor package GOSEQ (Young et al. 2010) was used to incorporate an expression bias correction. GOSEQwas implemented in R (version 3.1.0) (R Develop-ment Core Team 2005) using a standard protocol; chemosensory and salivary categories were defined as described above, the means of log2-normalized
[image:7.595.61.534.84.241.2]sequence counts were used for bias data, differentially expressed genes were those with an adjusted P value≤ 0.05, and the Wallenius distribution was used
Table 1 Summary of pairwise differential expression comparisons undertaken
Effect Condition 1 Condition 2
Number of clones in condition 1
Number of clones in condition 2
to approximate the null expectation of identifying dif-ferentially expressed genes in candidate categories.
Continuous test: was the magnitude of log-fold change in expression significantly greater in candidate genes than in noncandidate genes?. Genes with low counts have exag-gerated fold changes, which causes bias in continuous tests comparing magnitude of expression differences between categories of genes (Oshlack & Wakefield 2009). If the candidate gene set has a bias to low expres-sion transcripts, we would expect a higher mean fold change in candidate genes by virtue of this, which would lead to an overestimation of fold change bias in candidates unless accounted for.
To account for expression differences between cate-gories, count data were transformed using the regularized log-transformation in DESeq2 (Loveet al.2014). The regu-larized log-transformation log-transforms the average across samples of each gene’s normalized count and then shrinks the log-normalized counts towards the log aver-ages, applying greater shrinkage to genes with weaker expression (Loveet al.2014). This compensates for the rela-tively higher variability expected in low expression genes.
Mann–Whitney U-tests were used to assess whether candidate genes had significantly higher log-fold changes in expression in comparison with noncandidate genes. As magnitude of expression differences showed a ten-dency to differ in only up- or downregulated genes rather than both (i.e. magnitude of log2-fold change showed a skewed distribution), genes were split into up-and downregulated for each test (in the plant-effect com-parison in relation to expression in aphids grown on V. fabaand in comparisons of races in relation to expres-sion in theM. sativarace).
Results
Overall patterns of expression
Of the total 36 401 genes with mapped reads, a mean of 25 196 genes were expressed per RNA sample (69.2%), while 15 676 expressed genes were common to all 52 samples (43.1%) and 1282 genes were expressed in sam-ples from one race only. A mean of 85.5 genes from the chemosensory gene set (0.87 SE) were expressed in each RNA sample, and 98 chemosensory genes were expressed in every race (86.7% of chemosensory genes). A mean of 298.0 genes from the salivary gene set (0.23 SE) were expressed in each RNA sample, and 299 vary genes were expressed in every race (97.7% of sali-vary genes). No salisali-vary or chemosensory genes were expressed only in a single race.
Aphid samples showed more similarities on the basis of race than they did in terms of the plant on which
they were grown (Fig. 2), and home and ‘Vicia’ conditions of the same clone mostly clustered together, illustrating this strong clonal effect. However, some expression differences between individuals reared on different plants were also evident (Fig. S3, Supporting information).
Race effect
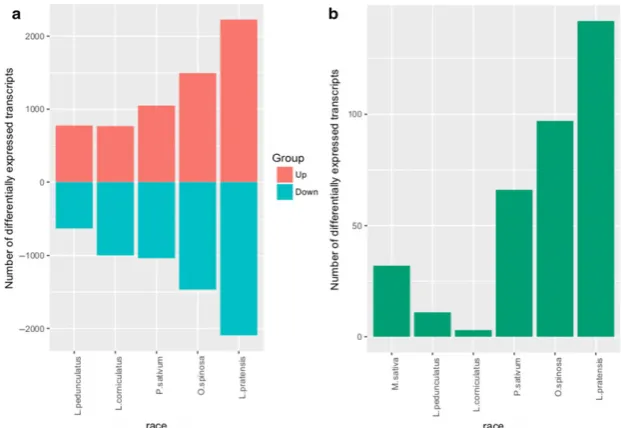
In the subset of aphids reared onV. faba, we compared expression in each race in turn to that in theM. sativa-associated race, aiming to reveal genes related to differ-ences between host-associated races independent of dif-ferences related directly to the plant they were reared on. Relative to the M. sativa-associated race, between 1 406 and 4 322 genes per race were differentially expressed (adjusted P value≤0.05; Fig. 3a). The num-ber of differentially expressed genes increased with increasing genetic distance between races (Peccoudet al. 2009a). If sequence divergence interfered with read mapping, we might expect a bias towards apparently underexpressed genes in the more distant comparisons. However, no such trend was observed (Fig. 3a).
Plant effect
Genes differentially expressed between aphids grown on their home plant and on V. faba were identified in each race in turn (Table 2). These genes relate to the plastic response of aphids to the plant that they are reared on, a response that may differ genetically between races. The number of genes differentially expressed between aphids reared on the home plant and those reared onV. fabaranged from 164 to 554 (ad-justed P value≤0.05), with no consistent tendency towards up or downregulation onV. faba compared to the home plant.
Interaction effect—genes for which the response to host plant varies between races
The expression of eight genes was better described by the inclusion of a plant:race interaction term in the model~clone+plant+race+plant:race in comparison with the reduced model~clone+plant+race (adjusted Pvalue≤ 0.05). These eight genes show significant vari-ation in responses to plant amongst the six aphid races.
comparing race-effect genes, aphids from the cluster of more closely related races (i.e.M. sativa, L. pedunculatus and L. corniculatus) had fewer race-specific plant-response genes, while races with increasing genetic dis-tance from this cluster (in order of increasing disdis-tance: P. sativum,O. spinosaandL. pratensis) had an increasing number of race-specific plant-response genes.
Details of all differentially expressed genes (plant, race and interaction) can be found in Table S3 (Support-ing information).
Enrichment of functional gene categories
GO terms associated with differentially expressed genes are shown in supplementary Fig. S4 (Supporting infor-mation). Fisher’s exact test was used to test for enrich-ment of GO categories in each of the eleven race- and
plant-associated lists of differentially expressed genes (FDRP <0.05). GO term enrichment analysis identified 41 over-represented GO terms amongst the differentially expressed gene sets. Enriched GO terms for plant-effect and race-effect differentially expressed genes are dis-played according to ‘biological process’ and ‘molecular function’ in supplementary Figs S5 and S6 (Supporting information), respectively. ACYPI20394, the only one of the eight genes showing significant interaction between plant and race to have a BLASTP hit in the GENBANK nr database, is similar to anA. pisumperoxidasin homolog (XP_003243661.1,BLASTPe-value=4e 97).
Differential expression of candidate genes
The majority of salivary and chemosensory genes dif-ferentially expressed in the pairwise comparison of
[image:9.595.52.363.69.283.2]Fig. 3(a) Number of differentially expressed genes over- or underexpressed in each race relative to theM. sativa- asso-ciated race (padj<=0.05). Races are ordered according to genetic distance from the M. sativa-associated race. (b) Number of genes in each race whose expression response to host plant dif-fered significantly from mean expression response across all races.
Table 2 Genes differentially expressed in aphids reared on their home plant in comparison with expression onV. fabain each host-associated race. Total differentially expressed genes are shown in the top row (bold). Underneath are the number of differentially expressed genes present in pairwise comparisons between races
Races M. sativa L. pedunculatus L. corniculatus P. sativum O. spinosa L. pratensis
Total DE[up/down] 345[253/92] 164[77/87] 492[87/405] 554[232/322] 390[244/146] 228[145/83] Shared DE
L. pedunculatus 29 — — — — —
L. corniculatus 100 19 — — — —
P. sativum 51 47 33 — — —
O. spinosa 58 46 99 37 — —
[image:9.595.54.538.374.479.2]each race with the M. sativa-associated race were only identified in a single pairwise race comparison (Table S4, Supporting information). Except for the P. sativum associated race, which had more differen-tially expressed salivary genes (40) than either the L. pratensis or the O. spinosa aphid races, the number of differentially expressed candidate genes relative to the M. sativa-associated race increased with increasing divergence between the aphid races. The majority of salivary and chemosensory genes differentially expressed in the pairwise comparison between ‘home’ and ‘Vicia’ were differentially expressed in a single race (Table S4, Supporting information), and no sali-vary or chemosensory genes were differentially expressed between ‘home’ and ‘Vicia’ conditions in all six races.
Candidate gene enrichment
Are candidate genes significantly over-represented amongst differentially expressed genes?. Genes differentially expressed between different races were significantly enriched for the set of 307 salivary candidate genes (Table 3A) only in the P. sativum associated race (40/ 2046, adjustedP =0.015). Genes differentially expressed between aphids reared on their home plant in compar-ison with aphids reared on V. faba showed no signifi-cant enrichment for salivary genes (Table 3A). Neither genes differentially expressed between different races, nor those differentially expressed between aphids reared in ‘home’ and ‘Vicia’ conditions, were signifi-cantly enriched for the set of 113 chemosensory candi-date genes (Table 3A and B). None of the eight genes identified as differing in expression between home and V. fabain a race-dependent manner was annotated as a salivary or a chemosensory gene.
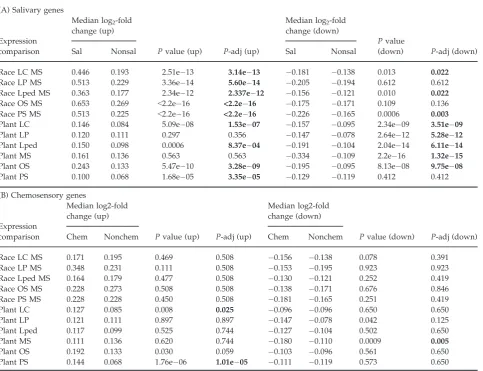
Is the magnitude of change in expression significantly greater in candidate genes than in noncandidate genes?. The mag-nitude of expression changes between aphids associated with M. sativa, and all five other races were signifi-cantly higher in salivary genes than in nonsalivary genes (Table 4A), for genes both over- and underex-pressed in these races in comparison with theM. sativa-associated race. The magnitude of expression differ-ences between aphids reared on their home plant in comparison with aphids reared onV. fabawas also sig-nificantly higher in salivary candidates than in nonsali-vary genes in all six races (Table 4A).
Magnitude of expression change in the chemosen-sory candidates was not significantly higher than nonchemosensory genes when comparing expression between races (Table 4B). The magnitude of expression
differences between aphids reared on their home plant in comparison with aphids reared onV. fabawas signif-icantly higher in chemosensory candidates than in nonchemosensory genes in three races: L. corniculatus, M. sativaandP. sativum(Table 4B).
There was only a very weak correlation between log2-fold change and within-group variance in expres-sion (mean Spearman’s rho =0.049,P<0.0005), so any difference observed in magnitude of log2-fold change should be independent of the general variability of those genes.
Discussion
Gene expression patterns provide new information regarding the divergence between pea aphid races; by examining these patterns both across pea aphid races and in response to environment, we have been able to examine gene expression as a phenotype, allowing the identification of genes with potential roles in plant spe-cialization.
To understand how expression differences can pro-vide raw material for evolution and to test the relative importance of drift and natural selection in gene expres-sion differences between populations or species, we need the ability to study these processes in recently diverged or currently diverging species where ecologi-cal differences are known (Whitehead & Crawford 2006a, b; Fay & Wittkopp 2007). The pea aphid complex shows gene expression differences both in response to the environment and in relation to race, providing an appropriate model system in which to examine these questions. To understand whether gene expression dif-ferences are playing a role in the adaptation of pea aphid races to their host plants and in the divergence of host races, we must be able to show that there are observable gene expression differences between the races, that these differences are heritable and that they are associated with adaptive divergence and/or repro-ductive isolation.
home plant could be due to race-specific changes in gene expression to the specific home plant (i.e. race specialization on the home plant), but they could also be the consequence of a general (nonhost-specific) change in gene expression in response to a host shift. However, our findings are still informative; genes that change expression in each shift are candidates for involvement in host adaptation and those that show race * host interactions are of particular interest because they are either host or race specific in their response.
Are there differences in gene expression between host-associated races?
Between 1406 and 4322 genes (3.9–11.9% of the 36 401 genes examined) were significantly differentially expressed in each of the five remaining host races in comparison with the M. sativa-associated race (Fig. 3a).
Direct comparison with other studies of the extent of expression divergence between populations is compli-cated given the influence of demographic factors, as well as wide variation in the extent of expression diver-gence observed between different tissue types (Khaito-vich et al. 2005). For comparison, Hoang et al. (2015) found that 2.7% of genes were differentially expressed between highly differentiated allopatric populations of Drosophila mettleri [FST =0.63–0.81 in pairwise
[image:11.595.57.539.104.456.2]compar-isons with other populations (Hurtado et al. 2004)], while 20–30% of genes were differentially expressed between two closely relatedRhagoletis species (Ragland et al. 2015). Bryk et al. found that between 8.4% and 19.3% of genes were differentially expressed between two mouse populations that had been diverging for around 3000 years, depending on method and tissue used (Bryk et al. 2013). The percentage of differentially expressed genes between pea aphid races thus seems to be within the realm of other findings.
Table 3 Summary of GOseq tests for enrichment of differentially expressed genes in candidate salivary and chemosensory genes. Pea aphid host races abbreviated to LC=L. corniculatus, LP= L. pratensis, Lped=L. pedunculatus, MS=M. sativa, OS=O. spinosa, PS
=P. sativum. Bold=significantly over- or under-represented
(A) Salivary genes (n=307)
Expression comparison
Number of DE salivary genes
Number of DE nonsalivary genes
Pvalue over
Pvalue under
BH-adjusted
Pvalue over
BH-adjusted
Pvalue under
Race LC vs MS 11 1756 0.994 0.012 0.995 0.030
Race LP vs MS 36 4286 0.948 0.073 0.995 0.122
Race Lped vs MS 15 1391 0.621 0.482 0.995 0.603
Race OS vs MS 23 2941 0.995 0.009 0.995 0.030
Race PS vs MS 40 2046 0.003 0.998 0.015 0.998
Plant LC 17 475 0.479 0.621 0.575 0.975
Plant LP 9 219 0.057 0.975 0.301 0.975
Plant Lped 4 160 0.833 0.312 0.575 0.936
Plant MS 24 321 0.100 0.934 0.301 0.975
Plant OS 12 378 0.408 0.703 0.575 0.975
Plant PS 7 547 0.999 0.002 0.999 0.012
Race: plant interaction 0 8 1.000 1.000 1.000 1.000
(B) Chemosensory genes (n=113)
Expression comparison
Number of DE chemosensory genes
Number of DE nonchemosensory genes
Pvalue over
Pvalue under
BH-adjusted
Pvalue over
BH-adjusted
Pvalue under
Race LC vs MS 5 1762 0.685 0.486 0.848 0.635
Race LP vs MS 14 4308 0.604 0.508 0.848 0.635
Race Lped vs MS 3 1403 0.848 0.314 0.848 0.635
Race OS vs MS 8 2956 0.736 0.392 0.848 0.635
Race PS vs MS 7 2079 0.497 0.655 0.848 0.655
Plant LC 5 487 0.025 0.994 0.151 0.994
Plant LP 1 227 0.531 0.826 0.856 0.994
Plant Lped 0 164 1.000 0.556 1.000 0.994
Plant MS 3 342 0.171 0.945 0.514 0.994
Plant OS 0 390 1.000 0.280 1.000 0.994
Plant PS 2 552 0.571 0.702 0.856 0.994
Are gene expression differences heritable?
Numerous studies have demonstrated differences in gene expression between diverging populations (e.g. Steiner et al. 2007; Whiteley et al. 2008; Gagnaire et al. 2013), but differences in expression between popula-tions do not necessarily reflect heritable genetic varia-tion, they could result from a plastic response to differences between the environments of populations. It is possible to uncouple gene expression from environ-mental variation using common garden experiments (e.g. Lai et al. 2008; Hoang et al. 2015). Here, we were able to show that observed expression patterns were related to lineage at the host-race level; despite being reared on the same host, aphids showed host-race-spe-cific patterns of gene expression (Fig. 2). Hierarchical clustering of samples on the basis of expression demon-strated that gene expression in the pea aphid is related to both race and clone and that expression similarities
between aphids of the same race and clone persist whether aphids have been reared on their home plant or on the universal host plant V. faba. Maintenance of gene expression similarities on the basis of race even on the universal host suggests genetic control of gene expression in the pea aphid, a finding in agreement with observations in other taxa of expression variation across individuals, populations and species (e.g. Jin et al. 2001; Enard et al. 2002; Cui et al. 2006), and with eQTL studies, which have confirmed our understanding of gene expression differences as both extensive and heritable (Dixon et al. 2007; Emilsson et al. 2008; Gilad et al.2008).
[image:12.595.63.547.95.466.2]In pairwise comparisons between each host-asso-ciated race and the M. sativa-associated race, the more genetically the divergent a race was from theM. sativa-associated race, the more the genes were differentially expressed between the two races. In the absence of gene flow between taxa, under a neutral model of gene
Table 4 Summary of Mann–WhitneyU-tests for difference between candidate and noncandidate genes in magnitude of differential expression. Significant values in bold
(A) Salivary genes
Expression comparison
Median log2-fold
change (up)
Pvalue (up) P-adj (up)
Median log2-fold
change (down)
Pvalue
(down) P-adj (down)
Sal Nonsal Sal Nonsal
Race LC MS 0.446 0.193 2.51e 13 3.14e 13 0.181 0.138 0.013 0.022
Race LP MS 0.513 0.229 3.36e 14 5.60e 14 0.205 0.194 0.612 0.612
Race Lped MS 0.363 0.177 2.34e 12 2.337e 12 0.156 0.121 0.010 0.022
Race OS MS 0.653 0.269 <2.2e 16 <2.2e 16 0.175 0.171 0.109 0.136 Race PS MS 0.513 0.225 <2.2e 16 <2.2e 16 0.226 0.165 0.0006 0.003
Plant LC 0.146 0.084 5.09e 08 1.53e 07 0.157 0.095 2.34e 09 3.51e 09
Plant LP 0.120 0.111 0.297 0.356 0.147 0.078 2.64e 12 5.28e 12
Plant Lped 0.150 0.098 0.0006 8.37e 04 0.191 0.104 2.04e 14 6.11e 14
Plant MS 0.161 0.136 0.563 0.563 0.334 0.109 2.2e 16 1.32e 15
Plant OS 0.243 0.133 5.47e 10 3.28e 09 0.195 0.095 8.13e 08 9.75e 08
Plant PS 0.100 0.068 1.68e 05 3.35e 05 0.129 0.119 0.412 0.412
(B) Chemosensory genes
Expression comparison
Median log2-fold change (up)
Pvalue (up) P-adj (up)
Median log2-fold change (down)
Pvalue (down) P-adj (down)
Chem Nonchem Chem Nonchem
Race LC MS 0.171 0.195 0.469 0.508 0.156 0.138 0.078 0.391
Race LP MS 0.348 0.231 0.111 0.508 0.153 0.195 0.923 0.923
Race Lped MS 0.164 0.179 0.477 0.508 0.130 0.121 0.252 0.419
Race OS MS 0.228 0.273 0.508 0.508 0.138 0.171 0.676 0.846
Race PS MS 0.228 0.228 0.450 0.508 0.181 0.165 0.251 0.419
Plant LC 0.127 0.085 0.008 0.025 0.096 0.096 0.650 0.650
Plant LP 0.121 0.111 0.897 0.897 0.147 0.078 0.042 0.125
Plant Lped 0.117 0.099 0.525 0.744 0.127 0.104 0.502 0.650
Plant MS 0.111 0.136 0.620 0.744 0.180 0.110 0.0009 0.005
Plant OS 0.192 0.133 0.030 0.059 0.103 0.096 0.561 0.650
expression evolution, we expect greater differences in expression with increasing evolutionary distance, a rela-tionship demonstrated at the total transcript level in Brassicaceae (Broadleyet al.2008) as well as on a gene-by-gene basis (Oleksiak et al. 2002; Khaitovich et al. 2004). Our observations are consistent with this model, and drift may be an important driving force in gene expression evolution in this system. However, as gene flow is ongoing between many of the races examined here (Peccoudet al.2009a), some of the observed differ-ences in overall expression patterns, which may have originally been driven by drift, may have been main-tained in the face of gene flow by other factors such as selection.
Is differential expression associated with ecological differences between, and adaptive divergence of, host-associated races?
The observed within-race changes in expression depen-dent on the plant that aphids were reared on (Table 2) may reflect a plastic response to host plant, a process which potentially performs an important role early in speciation by enabling persistence in novel plant envi-ronments (Price et al. 2003 p. 20; Pavey et al. 2010). Some of these plant-dependent genes could relate directly to adaptation of races to their host plant envi-ronments; 284 genes (16.9% of all unique genes differen-tially expressed on different plants) were also expressed differently between the race in which they showed a plant response and the M. sativa-associated race. As plant-response genes that also show race-specific expression in a common garden, they may contribute to the adaptive divergence of races.
In expression comparisons between aphids reared on their home plant and those reared on V. faba, the uni-versal host plant, we expected to see differences in genes related to numerous processes in the progressive stages of feeding, from sensing the plant, through meta-bolism to responses to plant defence. The GO category of odorant binding was over-represented amongst this gene set, and the three odorant binding genes responsi-ble (OBP1, OBP4 and OBP7) were all upregulated in aphids reared on V. faba, possibly in response to unfa-miliar odour molecules in their nonhome environment. A few other chemosensory genes were differentially expressed between home and ‘Vicia’ conditions, two sensory neuron membrane protein genes (ApisSNMP3 and ApisSNMP9) were also more highly expressed in the ‘Vicia’ condition, while two chemosensory protein genes (CSP2 and CSP9) were expressed more highly in aphids reared on their home plants. More chemosen-sory gene expression changes might be detectable if gene expression was compared between home and all
nonhome host plants, rather than between the home plant and V. faba. Magnitudes of chemosensory gene expression changes between home and ‘Vicia’ condi-tions were also significantly higher than those of nonchemosensory genes in three races.
Differences in available metabolites between plants (Sandstr€om & Pettersson 1994; Karleyet al.2002) might require aphids to express different digestive or meta-bolic enzymes, as well as to manipulate the metabolites and toxins that their host produces (Girousse et al. 2005). GO terms enriched in genes differentially expressed dependent on host plant included a number of metabolic categories, including catalytic activity, fatty acid metabolism and serine- and cysteine-type endopeptidase activity. Of particular interest are serine endopeptidases, which have been identified in other studies of insect feeding (De la Paz Celorio-Manceraet al. 2013; Hoanget al.2015). GO categories including cysteine proteases, serine carboxypeptidases and genes with oxido-reductase activity were also enriched amongst genes differentially expressed between host plants and could relate to detoxification of reactive oxygen species (ROS) or other plant-produced toxic compounds.
Another set of genes important to plant–aphid inter-actions are the salivary genes, which are thought to be involved in the manipulation of plant defence (Dogi-mont et al. 2010; Hogenhout & Bos 2011). Note that there is no GO category assigned for salivary genes, so we do not expect to identify them in GO analysis. Nonetheless, the magnitudes of plant-induced expres-sion changes in salivary genes were significantly greater than in nonsalivary genes. Furthermore, 58 individual salivary genes showed differential expression between aphids reared on their home host and those reared on V. faba, nearly 75% of which were upregulated on V. faba. These proteins may interfere with numerous facets of plant biology (e.g. cell signalling, secondary metabolite production and detoxification), and their dif-ferential expression could be the consequence of adap-tation to specific host plants, where different quantities of salivary proteins may be required for specific com-patible interactions. Alternatively, some salivary pro-teins may trigger undesired plant reactions in specific host plants, and it is possible that certain races suppress the expression of such genes to avoid triggering these responses in their host plant.
differing between races in their response to host plant may arise from the fact that differences tend to occur in single races; when each race was examined in isolation, larger numbers of genes per race were identified (Fig. 3b, Table S3, Supporting information). However, the detection of so few race-specific plant-responsive genes is striking considering the experimental design; that the difference in environment between Vicia faba and ‘home’ plant is not constant across races argues for a strong interaction effect, and biological explanations for the dearth of race-specific plant-responsive genes must also be considered. Failure to identify these genes could be due to the overriding importance of constitu-tive changes in expression, as demonstrated by strong race differences irrespective of host plant. In their study of expression differences between two host-specialized populations ofD. mettleri, Hoanget al.(2015) found that the majority of expression differences between popula-tions were independent of genes responding to host plant and suggested that predictability of larval envi-ronment might mean that constitutive expression differ-ences without plasticity were sufficient for larval success. It is possible that successful initial recognition of host plants by pea aphids removes the need to main-tain flexibility of expression of genes involved in host plant adaptation.
The minimal association between plant-responsive genes and those differing in expression between races (chi-squared =0.569, d.f.=1, P =0.45) may imply that much of the difference in gene expression between races is unrelated to host plant. GO terms associated with differentially expressed genes were very similar across races (Fig. S4, Supporting information), but while 41 GO categories were over-represented in differentially expressed subsets, there was little overlap in these over-represented categories between races. Combined with the steady, clock-like accumulation of differentially expressed genes with increasing genetic divergence between aphid races, these observations suggest that the majority of expression differences observed between races result from neutral processes. Alternatively, recent studies examining the contribution of plasticity to evolved differences have found mixed or minimal evi-dence for plasticity facilitating adaptive divergence (Dayan et al. 2015; Hoang et al. 2015; Ragland et al. 2015; Wybouw et al.2015). If this is the case, between-race adaptive differences in expression could still exist, but the adaptive genes might be expected to be differ-ent from those showing a plastic response to host plant. As the divergence of pea aphid races relates directly to host plant shifts, it is still worthwhile considering whether any of the over-represented GO categories in genes differentially expressed between races might relate to evolved adaptive differences.
One interesting over-represented set of GO terms in genes differentially expressed between races is the group relating to chitin binding and glucosamine meta-bolism. Chitinases are commonly produced in plants in response to phloem feeding insects (Moran et al.2002), and chitin expression in insects changes in response to insecticides (Puineanet al.2010) and to diet (De la Paz Celorio-Manceraet al.2013; Hoanget al.2015). Differen-tially expressed chitin-related genes might alternatively reflect differences in development between races. As in genes responding to host plant, GO terms relating to fatty acid metabolism were also enriched in genes dif-fering between races. Dworkin & Jones (2009) found that genes involved in fatty acid metabolism were expressed more highly in Drosophila sechellia than in Drosophila simulans, and related this difference to diet; D. sechellia feeds exclusively on morinda fruit, whose main toxins are fatty acids. Another gene potentially related to detoxification of plant defence compounds is ACYPI20394, a gene showing a race-specific response to host plant, which shows homology to peroxidase. Peroxidase enzymes have been commonly reported in aphid salivary secretions (Giordanengoet al.2010; Caro-lanet al.2011) and are thought to be involved in detoxi-fication of plant defence compounds. However, ACYPI20394 is not identified as a salivary gene, and peroxidasins can also have a role in development.
Although there was no specific enrichment for chemosensory genes amongst differentially expressed subsets, 26 chemosensory genes (19 chemoreceptors, 2 SNMPs, 3 OBPs and 2 CSPs) were differentially expressed between races. Four chemosensory genes that were differ-entially expressed between races (Or15, Or18, Or20 and Or21) were also amongst the outlier genes identified in Smadja et al. (2012). Salivary genes had significantly higher expression differences than nonsalivary genes in pairwise race comparisons and were also over-repre-sented amongst genes differentially expressed between M. sativa and P. sativum associated races. Interestingly, ACYPI008617, also known asC002, which was shown to be essential for aphid feeding on plants (Muttiet al.2008), was highly expressed in theP. sativumassociated race in comparison with expression in the M. sativa-associated race. C002 was also induced in the M. sativa-associated race when reared onV. fabain comparison with the same clones grown on their home plant (M. sativa).
genes, we did detect evidence for elevated magnitudes of expression changes in chemosensory genes in rela-tion to plant and in salivary genes across all condirela-tions. We also identified large numbers of genes from both categories with significant differences in expression across conditions, and the differential expression of these genes could have implications for aphid–plant interactions and reproductive isolation between races.
The virtual absence of enrichment for differential expression in candidate gene classes could result from host plant choice in pea aphids manifesting at a different life cycle stage (Guet al.2013); the aphids used here were wingless, but it is winged aphids that select their host plant when they disperse. Our choice of wingless aphids, which do not leave the plant they are born on, will be reflected in the kinds of genes observed as differentially expressed in this study. Expression differences relating to nutrition and feeding may be more relevant in wing-less forms than those related to host plant choice. Exam-ining winged instead of wingless aphids may reveal changes in chemosensory gene expression undetected here. Alternatively, expression differences related to plant adaptation could be confined to a small portion of candidate genes rather than a large group working together, or class level differences might have been masked by the divergence of expression in multiple traits, or by copy number variation in chemosensory genes between races as observed by Duvauxet al.(2015).
We conclude that heritable differences in gene expres-sion exist between races of pea aphid and that races also differ in their transcriptomic response to the plant on which they are reared. Genes differentially expressed between races or environments include a number of candidate chemosensory and salivary genes, and genes relating to fatty acid metabolism are over-represented amongst differentially expressed genes. Genes showing expression changes in response to host plant did not make up a large portion of between-race expression differences, providing confirmation of previ-ous studies’ findings that genes involved in expression divergence between populations or species are not nec-essarily those showing initial plasticity in the face of environmental change. Further exploration of gene expression in different conditions (e.g. tissues, morphs or environments) will be needed, in combination with studies of differentiation in allele frequency, to fully understand host-race formation and the progression towards speciation in this fascinating system.
Acknowledgements
IE, LD, MN, CS, RB and JF were supported by NERC grants NE/H004521/1 and NE/J021660/1, LD and RB by Leverhulme Trust project RPG-2013-198, JCS, JJ, CS and FL by
ANR-11-BSV7-005-01 ‘Speciaphid’ and AS by ANR-13-JSV7-0012 ‘Bugspit’. We would also like to thank NBAF Edinburgh for performing the sequencing. The Associate Editor and referees provided insightful comments on earlier versions of the manuscript. This is publication ISEM 2016-133.
References
Altschul SF, Gish W, Miller W, Myers EW, Lipman DJ (1990) Basic local alignment search tool.Journal of Molecular Biology,
215, 403–410.
Atamian HS, Chaudhary R, Cin VD et al. (2012) In planta
expression or delivery of potato aphidMacrosiphum euphor-biae effectors Me10 and Me23 enhances aphid fecundity.
Molecular Plant-Microbe Interactions,26, 67–74.
Benjamini Y, Hochberg Y (1995) Controlling the false discovery rate: a practical and powerful approach to multiple testing.
Journal of the Royal Statistical Society. Series B. Methodological,
57, 289–300.
Bos JIB, Prince D, Pitino Met al.(2010) A functional genomics approach identifies candidate effectors from the aphid spe-cies Myzus persicae (green peach aphid). PLoS Genetics, 6, e1001216.
Briscoe AD, Macias-Mu~noz A, Kozak KMet al.(2013) Female behaviour drives expression and evolution of gustatory receptors in butterflies.PLoS Genetics,9, e1003620.
Broadley MR, White PJ, Hammond JPet al.(2008) Evidence of neutral transcriptome evolution in plants. New Phytologist,
180, 587–593.
Bryk J, Somel M, Lorenc A, Teschke M (2013) Early gene expression divergence between allopatric populations of the house mouse (Mus musculus domesticus). Ecology and Evolu-tion,3, 558–568.
Bush GL, Butlin RK (2004) Sympatric speciation in insects. In:
Adaptive Speciation(eds Dieckmann U, Doebeli M, Metz JAJ, Tautz D), pp. 229–248. Cambridge University Press, UK. Caillaud MC, Via S (2000) Specialized feeding behavior
influ-ences both ecological specialization and assortative mating in sympatric host races of pea aphids.The American Naturalist,
156, 606–621.
Carolan JC, Fitzroy CIJ, Ashton PD, Douglas AE, Wilkinson TL (2009) The secreted salivary proteome of the pea aphid
Acyrthosiphon pisumcharacterised by mass spectrometry. Pro-teomics,9, 2457–2467.
Carolan JC, Caragea D, Reardon KT et al. (2011) Predicted effector molecules in the salivary secretome of the pea aphid (Acyrthosiphon pisum): a dual transcriptomic/proteomic approach.Journal of Proteome Research,10, 1505–1518. Chan YF, Marks ME, Jones FCet al.(2010) Adaptive evolution
of pelvic reduction in sticklebacks by recurrent deletion of a Pitx1 enhancer.Science,327, 302–305.
Conesa A, G€otz S, Garcıa-Gomez JM et al.(2005) Blast2GO: a universal tool for annotation, visualization and analysis in functional genomics research.Bioinformatics,21, 3674–3676. Croset V, Rytz R, Cummins SFet al.(2010) Ancient protostome
origin of chemosensory ionotropic glutamate receptors and the evolution of insect taste and olfaction (DL Stern, Ed,).
PLoS Genetics,6, e1001064.
Cui X, Affourtit J, Shockley KR, Woo Y, Churchill GA (2006) Inheritance patterns of transcript levels in F1 hybrid mice.
Dayan DI, Crawford DL, Oleksiak MF (2015) Phenotypic plas-ticity in gene expression contributes to divergence of locally adapted populations of Fundulus heteroclitus.Molecular Ecol-ogy,24, 3345–3359.
De la Paz Celorio-Mancera M, Wheat CW, Vogel Het al.(2013) Mechanisms of macroevolution: polyphagous plasticity in butterfly larvae revealed by RNA-Seq.Molecular Ecology,22, 4884–4895.
De Vos M, Jander G (2009)Myzus persicae(green peach aphid) salivary components induce defence responses inArabidopsis thaliana.Plant, Cell & Environment,32, 1548–1560.
Dixon AL, Liang L, Moffatt MF et al. (2007) A genome-wide association study of global gene expression.Nature Genetics,
39, 1202–1207.
Dogimont C, Bendahmane A, Chovelon V, Boissot N (2010) Host plant resistance to aphids in cultivated crops: genetic and molecular bases, and interactions with aphid popula-tions.Comptes Rendus Biologies,333, 566–573.
Dres M, Mallet J (2002) Host races in plant–feeding insects and their importance in sympatric speciation.Philosophical Trans-actions of the Royal Society of London. Series B: Biological Sciences,357, 471–492.
Duvaux L, Geissmann Q, Gharbi Ket al. (2015) Dynamics of copy number variation in host races of the pea aphid. Molec-ular Biology and Evolution,32, 63–80.
Dworkin I, Jones CD (2009) Genetic changes accompanying the evolution of host specialization inDrosophila sechellia. Genet-ics,181, 721–736.
Elzinga DA, De Vos M, Jander G (2014) Suppression of plant defenses by aMyzus persicae(green peach aphid) salivary effec-tor protein.Molecular Plant-Microbe Interactions,27, 747–756. Emilsson V, Thorleifsson G, Zhang B et al. (2008) Genetics of
gene expression and its effect on disease.Nature,452, 423–428. Enard W, Khaitovich P, Klose J et al.(2002) Intra- and
Inter-specific variation in primate gene expression patterns.
Science,296, 340–343.
Farrell BD (1998) “Inordinate fondness” explained: why are there so many beetles?Science,281, 555–559.
Ferrari J, Via S, Godfray HC (2008) Population differentiation and genetic variation in performance on eight hosts in the pea aphid complex.Evolution,62, 2508–2524.
Ferrari J, Godfray HC, Faulconbridge AS, Prior K, Via S (2006) Population differentiation and genetic variation in host choice among pea aphids from eight host plant genera. Evo-lution,60, 1574–1584.
Fay JC, Wittkopp PJ (2007) Evaluating the role of natural selec-tion in the evoluselec-tion of gene regulaselec-tion.Heredity, 100, 191–
199.
Forister ML, Dyer LA, Singer MS, Stireman JO III, Lill JT (2011) Revisiting the evolution of ecological specialization, with emphasis on insect–plant interactions.Ecology,93, 981–991. Gagnaire P-A, Normandeau E, Pavey SA, Bernatchez L (2013)
Mapping phenotypic, expression and transmission ratio dis-tortion QTL using RAD markers in the Lake Whitefish ( Core-gonus clupeaformis).Molecular Ecology,22, 3036–3048.
Gentleman R, Carey V, Huber W, Hahne F (2011) Genefilter: methods for filtering genes from microarray experiments.R Package Version,1.
Gilad Y, Rifkin SA, Pritchard JK (2008) Revealing the architec-ture of gene regulation: the promise of eQTL studies.Trends in Genetics,24, 408–415.
Giordanengo P, Brunissen L, Rusterucci Cet al.(2010) Compat-ible plant-aphid interactions: how aphids manipulate plant responses.Comptes Rendus Biologies,333, 516–523.
Girousse C, Moulia B, Silk W, Bonnemain J-L (2005) Aphid infesta-tion causes different changes in carbon and nitrogen allocainfesta-tion in alfalfa stems as well as different inhibitions of longitudinal and radial expansion.Plant Physiology,137, 1474–1484.
Gompert Z, Comeault AA, Farkas TEet al.(2014) Experimental evidence for ecological selection on genome variation in the wild.Ecology Letters,17, 369–379.
Gu S-H, Wu K-M, Guo Y-Y et al. (2013) Identification and expression profiling of odorant binding proteins and chemosensory proteins between two wingless morphs and a winged morph of the cotton aphid Aphis gossypii Glover.
PLoS ONE,8, e73524.
Hallem EA, Dahanukar A, Carlson JR (2006) Insect odor and taste receptors.Annual Review of Entomology,51, 113–135. Hardcastle TJ, Kelly KA (2010) baySeq: empirical Bayesian
methods for identifying differential expression in sequence count data.BMC Bioinformatics,11, 422.
Harmel N, Letocart E, Cherqui Aet al.(2008) Identification of aphid salivary proteins: a proteomic investigation ofMyzus persicae.Insect Molecular Biology,17, 165–174.
Hoang K, Matzkin LM, Bono JM (2015) Transcriptional varia-tion associated with cactus host plant adaptavaria-tion in Droso-phila mettleripopulations.Molecular Ecology,24, 5186–5199. Hogenhout SA, Bos JI (2011) Effector proteins that modulate
plant–insect interactions.Current Opinion in Plant Biology,14, 422–428.
Huestis DL, Marshall JL (2009) From gene expression to pheno-type in insects: non-microarray approaches for transcriptome analysis.BioScience,59, 373–384.
Hurtado LA, Erez T, Castrezana S, Markow TA (2004) Con-trasting population genetic patterns and evolutionary histo-ries among sympatric Sonoran Desert cactophilicDrosophila.
Molecular Ecology,13, 1365–1375.
Jaquiery J, Stoeckel S, Nouhaud Pet al.(2012) Genome scans reveal candidate regions involved in the adaptation to host plant in the pea aphid complex.Molecular Ecology,21, 5251–5264.
Jin W, Riley RM, Wolfinger RDet al.(2001) The contributions of sex, genotype and age to transcriptional variance in Droso-phila melanogaster.Nature Genetics,29, 389–395.
Jin X, Ha TS, Smith DP (2008) SNMP is a signaling component required for pheromone sensitivity inDrosophila.Proceedings of the National Academy of Sciences,105, 10996–11001.
Kaloshian I, Walling LL (2005) Hemipterans as plant patho-gens.Annual Review of Phytopathology,43, 491–521.
Karley AJ, Douglas AE, Parker WE (2002) Amino acid compo-sition and nutritional quality of potato leaf phloem sap for aphids.Journal of Experimental Biology,205, 3009–3018. Khaitovich P, Weiss G, Lachmann M et al. (2004) A neutral
model of transcriptome evolution.PLoS Biology,2, e132. Khaitovich P, Hellmann I, Enard Wet al. (2005) Parallel
pat-terns of evolution in the genomes and transcriptomes of humans and chimpanzees.Science,309, 1850–1854.
Kim D, Pertea G, Trapnell C et al. (2013) TopHat2: accurate alignment of transcriptomes in the presence of insertions, deletions and gene fusions.Genome Biology,14, R36.