R E V I E W
Open Access
Effects of Fluids on the Macro- and
Microcirculations
Victoria A. Bennett
*, Alexander Vidouris and Maurizio Cecconi
Abstract
This article is one of ten reviews selected from the Annual Update in Intensive Care and Emergency Medicine 2018. Other selected articles can be found online athttps://www.biomedcentral.com/collections/ annualupdate2018. Further information about the Annual Update in Intensive Care and Emergency Medicine is available fromhttp://www.springer.com/series/8901.
Background
Intravenous fluid administration is one of the most frequently performed interventions in the intensive care unit (ICU) and in hospital in general. In fact, most inpa-tients will receive fluids at some point during their hospital stay [1]. In critically ill patients, fluid resuscita-tion is a vital component of patient management. It has been shown that both too little and too much fluid can be detrimental. A positive cumulative fluid balance on day four of a critical care admission has been associated with increased morbidity [2,3]. Both perioperatively and during sepsis, a U-shaped curve has been described for volume of fluid administered and morbidity. Higher mortality is observed at both extremes of volume of fluid given [4,5].
However, despite extensive research in the field, con-troversy remains regarding the best approach to fluid therapy. The FENICE study focused on the fluid challenge and found wide disparity in practice; from fluid choice to method of administration and clinician response to the result [6]. To help guide decision making around fluid administration, the effects, both desirable and poten-tially detrimental ones, need to be considered. This can be considered at both the macrocirculatory and the microcir-culatory level. Whilst in health coherence between the macrocirculation and microcirculation can be assumed,
* Correspondence:[email protected]
Department of Intensive Care Medicine, St George’s University Hospital NHS Foundation Trust, London, UK
this is lost in some disease states. This overview explores the effects of the fluid on the macro- and microcircula-tions and how we can monitor these effects.
Indications for Fluid
Classically, the need for fluid therapy is identified using information from the clinical history, examination, measurement of hemodynamic variables and markers of tissue hypoperfusion [7]. Markers of hypoperfusion may include lactate, prolonged capillary refill time and skin mottling [6]. A fluid challenge is given when tissue hy-poperfusion is suspected [7]. Fluid is given to optimize cardiovascular status with the aim of ensuring adequate end-organ perfusion and improving oxygen delivery to the tissues. Fluid is given as a fluid challenge so that re-sponse can be assessed and the need for ongoing fluid therapy ascertained. To mitigate against the risk of fluid overload in those who do not require additional intra-vascular volume, the smallest volume that provides an effective challenge of the cardiovascular system should be used [8].
Most often, measures of the macrocirculation are used to assess and treat hemodynamic compromise in the critically ill patient and measures of the microcirculation are not routinely used at the bedside. Resuscitation based on macrocirculatory endpoints is expected to re-sult in parallel improvement in the microcirculation [9].
Macrocirculation
The macrocirculatory response to intravenous fluid administration is based on the principles of the Frank-Starling law of the heart. Venous return is always equal to cardiac output. The Frank-Starling principle describes how the heart is able to accommodate increased venous return and then eject the increased volume from the heart, with an increase in stroke volume. Increased venous return increases ventricular filling, which results in increased stretch of the cardiac myocyctes. This in-creased stretch results in inin-creased contractility, or in other words, the increased diastolic expansion results in
increased systolic contraction [10,11]. Administration of fluid aims to challenge this and assess whether a patient can accommodate an increased preload with an in-creased stroke volume.
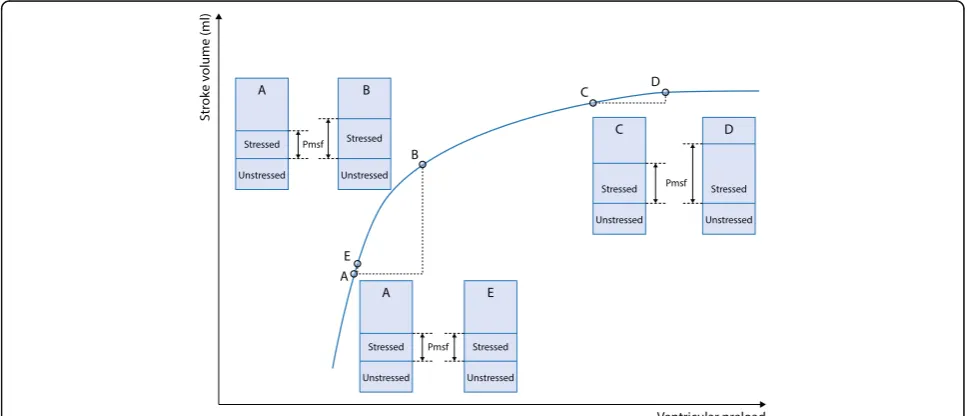
The hemodynamic response to a fluid challenge can be understood by considering the effects at different points on the cardiovascular system. The first change seen is an expansion of the intravascular volume. Intra-vascular volume can be divided into stressed and unstressed volumes. The unstressed volume fills the ves-sels but does not generate any pressure. The stressed volume causes stretch of the vessel walls and increases the pressure within the vessels. Mean systemic filling pressure (Pmsf ) is the measurement of the pressure when there is no flow in the vessels, or in circulatory arrest. Whilst Pmsf cannot be measured under the circumstances with which it was initially described, alter-native techniques have been validated [12]. If an effective fluid challenge is given, it will, at least transiently, in-crease the stressed volume and cause a rise in Pmsf. This increases cardiac preload, which ultimately increases cardiac output in preload-responsive patients. The re-sponse to the increase in cardiac preload can be explained by the Frank-Starling principle.
In a patient who is fluid responsive, an effective fluid challenge will result in a significant increase, of more than 10%, in the stroke volume or cardiac output. If a fluid challenge is given, which is effective in significantly increasing Pmsf, but no subsequent increase in cardiac output is seen, the patient is labeled as non-responsive [13]. This is demonstrated in Fig. 1: an adequate fluid challenge administered at point A, increases Pmsf and a significant increase in stroke volume is seen at point B–
this patient is fluid responsive. At C, although an ad-equate fluid challenge is given, as demonstrated by an increase in Pmsf, no significant increase in stroke volume is seen at point D –this patient is not fluid re-sponsive. If an inadequate fluid challenge, of too small a volume to increase Pmsf, is given at point A, an increase in stroke volume is not seen at point E and the patient would incorrectly be labeled as non-responsive to fluid.
Cecconi et al. demonstrated that a change in the pres-sure gradient of venous return, defined as the difference between the Pmsf and central venous pressure (CVP), following a fluid challenge was seen in responders but not in non-responders. In the non-responders, the in-crease in Pmsf was mirrored by an inin-crease in CVP [14]. In those that respond, the maximal change in cardiac output is seen one minute after completion of the fluid challenge. The increase in cardiac output is a transient response; a return to baseline values is seen ten minutes post-fluid administration [13].
The decision to give fluids should be based on whether an increase in cardiac output is likely to occur with fluid loading and whether it would be likely to improve tissue perfusion. These are clinical questions that the clinician should ask before considering giving fluids. A patient who is non-responsive is unlikely to benefit from further fluid loading. Not all patients who are responsive to fluid require the additional volume [8]. For example, in a study of healthy volunteers, by definition not in shock, a significant increase in stroke volume was seen following a head down tilt (mimicking a fluid challenge). Despite being fluid responsive these healthy volunteers were unlikely to need fluid resuscitation or have evidence of tissue hypoperfusion [15].
[image:2.595.56.540.491.699.2]Other hemodynamic parameters, used more historically, include static endpoints, such as heart rate. However, a change in heart rate in response to fluid administration is not a sensitive marker of fluid responsiveness and can be influenced by numerous other factors [13].
CVP has historically also been used to guide fluid ad-ministration. Targeting a CVP of 8–12 cmH2O was part of several optimization protocols in the past [16,17]. The role of CVP in predicting fluid responsiveness has since been refuted. Use of the CVP as an indicator of fluid responsiveness has been shown to be unreliable [18, 19]. It does not provide accurate information about blood volume [20]. Monitoring trends in CVP over time may provide information about cardiovascular function but should not be used alone to guide fluid resuscitation [21].
Microcirculation and Hemodynamic Coherence
In health, hemodynamic coherence is assumed to exist. This means changes within the macrocirculation are re-flective of changes in the microcirculation. As described earlier, the macrocirculation is generally used to guide fluid resuscitation, although ultimately the target is normalization of the microcirculation and maintenance of end-organ perfusion. However, although optimization of fluid status may result in normalization of macrocir-culatory hemodynamics, such as blood pressure, this does not always translate to paralleled improvements or normalization of the microcirculation, or guarantee adequate tissue perfusion. In these conditions, a lack of hemodynamic coherence is described. This means that targeting the normalization of macrocirculatory variables may not be effective in restoring perfusion of end organs and tissues [22].
Under normal physiological conditions, the macrocir-culation regulates the distribution of blood and thus end-organ perfusion. Systemic responses occur to alter macrovascular factors in order to compensate for hypo-volemia, hypoxia or other nutrient delivery insufficien-cies and to ensure removal of waste products. The macrocirculation is controlled by the central nervous system via the sympathoadrenomedullary axis and the parasympathetic nervous system. The renin-angiotensin-aldosterone axis, vasopressin, natriuretic peptides and adipocytokines are also important in the control of blood volume and blood pressure [23]. These pathways and hormones affect the blood supply to the microcircu-lation via modumicrocircu-lation of the function of the heart, the tone of the vasculature and the volume, viscosity and composition of the blood.
The microcirculation has a hugely important role in maintaining homeostasis of end organs and regulating tissue perfusion and also in thermoregulation by control-ling cutaneous blood flow. Local mechanisms regulate vascular tone at the microcirculatory level by acting
upon smooth muscle. They respond to physical stimuli in the microcirculation, such as increased blood pressure, causing constriction in the arterioles of the microcircula-tion. Some of the molecules that are active in the vascula-ture of the microcirculation are released from the endothelial wall including prostaglandins, nitric oxide (NO) and endothelin, which are released as a result of shear stress on the vessels. NO release can also be stimu-lated by other vasoactive peptides. Metabolic stimuli, such as adenosine, hydrogen ions, carbon dioxide and oxygen tension, generated in tissues also control blood flow in the microcirculation via dilation of the vessels [9]. The func-tion of the microcirculafunc-tion is also controlled by the per-meability of the capillaries, their structure, the osmotic and diffusion gradients across the cell membranes and the transport systems across the vessel walls.
There may be a lack of hemodynamic coherence in disease states. States of shock, inflammation and infec-tion can interfere with the sensing and homeostatic control mechanisms of the microcirculation [22]. Coher-ence is often altered in states of hemorrhagic shock or septic shock [24]. The loss of hemodynamic coherence can be the result of physiological changes in the environ-ment resulting in nitrosative and oxidative mechanisms affecting regulation of the vasculature, changes in cell function or through changes in barrier mechanisms and concentration gradients, all of which will inhibit normal tissue perfusion. Hemodynamic coherence has been shown to vary in different tissue types dependent upon the disease state present [25].
In sepsis, neutrophil adhesion and a hypercoagulable state may lead to capillary occlusion, alongside other capillaries with normal blood flow. This results in heterogeneous blood flow through the microcirculation, with subsequent hypoperfusion and tissue hypoxia. Oxidative stress also oc-curs, in which endothelial dysfunction and capillary fluid and protein leaks occur. There is a loss of cellular barriers and tight junctions leading to worsening tissue edema [29].
Another area in which hemodynamic coherence may be affected is in hemorrhagic shock. Permissive hypotension and low volume fluid resuscitation are sometimes used in the initial stages of treatment and over time these can lead to insidious microcirculatory hypoperfusion. This may disrupt both coherence and cause a reperfusion injury. If this occurs, then monitoring and restoring the macrocir-culation will not result in benefit to the microcirmacrocir-culation [30]. Loss of hemodynamic coherence has been associated with poor outcomes [24,31].
As previously discussed, intravenous fluids are given to improve end-organ perfusion and oxygen delivery. Macrocirculatory parameters are used to deduce infor-mation about what is occurring at the microcirculatory level. However, as a lack of coherence may exist between the macro- and the microcirculation there is increasing evidence in favor of monitoring the effects of fluid at the microcirculatory level [22].
The microcirculation can be observed using a hand-held camera at the patient’s bedside. There are currently four generations of technology available. Through re-cording short video sequences of the microcirculation, information regarding fluid status can be ascertained. The images obtained can be scored and a number of measurements made. The microcirculation consensus meeting of 2007 described the following scoring systems: vessel density measurement including total vessel density and perfused vessel density and vessel perfusion assess-ment using proportion of perfused vessels and microcir-culatory flow index (MFI). These parameters can be used to monitor the effects of fluid on the microcircula-tion [32]. Due to the limited availability of monitoring equipment and the need for offline analysis of images acquired, at present microcirculation measurement remains primarily a research tool [33].
The effect of intravenous fluid on the microcirculation varies depending on the underlying disease state. Shock can be broadly divided into four different classes: hypo-volemic, distributive, cardiogenic and obstructive shock. Hypovolemic, cardiogenic and obstructive shock are associated with a low cardiac output. However, in sepsis, a form of distributive shock, cardiac output may be ei-ther low or high. In cardiogenic and obstructive shock there is increased afterload, with an expansion of the volume of the microcirculation. Hypovolemic and dis-tributive shock are both characterized by impaired flow in
the microcirculation [34]. However, the changes seen in the microcirculation in distributive shock are the most marked. Disruption occurs, with adjacent small vessels often exhibiting markedly different patterns of flow. Much of the research on the effects of fluids on the microcircula-tion has therefore focused on patients with sepsis [29]. The changes within the microcirculation that pre-date fluid administration must be considered to help predict the possible consequences of fluid administration.
Several mechanisms by which fluids exert their effects on the microcirculation have been described. The first, and arguably most important, is via increased flow. The effect of a fluid challenge on the macrocirculation, as previously described, increases filling within the system. In the volume-responsive patient this increases flow, which will increase microcirculatory perfusion by in-creasing pressure at the level of the capillaries.
Secondary effects relate to decreased viscosity secondary to hemodilution from fluid administration. The decreased viscosity will promote flow. In the hemoconcentrated pa-tient this desirable feature will likely predominate; however, it may be that the hemodilution decreases oxygen carriage and cause shunting within the microcirculation [34].
Other adverse effects of fluid administration can be clearly demonstrated through direct vision of the micro-circulation. Leakage of fluid extravascularly with in-creased tissue edema can be visualized and objectively monitored, as the vessel density will decrease. This re-sults in increased diffusion distance from red blood cells to the tissues and decreased efficiency of oxygen delivery with subsequent hypoxia [29].
Measurement of flow within the microcirculation, at baseline, can be used to predict those that may benefit from a fluid challenge. Optimization of fluid status using macrocirculatory parameters does not always equate to improvement in clinical markers of hypoperfusion. Pranskunas et al. demonstrated that, in those with nor-mal microcirculatory flow, no clinical benefit was gained by a fluid challenge, neither from the perspective of im-provement in clinical markers of hypoperfusion nor an increase in MFI. In those with a low MFI, a significant improvement in MFI and clinical signs of hypoperfusion were seen following a fluid challenge [35]. Periopera-tively, patients who develop postoperative complications have been shown to be more likely to have had micro-vascular flow abnormalities [36]. Those patients with a low MFI could not be identified by observing macrocir-culatory parameters. Additionally, an increase in MFI did not correlate well with those who responded with an increase in stroke volume. The authors hypothesized this may be related to the fact that not all those who respond to a fluid challenge need the additional volume [35].
the illness. In early sepsis, total vessel density, small vessel density and MFI all increased with fluid adminis-tration. The same effect was not seen in patients in the later stages of sepsis, defined as patients more than 48 h after diagnosis. These changes are not mirrored in the macrocirculation [37].
Predicting Response to Fluids
There are a number of different methods that can be used to try and predict which patients will be fluid re-sponsive, prior to administering any fluid. Pulse pressure variation (PPV) and stroke volume variation (SVV) compare beat-to-beat variations, with a variation of more than 12% used as a marker of fluid responsiveness [38, 39]. These methods are only validated for use in ventilated patients, with tidal volumes of more than 8 ml/kg and with no significant alteration in chest wall compliance. They can also only be used in patients in sinus rhythm [40].
Another predictor is vena cava collapsibility index. Variation in the diameter of the inferior vena cava (IVC) on transthoracic echocardiography is reasonably predict-ive of fluid responspredict-iveness; however, measurement of the collapsibility of the superior vena cava on transesopha-geal echocardiography is more reliable. Measurement of the vena cava has the same limitations related to ventila-tion as PPV or SVV. It can, however, be used in patients with arrhythmias [40].
The end-expiratory occlusion test can also be used in pa-tients receiving mechanical ventilation. Interruption of ven-tilation at end-expiration for at least 15 s causes an increase in preload. If cardiac output increases by more than 5% in response then this is predictive of fluid responsiveness [41].
Passive leg raise has gained increasing popularity as a method of assessing fluid responsiveness. It provides ap-proximately 300 ml of fluid as a challenge, increasing preload, from which fluid responsiveness can be deter-mined. The technique can be reliably used in both venti-lated and spontaneously ventilating patients. It provides a challenge of preload without the need to give intraven-ous fluids in patients who are then shown to be non-responsive. However, it has its own limitations: for prac-tical reasons it may not always be possible to perform and its reliability in the presence of intraabdominal hypertension has also been questioned [42].
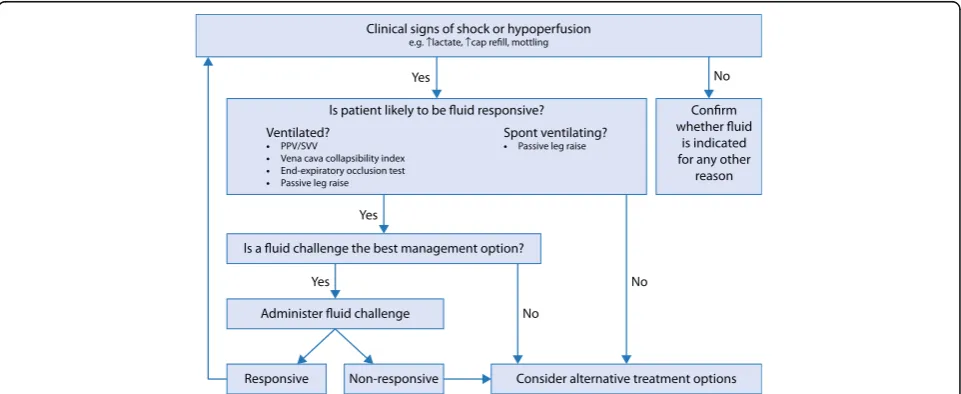
As previously discussed it is important to try and predict the likely response to fluid administration prior to actually giving fluids. Figure2provides a simple flow chart of the possible decision pathway that a clinician may follow when considering fluid prescription for a patient in shock.
Conclusion
The decision to give intravenous fluid to a patient is a clinical one. The clinical assessment of each patient should include a prediction of whether it is likely that he/she will respond to additional volume and whether he/she requires and will benefit from it. Fluid adminis-tration is in general guided by the changes seen within the macrocirculation. Historically, this was presumed to represent the microcirculation; however, in illness, it has been shown that coherence may not exist. There are still many uncertainties regarding the effects of fluids on the microcirculation. The effects vary depending on the disease process and indeed the stage of the disease. At this stage, the effects of fluids on the microcirculation remain a focus of ongoing study and research.
[image:5.595.58.539.506.703.2]Acknowledgements
VB and MC are also affiliated with St George’s University of London.
Funding
Publication costs were funded by St George’s University of London.
Availability of data and materials Not applicable.
Authors’contributions
Initial draft was written by VB, AV, edited by MC. All authors had read and approved the final manuscript.
Ethics approval and consent to participate Not applicable.
Consent for publication Not applicable.
Competing interests
MC–consultancy for Edwards Lifesciences, LIDCO, Cheetah Medical.
Publisher’s Note
Springer Nature remains neutral with regard to jurisdictional claims in published maps and institutional affiliations.
References
1. Padhi S, Bullock I, Li L, Stroud M, National Institute for Health and Care Excellence (NICE) Guideline Development Group. Intravenous fluid therapy for adults in hospital: summary of NICE guidance. BMJ. 2013;347:f7073. 2. Boyd JH, Forbes J, Nakada T, Walley KR, Russell JA. Fluid resuscitation in
septic shock: a positive fluid balance and elevated central venous pressure are associated with increased mortality. Crit Care Med. 2011;39:259–65. 3. Vaara ST, Korhonen AM, Kaukonen K-M, et al. Fluid overload is associated
with an increased risk for 90-day mortality in critically ill patients with renal replacement therapy: data from the prospective FINNAKI study. Crit Care. 2012;16:R197.
4. Liu V, Morehouse JW, Soule J, Whippy A, Escobar GJ. Fluid volume, lactate values, and mortality in sepsis patients with intermediate lactate values. Ann Am Thorac Soc. 2013;10:466–73.
5. Bellamy MC. Wet, dry or something else? Br J Anaesth. 2006;97:755–7. 6. Cecconi M, Hofer C, Teboul JL, et al. Fluid challenges in intensive care: the FENICE
study: a global inception cohort study. Intensive Care Med. 2015;41:1529–37. 7. Gruartmoner G, Mesquida J, Ince C. Fluid therapy and the hypovolemic
microcirculation. Curr Opin Crit Care. 2015;21:276–84.
8. Cecconi M, Parsons AK, Rhodes A. What is a fluid challenge? Curr Opin Crit Care. 2011;17:290–5.
9. Charlton M, Sims M, Coats T, Thompson JP. The microcirculation and its measurement in sepsis. J Intensive Care Soc. 2016;18:221–7.
10. Patterson SW, Piper H, Starling EH. The regulation of the heart beat. J Physiol. 1914;48:465–513.
11. Patterson SW, Starling EH. On the mechanical factors which determine the output of the ventricles. J Physiol. 1914;48:357–79.
12. Aya HD, Rhodes A, Fletcher N, Grounds RM, Cecconi M. Transient stop-flow arm arterial-venous equilibrium pressure measurement: determination of precision of the technique. J Clin Monit Comput. 2016;30:55–61. 13. Aya HD, Ster IC, Fletcher N, Grounds RM, Rhodes A, Cecconi M.
Pharmacodynamic analysis of a fluid challenge. Crit Care Med. 2015;44:880–91. 14. Cecconi M, Aya HD, Geisen M, et al. Changes in the mean systemic filling
pressure during a fluid challenge in postsurgical intensive care patients. Intensive Care Med. 2013;39:1299–305.
15. Nixon JV, Murray RG, Leonard PD, Mitchell JH, Blomqvist CG. Effect of large variations in preload on left ventricular performance characteristics in normal subjects. Circulation. 1982;65:698–703.
16. Rivers E, Nguyen B, Havstad S, et al. Early goal directed therapy in the treatment of severe sepsis and septic shock. N Engl J Med. 2001;345:1368–77. 17. Dellinger RP, Levy MM, Carlet JM, et al. Surviving Sepsis Campaign:
international guidelines for management of severe sepsis and septic shock: 2008. Intensive Care Med. 2008;34:17–60.
18. Bentzer P, Griesdale DE, Boyd J, MacLean K, Sirounis D, Ayas NT. Will this hemodynamically unstable patient respond to a bolus of intravenous fluids? JAMA. 2016;316:1298–309.
19. Marik PE, Cavallazzi R. Does the central venous pressure predict fluid responsiveness? An updated meta-analysis and a plea for some common sense. Crit Care Med. 2013;41:1774–81.
20. Marik PE, Baram M, Vahid B. Does central venous pressure predict fluid responsiveness? Chest. 2008;134:172–8.
21. Magdar S. Fluid status and fluid responsiveness. Curr Opin Crit Care. 2010; 16:289–96.
22. Ince C. Hemodynamic coherence and the rationale for monitoring the microcirculation. Crit Care. 2015;19(Suppl 3):S8.
23. Thiriet M. Macrocirculation. In: Lanzer P, editor. PanVascular Medicine. Berlin: Springer; 2014. p. 1–54.
24. Arnemann P, Seidel L, Ertmer C. Haemodynamic coherence–the relevance of fluid therapy. Best Pract Res Clin Anaesthesiol. 2016;30:419–27. 25. Van Iterson M, Bezemer R, Heger M, Siegemund M, Ince C. Microcirculation
follows macrocirculation in heart and gut in the acute phase of
hemorrhagic shock and isovolemic autologous whole blood resuscitation in pigs. Transfusion. 2012;52:1552–9.
26. Siegemund M, Van Bommel J, Sinaasappel M, et al. The NO donor SIN-1 improves intestinal-arterial Pco2 gap in experimental endotoxemia: an animal study. Acta Anaesthesiol Scand. 2007;51:693–700.
27. Almac E, Siegemund M, Demirci C, Ince C. Microcirculatory recruitment maneuvers correct tissue CO2 abnormalities in sepsis. Minerva Anestesiol. 2006;72:509–19.
28. Lush CW, Kvietys PR. Microvascular dysfunction in sepsis. Microcirculation. 2000;7:83–101.
29. Elbers PWG, Ince C. Mechanisms of critical illness–classifying microcirculatory flow abnormalities in distributive shock. Crit Care. 2006;10:221.
30. Libert N, Harrois A, Duranteau J. Haemodynamic coherence in haemorrhagic shock. Best Pract Res Clin Anaesthesiol. 2016;30:429–35. 31. Vellinga NA, Ince C, Boerma EC. Elevated central venous pressure is
associated with impairment of microcirculatory blood flow in sepsis: a hypothesis generating post hoc analysis. BMC Anesthesiol. 2013;13:17. 32. De Backer D, Hollenberg S, Boerma C, et al. How to evaluate the
microcirculation: report of a round table conference. Crit Care. 2007;11:R101. 33. Tafner PFDA, Chen FK, Filho RR, Corrêa TD, Chaves RCF, Neto SA. Recent
advances in bedside microcirculation assessment in critically ill patients. Rev Bras Ter Intensiva. 2017;29(2):238–47.
34. Boldt J, Ince C. The impact of fluid therapy on microcirculation and tissue oxygenation in hypovolemic patients: a review. Intensive Care Med. 2010;36: 1299–308.
35. Pranskunas A, Koopmans M, Koetsier PM, Pilvinis V, Boerma EC.
Microcirculatory blood flow as a tool to select ICU patients eligible for fluid therapy. Intensive Care Med. 2013;39:612–9.
36. Jhanji S, Lee C, Watson D, Hinds C, Pearse RM. Microvascular flow and tissue oxygenation after major abdominal surgery: Association with post-operative complications. Intensive Care Med. 2009;35:671–7.
37. Ospina-Tascon G, Neves AP, Occhipinti G, et al. Effects of fluids on microvascular perfusion in patients with severe sepsis. Intensive Care Med. 2010;36:949–55.
38. De Backer D, Heenen S, Piagnerelli M, Koch M, Vincent JL. Pulse pressure variations to predict fluid responsiveness: influence of tidal volume. Intensive Care Med. 2005;31:517–23.
39. Marik PE, Cavallazzi R, Vasu T, Hirani A. Dynamic changes in arterial waveform derived variables and fluid responsiveness in mechanically ventilated patients: a systematic review of the literature. Crit Care Med. 2009;37:2642–7.
40. Monnet X, Marik PE, Teboul JL. Prediction of fluid responsiveness: an update. Ann Intensive Care. 2016;6:111.
41. Monnet X, Osman D, Ridel C, Lamia B, Richard C, Teboul JL. Predicting volume responsiveness by using the end-expiratory occlusion in mechanically ventilated intensive care unit patients. Crit Care Med. 2009;37:951–6. 42. Monnet X, Marik P, Teboul JL. Passive leg raising for predicting fluid