DEVELOPMENT OF DEMAND RESPONSE CONTROL INTERFACE TO MAXIMISE ENERGY UTILISATION
Thanabalan S/O Kuppusamy
Bachelor in Electrical Engineering
“I hereby declare that I have read through this report entitle “Development of Demand Response Control Interface to Maximize Energy Utilization” and found that it has comply the
partial fulfillment for awarding the degree of Bachelor of Electrical Engineering (Power Electronics & Drive)”
Signature : ...
Supervisor‟s Name: Dr. Gan Chin Kim
ii
DEVELOPMENT OF DEMAND RESPONSE CONTROL INTERFACE TO MAXIMISE ENERGY UTILISATION
THANABALAN S/O KUPPUSAMY
A report submitted in partial fulfillment of the requirements for the degree of Bachelor in Electrical Engineering (Power Electronics & Drive)
Faculty of Electrical Engineering
UNIVERSITI TEKNIKAL MALAYSIA MELAKA
iii
I declare that this report entitle “Development of Demand Response Control Interface to Maximize Energy Utilization” is the result of my own research except as cited in the references. The report has not been accepted for any degree and is not concurrently submitted
in candidature of any other degree.
Signature: ...
Name : Thanabalan s/o Kuppusamy
iv
v
ACKNOWLEDGEMENT
First of all, I would like to thank almighty God for the strength and blessings. I would also like to express my deepest gratitude to my supervisor, Dr. Gan Chin Kim for guiding me through my final year project development. Knowledge and extra input given by him has highly motivated me to successfully complete this project. The information, suggestions and ideas given by him played huge role in developing a fully functional project.
vi
ABSTRACT
vii
ABSTRAK
viii
TABLE OF CONTENTS
CHAPTER TITLE PAGE
ACKNOWLEDGEMENT v
ABSTRACT vi
TABLE OF CONTENTS viii
LIST OF TABLES x
LIST OF FIGURES xi
LIST OF APPENDICES xiv
1 INTRODUCTION 1
1.1 Research Motivation 1
1.2 Problem Statement 2
1.3 Project Objective 3
1.4 Project Scope 3
2 LITERATURE REVIEW 4
2.1 Introduction 4
2.2 Research on Demand Side Load Management of Smart Grids 4 Using Intelligent Trading/Metering/Billing System 2.3Research on an Electronic Meter for Measuring the Saving 5
In Electrical Power 2.4 Research on the Design and Implementation of Bluetooth 5
Energy Meter 2.5 Research on an Implementation and Evaluation of the 5
ix
3 METHODOLOGY 7
3.1 Project Methodology 7
3.2 Divide the Work Packages (Phase) 8
3.3 Project Development 9
3.4 Expected Result 12
3.5 Project Design 13
4 RESULT & DISCUSSION 24
4.1 Introduction 24
4.1.1 Development of Energy Demand Response 25
Control Interface 4.1.2 Simulation circuit for Development of 27
Energy Demand Response Control Interface 4.2 Analysis 35
4.2.1 Current Sensor 35
4.2.2 Demand Response Controller 39
4.2.3 Potential energy saving that can be 49
Achieved by the controller 4.3 Discussion 50
5 CONCLUSION & RECOMMENDATION 52
5.1 Conclusion 52
5.2 Recommendation 53
REFERENCES 54
APPENDICES 56
x
LIST OF TABLES
TABLE TITLE PAGE
4.1 Toaster analysis 38 4.2 Load power and multi meter reading 40
4.3 Maximum overloads level testing 45
4.4 Medium overloads level testing 45
4.5 Low overloads level testing 46 4.6 The total load power (W) when demand response controller 48
is activated
xi
LIST OF FIGURES
FIGURE TITLE PAGE
1.1 Typical daily weekday system load profile 1 1.2 Ideal TNB electricity generation demand 2
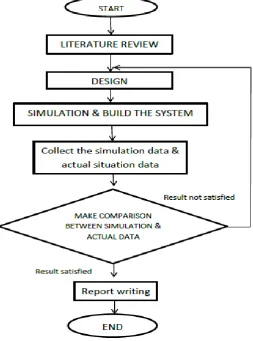
3.1 Flowchart of the methodology 7
3.2 Flowchart of process involved in Energy Demand Response Control Interface
10
3.3 Block diagram about process involved in Energy Demand Response Control Interface
11
3.4 Flowchart of process involved in developing PIC microcontroller based on project
13
3.5 SK40C 14
3.6 Circuit diagram of SK40C 15
3.7 UIC00B with USB and rainbow cable 15
3.8 Current Sensor 16
3.9 Current Sensor ACS756 outputs an analog signal, VOUT 16
3.10 Relay schematic diagram 17
3.11 Liquid Crystal Display 18
3.12 3.13 3.14 3.15 3.16 3.17 3.18
Mounting Board of Demand Response Controller Flow chart of software development of the project Ironing Process
Etching Process Drilling Process Soldering Process
Testing and Troubleshooting
xii 4.1 4.2 4.3 4.4 4.5 4.6 4.7 4.8 4.9 4.10 4.11 4.12 4.13 4.14 4.15 4.16 4.17 4.18 4.19 4.20 4.21 4.22 4.23 4.24 4.25 4.26 4.27 4.28 4.29 4.30 4.31 4.32
Demand Response Controller Load Monitoring Module
Three Type of Load(lamps) Voltage regulator, 12V and 24V
Simulation circuit for Development of Energy Demand Response Control Interface
Flowchart of Demand Response Controller Flowchart of TNB request „TIMER 1‟ Flowchart of TNB request „TIMER 2‟ Orcad Schematic
Layout Schematic
DC Voltage for Current Sensor
Output waveform of current sensor when DC voltage increases Toaster analysis using current sensor
Graph of Vdc versus Time Graph of Current versus Time
Graph of load power versus multi meter reading
When using 25W load, the output measured is Vrms = 631mV When using 60W load, the output measured is Vrms = 1.00V When using 100W load, the output measured is Vrms = 1.27 V „OFF SETTING‟ display
„Timer 1” is pressed Load 3 off
“Timer 2” is pressed Load 1 and 2 off
Power setting demand: 226W Maximum overload activated After load 1 is off: 142W
Load1 activated again
Power setting demand: 140W Load 1 and 2 off
After load 1and 2 off: 80W Load 2 activated again
xiii
4.33 4.34 4.35 4.36 4.37 4.38
Power setting demand: 75W Load 1 off
Load 1 and 2 off Load 1,2and 3 off
When total power is below the set point
When total power is below the set point, load 1 is turned on
xiv
LIST OF APPENDICES
APPENDIX TITLE PAGE
CHAPTER 1
INTRODUCTION
1.1 Research Motivation
[image:16.595.131.514.471.631.2]TNB customers are supplied with generated power from hydroelectric and thermal plants. This network system is made up of transmission lines, substations and distribution lines. Through this reliable system, TNB supplies electricity to customers consistently and continuously, as well as ensuring a balance between demand and supply at all times.
Figure 1.1: Typical daily weekday system load profile [1]
2
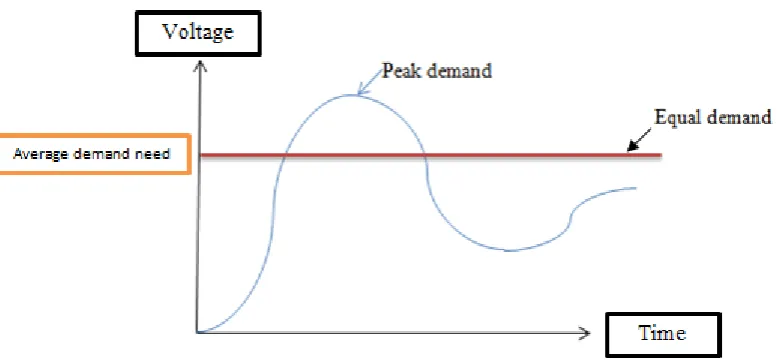
shown in Figure 1.2. If the customers demand continues as shown in Figure 1.1, it will cause high cost of demand and the generator can only be used for short period.
[image:17.595.85.474.172.354.2]
Figure 1.2: Ideal TNB electricity generation demand
1.2 Problem Statement
3
1.3 Project Objective
The main objectives of this project are:
To design a low cost device that able to manipulate the domestic household electric appliances in order to reduce peak level demand.
To develop a device that will operate automatically with the assist of microcontroller to help the customer plan the power usage without any manual calibration or interfaces.
1.4 Project Scope
To design and develop a device that will reduce energy consumption level of household electrical appliances automatically, hence helps to reduce energy consumption.
To control the energy usage to its optimum level according to the energy demand that been set by the user.
4
CHAPTER 2
LITERATURE REVIEW
2.1 Introduction
Reference and understanding is gained from various source such as books, journals, Internet and previous projects. These materials are used as the main source for the entire project. In this part, many journals were referred and analysed but only few selected journals which are essential for my research based on the objective of the project are reviewed.
2.2 Research on Demand Side Load Management of Smart Grids using Intelligent Trading/Metering/Billing System
5
gas and electric usage, power line communication (PLC) used to transfer data from smart meter to local server, control unit (DCUs) used to give the real time price information. Centre and local database stores and manage the billing details and also user details. This project mainly present about the demand management using DCU on smart grid.
2.3 Research on an Electronic Meter for Measuring the Saving in Electrical Power. This paper presents an electronic meter to measure electrical energy by using simple and hold method [4]. This method produces two type signal where one for peak value of line voltage (Vm) and second for instantaneous value of line current ,Vm,i.e,Im cos F where F for phase angle measured between Vm and Im. Multiplication of both signals over predetermined period gives the energy usage value. Voltage of frequency converter (VFC) are used for digitize the electrical energy signal. This project use simple equipments for electrical energy measurement. This project gives good result under different loading conditions and with a power factor ranging from low to high value.
2.4 Research on the Design and Implementation of Bluetooth Energy Meter.
6
2.5 Research on an Implementation and Evaluation of the Apparatus for Intelligent Energy Management to Apply to the Smart Grid at Home.
Smart grid system based on Advance Metering Infrastructure (AMI) is used to record and control the energy usage by using demand response technique [6]. This paper analyzed the impact of energy saving based on the change of price and its verification through lighting control system. This smart controller operates as a smart lighting controller at homes where it is installed with lighting devices. The demonstration system is consists of three smart controllers connected lighting devices as an electric appliance which does not support the smart grid capability and is operated with the AMI. The device also communicated with PC, network module and smart controller that interface with electrical equipment. Smart controller is placed between illumination and plug, illumination power to get the detail of energy usage cost from PC that performs as AMI. If the energy unit cost high, it will cut off the power and return to normal after certain time. The function of smart controller is based on smart grid concepts where the more the load increases, the more the price of electricity rise in smart grid. This research propose TOP condition consist of Low, Medium, and High state. When the price is in the "Low" state, a user can choose any one of illuminations, in case of the "Medium" state, the incandescent lamp will be turned off whereas when the price is in the "High" state, the user only makes use of the fluorescent tube.
2.6 Conclusion
7
CHAPTER 3
METHODOLOGY
3.1 Project Methodology
[image:22.595.185.439.350.692.2]This part explained about the methods used in conducting the project in more efficient and systematic way. Figure 3.1 shows the flow chart of the methodology.
8
In order to achieve the objective of the project, the first step need to consider is a comprehensive reading and literature review on ITMBS system, an electronic meter, Bluetooth energy meter and microcontroller. Next, the most important step need to be considered is the hardware and software familiarization. Hardware that is used in this project includes current sensor and microcontroller whereas the MPLAP software is used for the microcontroller programming. After that, the process is continues with designing and developing the demand response controller using current sensor, PIC, relay, liquid crystal display, and push button. Simulation is done for the system by using Proteus. Once the hardware and software development was done, the software was programmed into the Microcontroller and integrated into the hardware. The system was troubleshoot to detect any problem and once the rectification is done, system will be integrated again and observation continues. Then, analysis is done to obtain all the results and data related in developing the demand response controller. At last, the final report was prepared.
3.2 Divide the Work Packages (Phase) Phase 1: Project analysis
Gather information regarding the project by reviewing journals, books, previous projects, and also website. This information is very useful to complete the project proposal.
Phase 2: Software development
By using computer simulation software (Proteus), the control interface hardware to detect the overload energy is designed.
Phase 3: Hardware analysis
Research and study about the components that are going to be used in developing demand response system.
Phase 4: Hardware development
9
3.3 Project Development
The Figure 3.2 and Figure 3.3 show about process involved in developing the „Energy Demand Response Control Interface‟ for domestic usage.
First of all, in normal residential connection, the main supply from TNB line is connected to distribution box (DB) which distributes electricity directly to the loads. But in this project, the normal connection is upgraded by fixing current transformer at the middle of connection between TNB line and distribution box. This is to ensure that the current and frequency input in the range 0-50A and 50/60Hz and measures output dc voltage in the range 0-5V to PIC.
There are two main inputs in PIC that is, keypad and push button which are used to set the total household power usage measured in kilowatt (kW). Push button that we are using has 3 options. First option is do nothing meaning that the customer do not care if overload occur as they still need the electricity. Second option is off the circuit for certain period such as, example from 6pm to 10pm the circuit is off by press the button. This option is based on TNB request to save household energy usage. And the third choice is off partially meaning that off either one load for certain period.
![Figure 1.1: Typical daily weekday system load profile [1]](https://thumb-us.123doks.com/thumbv2/123dok_us/138468.15612/16.595.131.514.471.631/figure-typical-daily-weekday-load-profile.webp)