2015.Available online: www.worldscholarsjournals.org/ajaar
©2015 World Scholars Journals (AJAAR ISSN: 2354-3817)
Date accepted August
Full Length Research Paper
Comparative Economic Analysis of Three Cassava
Processing Technologies
In Cross River State, Nigeria
1
Inyang Nyambi N,
2Obuo PO. &
3Arigor AJ.*
1
Cross River State Commercial Agriculture Development Project, World Bank Assisted , ADP Premises, Opposite Margerate Ekpo International Airport, Calabar
2&3
Dept of Agricultural Economics/Extension University of Calabar, Calabar Correspondence:[email protected]
ABSTRACT
This study was carried out to compare the economics of processing Cassava using three indigenous technologies. Data was collected from 180 cassava processors grouped into three processing methods garri, foofoo and tapioca across the state. Collected data were analysed using descriptive statistics, gross margin analysis and the analysis of variance (ANOVA). The results showed that all processing methods were profitable. However, the profit per kg from garri was lower than that of foofoo and this was lower than that for tapioca. There was also a significant difference in their profit level at 1%. The LSD also showed significance at 1% for any three of the methods. The profit made per kg of cassava processed has a potential to boost not only the local but also the national economy. The study recommends that cassava processing into other forms that can be stored for longer periods should be explored for greater economic growth.
Key words: Cassava processing, Profit, Economic Analysis, ANOVA, National Economy
INTRODUCTION
Many tropical countries of Africa, Asia and Latin America cultivate Cassava (Manihot esculenta crantz). Nigeria, Zaire, Brazil, Indonesia, India and Colombia are the largest processors, but most of the processed products
are consumed locally and only a few quantity of the total output from these countries is exported in forms of pellets, chips, dough, flour etc. Over the years, Thailand top the list of countries as the world largest exporter of cassava products (Nweke,2003; FAO,2005). In the last decade, most of the cassava producing countries has
greatly increased their processing and are competing favourably in the world emerging market of cassava products with Nigeria gaining a superior advantage in terms of export, (Manyong et al, 2005). According to Okuneye (2003), Processed Cassava products are very rich in starch and are good source of energy. It contains significant amount of calcium (50 mg/ 100 g), phosphorus (40 mg/100 g) and vitamins (25 mg/100 g). However, they contain little or no protein. In contrast, cassava leaves are good source of proteins if supplemented with the amino acid methionine despite containing cyanide (FAO, 2003). Nigeria’s current level of production is at 34 million metric tones per year, with high consumption index relative to other staples like maize, yam and rice (Odoemenem and Otanwa, 2011). Kormawa and Akoroda, (2003) and Oke (2005) reported that approximately 16 percent of cassava roots produced in Nigeria in 2001 was used as chips in animal feed, 51 percent was processed into syrup concentrate for soft drinks, and less than 1 percent was processed into high quality cassava flour used in biscuits and confectionary, dextrin pre-galled starch for adhesives, starch and hydrolysis's for pharmaceuticals, these estimates left about 84 percent or 23.9 million tones of production for food consumption. Owing to the high consumption index in the traditional food oriented market and the emerging market of industrial processed product, research emphasis on processing has increased tremendously over the past few years (Nweke, 2004; Adebayo, 2009). The importance of food processing in national development is underscored by the new national policy on agriculture, which assigns two major goals for agricultural commodity processing: i. processing commodities and accelerating the growth of the agricultural sector .ii. Preservation of commodities to reduce waste and seasonal price fluctuations (Mangyong et al, 2005). Kaine (2009) in his study identified two basic methods of cassava processing to include, the indigenous or traditional method and the modern method utilized all over the region of cassava production (Chukwuji et al, 2007). Adebayo et al, (2003) disclosed that several techniques are employed in processing various cassava products. He identified the indigenous methods which comprise of, peeling, washing, grating, fermentation, dewatering, granulation, drying, milling and packaging as well as fortification with red palm oil (Kaine,2011;Ohadike,2007). According to Ferris et al
(1998),various products has their appropriate technology and these products include, garri, foofoo, tapioca, starch, flour, chips, ethanol etc. Some of the locally consumed products for instance garri has attained some level of semi- mechanize and complex level of processing techniques which has reduced the cumbersomeness, guarantee sufficiency with the attendant cost. Others such as foofoo and tapioca relied solely on the traditional
method with cost effective
advantage(Ndaliman,2008;Oluwemimo,2010).
Cross River State produce cassava in all its ecological zones and it is the major staple in the form of garri, foofoo, and tapioca. These products are supplied to other states through the locally food marketing channel while processed products like garri and flour package by cottage industries in the state are exported to neighboring countries like Cameroon and Niger. In spite of the economic importance of cassava products, the processing capacity is at cottage level using indigenous technology by peasant farmers mainly at farm gate. This study seek to compare the economic analysis of the various indigenous processing technologies and make policy recommendation to enhance economic growth.
METHODOLOGY
This study was conducted in Cross River State (05o21’- 06o56’ N; 008o00’ - 009o12’ E), Nigeria. The vegetation spans from a mangrove swamp and rainforest south to a derived savannah north. There are two major seasons in the year namely; the wet and the dry seasons. The wet season, which begins in April and ends in October with a break in August referred to as “August Break”. The dry season usually lasts for about four months beginning in November. The average annual rainfall is about 121.1mm per month evenly distributed throughout the year with relative humidity of 84 percent during the wet season. Agriculture is the major occupation of the people as they grow both plantation and arable crops such as cocoa, oil palm, rubber, cassava, yam, rice, cocoyam, maize beans, groundnuts and vegetables. Households also keep livestock such as sheep, goats, poultry, pigs, etc. Sample Selection
Cross River State is made up of 18 local government areas (L.G.As) which are grouped into three agricultural zones, South, Central, and North. Cassava production in the state takes place in all the agricultural zones and each zone comprised of six LGAs. One LGA from each zone (South- Biase; Central- Obubra; North- Yala) were purposively selected for the study. The lists of communities in the selected LGAs were collected from the Community Development Office at the LGA headquarters. From this list, one community was randomly selected from each LGA, making a total of three communities. The sampling frames were the lists of garri, foofoo and tapioca processors in the selected communities. From each of the list, 20 processors were randomly selected from the three communities making a sample size of 180 garri, foofoo and tapioca processors. The data collected were analysed using descriptive statistics, gross margin analysis and Analysis of variance (ANOVA). Descriptive statistics such as mean, percentages and frequency distribution were employed to analyse the socio-economic characteristics of the
processors. Gross Margin analysis was used to assess the profit margin of the technologies while Analysis of Variance (ANOVA) was used to compare the three processing cassava technologies. Implicitly the gross margin is applied as
Gross Profit Margin (GPM) = Sales – Cost of Processing Sales Profit per Kg of the three processing technologies was also used as a basis for comparison
The ANOVA for comparison of means of sample more than two groups ( garri, foofoo and tapioca) is stated below
Where,
The variance of the means, , is an estimate of the standard error of the mean squared, . Thus the variance of the population may be found by multiplying the standard error of the mean squared ( ) by N, the size of each sample.
. This value is called the Mean Squares Between the groups (garri, foofoo and tapioca) and is often symbolized by MSB. The computational procedure for MSB and MSW
are presented below: and
The expressed value is called the Mean Squares Between and Within, because it uses the variance
between and within the sample means to compute the
estimate.
The F-ratio is computed by dividing the MSB by MSW.
This is illustrated below:
If greater than one implying a means different between the three groups of processing technologies ( garri, foofoo and tapioca)
Data, 2012
Results from table 1 above indicate that Most 32.2.6% of the respondents were aged 41 – 50 years, while 25.6% of them were aged 31-40 years and 25.5% aged were 51-60 years. The mean age of the farmers was 32.2 years, which indicates that the processors were at their productive stage of life to process the available quantities
of cassava in the locality using the three technologies. Married processors were in the majority, 49.4% while 25.0% of them were still single. 625.5% of the farmers were widow or widower. Since most of the cassava processors were married, they have added responsibilities that would make them increase the application of any of the technologies that is profitable, hence the availability of family labour. The distribution of processors according to educational attainment is presented in Table 1. Majority, 31.7% of the processors had no formal education, 26.7% had primary education while 19.4% had secondary education, and only 22.2% had tertiary education. This result shows a partial distribution indicating that the processors are making effort to acquire formal education which will boost the intensification of the technologies to explore greater economic benefits.
The result in table 1 showed that majority of the processors 51.7% bought the fresh tubers used in processing while 48.3% harvest the tubers from owned farm. This implies that two distinct occupation (cassava farming and cassava processing) exist in the area though majority are processors which an attempt to increase production will boost economic activities of the other value chain (processing and marketing). Source of labour (table 1) showed that majority of the processors (45%) used family labour, 35% used hired labour while 20% used both family and hired labour. Since most of the processors used family labour there is that tendency of cheap and readily available labour which can intensify the processing activities at low cost thereby increasing the profitability of the three processing technologies.
The result presented in table 2 above showed that the F-Ratio of the three technologies total cost of processing is 18.372 and is significant at 1% level. This implies that there is a significant difference in the total cost of processing of the three technologies .Cost associated with cassava processing in the area are variable cost which include the purchase of fresh tubers and the cost of Labour used in the processing technologies. Since each product garri, foofoo and tapioca go through different method of processing as revealed by Ferris et al (1998), hence, the variation of cost associated with the method.
Similarly, the F-Ratio of the revenue generated from the three processing technologies as shown above is 12.054 and is significant at 1% level. This implies that there is a significant difference in the revenue of the three processing technologies which may be attributed to the fact that each technology has its conversion rate efficiency given the same quantity of fresh tubers and the pricing mechanisms therefore varying quantity of product and the pricing with the attendant cost of each technologies can lead to revenue differential.
The F-Ratio of the three processing technologies profit is 12.412 and is significant at 1% level.This implies that there is a significant difference in the Profit of the three
RESULTS AND DISCUSSION
Table1: Distribution of rice farmers according to Socio-economic characteristics
Age Distribution(years) Frequency Percentage
21-30 31-40 41-50 51-60 30 46 58 46 16.7 25.6 32.2 25.5 Total 180 100
Martial Status Frequency Percentage Married Single Widow(er) 89 45 46 49.4 25.0 25.6 Total 180 100
Educational Attainment Frequency Percentage No Formal Education Primary Education Secondary Education Higher Education 57 48 35 40 31.7 26.7 19.4 22.2 Total 180 100
Source of tubers Frequency Percentage Owned farm Bought 87 93 48.3 51.7 Total 180 100
Table1:cont. Distribution of rice farmers according to Socio-economic characteristics Family
Hired
Both family & hired
81 63 36 45.00 35.00 20.00 Total 180 100
Source: Field Survey
Table 2:ANOVA Result of F Test for the Total Cost, Total Revenue and Profit of the Three Technologies
Source of variation Sum of squares Df Mean square F Sig
Total cost Between Groups 5.507E8 2 2.753E8*. 18.372 .000 Within Groups 2.653E9 177 1.499E7.
Total 3.203E9 179
Revenue Between Groups 1.320E9 2 6.6018*. 12.054 .000 Within Groups 9.693E9 177 5.476E7
Total 1.101E10 179
Profit Between Groups 3.989E8 2 1.995E8*. 12.412 .000 Within Groups 2.844E9 177 1.607E7
Total 3.243E9 179
*. The mean difference is significant at the 1% level.
.
Table 3: LSDResult Comparing the Cost, Revenue and Profit of the Three Technologies
Dependent Variable (I) proces s type (J) proces s type Mean
Difference (I-J) Std. Error Sig.
95% Confidence Interval
Lower Bound Upper Bound
Cost per kg Garri Foofoo 4.22500* .93436 .000 2.3811 6.0689 Tapioca -10.34183* .93436 .000 -12.1858 -8.4979 Foofoo Garri -4.22500* .93436 .000 -6.0689 -2.3811 Tapioca -14.56683* .93436 .000 -16.4108 -12.7229 tapioca Garri 10.34183* .93436 .000 8.4979 12.1858
Foofoo 14.56683* .93436 .000 12.7229 16.4108 Rev per kg Garri Foofoo -4.16800* .97184 .000 -6.0859 -2.2501
Tapioca -24.71167* .97184 .000 -26.6295 -22.7938 foofoo Garri 4.16800* .97184 .000 2.2501 6.0859
Tapioca -20.54367* .97184 .000 -22.4615 -18.6258 tapioca Garri 24.71167* .97184 .000 22.7938 26.6295
Foofoo 20.54367* .97184 .000 18.6258 22.4615 Profit per kg Garri Foofoo -8.66800* 1.00859 .000 -10.6584 -6.6776
Tapioca -14.89767* 1.00859 .000 -16.8881 -12.9073 foofoo Garri 8.66800* 1.00859 .000 6.6776 10.6584
Tapioca -6.22967* 1.00859 .000 -8.2201 -4.2393 tapioca Garri 14.89767* 1.00859 .000 12.9073 16.8881
Foofoo 6.22967* 1.00859 .000 4.2393 8.2201
processing technologies. The results further shows that the mean revenue(6.6018) generated from the products(garri, foofoo and tapioca) is higher than the mean total cost(2.753E8) that is cost of tubers and labour an indication of a positive Gross Profit Margin which means that the three processing technologies are profitable.
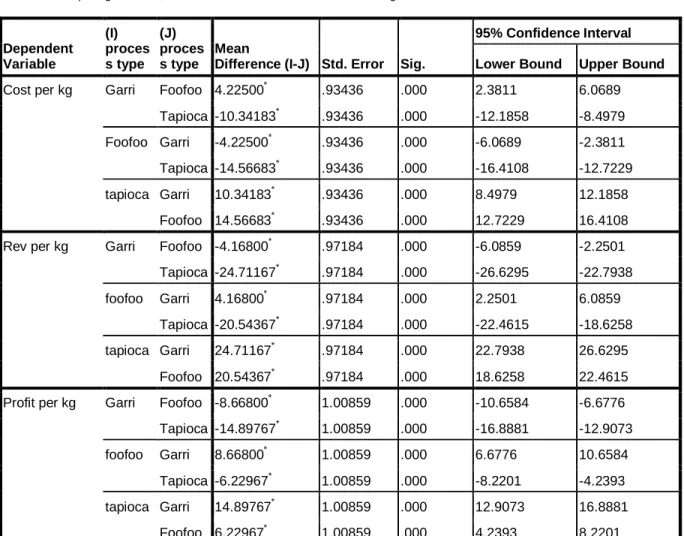
The mean difference of the cost per kg of the three processing technologies were garri (4.22500); foofoo (-4.22500); tapioca(10.34183) and were all significant at 1% (Table3).This implies that the cost of processing a kg of foofoo is lower than garri and this is lower than that of tapioca. The Least Significant Difference (LSD) also showed significance at 1% level indicating that for any of the three technologies, there is a variation of cost used in processing each Kg.
The means difference of the revenue generated per kg of the three processing technologies were garri (-4.16800); foofoo (4.16800); tapioca(24.71167) and were all significant at 1% (Table 3).This implies that the revenue generated from the sales of a kg of garri is lower than that of foofoo and this is lower than that of tapioca. The Least Significant Difference (LSD) also showed significance at 1% level indicating that for any of the three technologies, there is a variation of revenue generated from each Kg.
The mean difference of the profit per kg of the three processing technologies were garri (-8.66800); foofoo (8.66800); tapioca(14.89767) and were all significant at 1% (Table 3).This implies that the profit from garri is lower than that of foofoo and this is lower than that of tapioca. The Least Significant Difference (LSD) also showed significance at 1% level indicating that for any of the three technologies used, there is a variation in the profit level made from each Kg.
CONCLUSION
The three cassava processing technologies in Cross River State vary in terms of economic advantage to the processors. The analysis indicated that the cost, returns and profit of the three cassava processing technologies differs and any of the three technologies are profitable. However, the profit per kg from garri was lower than that of foofoo and this was lower than that for tapioca. There was also a significant difference in their profit level at 1%. The LSD also showed significance at 1% for any three of the methods. The profit made per kg of cassava processed has a potential to boost not only the local but also the national economy. The study recommends that cassava processing into other forms that can be stored for longer periods should be explored for greater economic growth.
References
Adebayo K.(2009) Dynamics of technology adoption in rural-based cassava processing enterprises in South-West Nigeria International
Journal of Agricultural Economics & Rural Development(IJAED) – 2(1).
Adebayo K, JL White, MJ Morris, AO Dipeolu, IA Ayinde, TS Wandschneider LO, Sanni OB, Oyewole K. Tomlins and A. Westby (2003) “Innovativeness and Stakeholdership in the fufu processing systems in Southwest Nigeria”. International Journal of Agricultural Sciences, Science, Environment andTechnology Series A, 3 (4):15-27.
Chukwuji CO, Inoni OE, Ike PC. (2007). Determinants of technical
efficiency of garri processing in Delta state, Nigeria. Journal of
Central European Agriculture, 8(3): 327-336.
Ferris RSB, G Ntibarikure, SM Kolyn, and A.N. Muganga (1998) Developing Value – added Markets for Cassava in East and Southern African in Root Crops in the 21st Century. Centre International Conference Cotonou, Benin 11-7 Octobar Pp 735-740.
Food and Agricultural Organization Agriculture (2005). Food Outlook, pp: 36
Food and Agricultural Organization Agriculture(2003) Food and Nutrition for Africa: A Resource Book for Teachers of Agriculture. Publishing Management Group, FAO information Division, FAO of the United Nations 00100 Rome, Italy, pp: 202-207.
Kaine, AIN. (2011) Investigation of Factors Affecting Technical Infancy of Akpu Processing in Delta State, Nigeria J Hum Fcol, 33(2): 133-137
Kaine AIN. (2009). Economic analysis of altercnative cassava processing technologies. A case study of delta North agricultural
zone, Delta State, Nigeria. Journal of Science and Technology, 8(1):
73- 78.
Kormawa P, Akoroda MO 2003. Supply Chain Arrangement for
Industrialization in Nigeria. Ibadan: IITA.
Manyong VM, Ikpi A, Olayemi JK, Yusuf SA, Omonona BT, Okoruwa V, Idachaba FS (2005).“Agriculture in Nigeria: Identifying Opportunities for Increased Commercialization and Investment”. IITA, Ibadan.National Population Commission (NPC) (2006). “Nigeria’s National Census” NPC, Abuja.
Ndaliman MB 2008. Development of Casssva Grating Machine. A
-Dual-Operational Mode. Leonardo Journal.
http:///jsacdemicdirect.Org/A09/103_110 (Retrieved September 16, 2009).
Nweke FI. 2004. New challenges in the cassava transformation in Nigeria and Ghana. A View point IITA research No.14/15NPC, 1996. National Population Census, pp: 21.
Nweke FI 2003. New challenges in the cassava transformation in
Nigeria and Ghana. Paper Presented at the In WENt, IFPRI, NEPAD
and CTA Conference on Success inAfrican Agriculture. Pretoria. December 1-3, 2003.
Odoemenem IU. and L.B. Otanwa 2011 Economic Analysis of Cassava Production in Benue State, Nigeria Current Research Journal of Social Sciences 3(5): 406-411,ISSN: 2041-3246.
Ohadike DC. 2007. The influenza pandemic of 1918-19and the spread of cassavaCultivation on the lower Niger. A study in Historical linkages. J. Afr. History,22: 379-391.
Oke OL. 2005. Cassava yesterday and tomorrow. Ife lectures series, No
7. The Post- Graduate College, Obafemi Awolowo University,
Ile- Ife, Nigeria.
Okuneye PA (2004). “Rising Cost of Food Prices and Food Insecurity in Nigeria and its Implication for Poverty Reduction” CBN Econ. Finan. Rev. 39(4).
Oluwemimo Oluwasola 2010 Stimulating rural employment and income for cassava (Manihot sp.) Processing farming households in Oyo State, Nigeria through Policy initiativesJournal of Development and Agricultural Economic (http://www.academicjournals.org/jdae) Vol. 2(2), pp. 018-025.