City, University of London Institutional Repository
Citation
:
Somani, G., Gaur, M. S., Sanghi, D., Conti, M. and Rajarajan, M. (2018). Scale
Inside-Out: Rapid Mitigation of Cloud DDoS Attacks. IEEE Transactions on Dependable and
Secure Computing, 15(6), doi: 10.1109/TDSC.2017.2763160
This is the accepted version of the paper.
This version of the publication may differ from the final published
version.
Permanent repository link:
http://openaccess.city.ac.uk/21584/
Link to published version
:
http://dx.doi.org/10.1109/TDSC.2017.2763160
Copyright and reuse:
City Research Online aims to make research
outputs of City, University of London available to a wider audience.
Copyright and Moral Rights remain with the author(s) and/or copyright
holders. URLs from City Research Online may be freely distributed and
linked to.
City Research Online:
http://openaccess.city.ac.uk/
[email protected]
For Review Only
Scale Inside-out: Rapid Cloud DDoS Attack Absorption and
Mitigation
Journal: Transactions on Information Forensics & Security
Manuscript ID Draft
Manuscript Type: Regular Paper
Date Submitted by the Author: n/a
Complete List of Authors: Somani, Gaurav; Central University of Rajasthan, Computer Science and Engineering; Malaviya National Institute of Technology
Gaur, Manoj; Malaviya National Institute of Technology, Computer Science and Engineering
Sanghi, Dheeraj; IIT Kanpur, CSE
Conti, Mauro; Università di Padova, Mathematics
Rajarajan, Muttukrishnan; City University London, School of Engineering and Mathematical Sciences
EDICS:
CYB-APP-CLOU-Cloud computing < CYB-CYBERSECURITY, NET-ATTP-DOS-Denial-of-service attack < NET-NETWORK SECURITY, NET-ATTP-Network attacks and protection < NET-NETWORK SECURITY
For Review Only
Scale Inside-out: Rapid Cloud DDoS Attack
Absorption and Mitigation
Gaurav Somani,
Member, IEEE,
Manoj Singh Gaur,
Member, IEEE,
Dheeraj Sanghi,
Mauro Conti,
Senior Member, IEEE,
and Muttukrishnan Rajarajan,
Senior Member, IEEE
Abstract—DDoS attack mitigation requires quick absorption of attack data which is usually achieved by dynamically scaling the cloud resources to quickly identify the onslaught features to combat the attack. The scaled resources come with an additional cost which may prove to be a huge unplanned cost in the cases of longer, sophisticated and repetitive attacks. In this work, we address an important problem, whether the victim service resource scaling during attack, always result in rapid DDoS mitigation. For this purpose, we conduct real-time DDoS attack experiments to study the attack absorption and attack mitigation for various target services in the presence of dynamic scaling. We found that the activities such as attack absorption which provide timely attack data input to attack analytics, may be adversely affected by the heavy resource usage generated by the attack. We show that the operating system level local resource contention should be reduced during attacks to expedite the overall attack mitigation, which may not be completely solved by the dynamic scaling of resources alone. We develop a novel relation which terms “Resource Utilization Factor” for each incoming request as the major component in forming the resource contention. To overcome these issues, we propose a novel “Scale Inside-out” approach which during attacks, reduces the “Resource Utilization Factor” to a minimal value to quickly absorb the attack. The proposed approach sacrifices victim service resources and provide those resources to mitigation service in addition to other co-located services to ascertain their availability during attack. Experimental evaluation show up to 95% reduction in total attack downtime of the victim service in addition to considerable improvement in attack detection and reporting time and downtime of co-located services.
Index Terms—Cyber Threat Intelligence, Cloud Computing, DDoS attacks, Security and protection (e.g., firewalls).
I. INTRODUCTION
C
YBER threat incidents are increasing day-by-day withchanging attack vectors. At the same time, evolution of “Big Data” and “Security Analytics” paradigms are helping the victims to sustain and combat the emerging cyber threats [1]. The on-demand resource capabilities provided by cloud com-puting, fulfill the resource needs of processes involving threat intelligence and possible mitigation[2]. Business intelligence
Gaurav Somani is with the Central University of Rajasthan, Ajmer, India and with the Malviya National Institute of Technology, Jaipur, India, E-mail: [email protected].
Manoj Singh Gaur is with the Malviya National Institute of Technology, Jaipur, India, E-mail: [email protected].
Dheeraj Sanghi is with the Indian Institute of Technology, Kanpur, India, E-mail: [email protected].
Mauro Conti is with the University of Padua, Italy, E-mail: [email protected].
Muttukrishnan Rajarajan is with the City University of London, UK, E-mail: [email protected]
Manuscript received August 31, 2016; revised
and analytics are helping all the areas of e-commerce, health-care, politics, science, security, and safety [3]. Discussion such as the ones in [4] [5] provides a number of application areas where the big data analytics is helping in defending the cyber attacks. Gartner anticipated in 2014, that by 2016, “Big Data Analytics” will have a major role in cyber security [6]. Even-tually, a large portion of enterprises rely on security analytics using big data and machine learning to circumvent the cyber attacks in 2016 [7]. There is a number of reports by major security research institutions which state about the immense role of big data analytics in combating the flourishing cyber attacks[8] [9] [10]. Among the large number of cyber attacks, DDoS attack is one of the most prominent attack which has affected a majority of organizations across the globe[11]. The maximum DDoS attack size which was only 8 Gbps in 2004 has now increased well above 500Gbps in the year 2015. The effects and origins of DDoS attacks saw a tremendous variation in terms of attack scale, sources, duration, repetition and sophistication. On the other hand, after the evolution of utility computing models, services such “DDoS for Hire” [12] and “DDoS Mitigation as a Service” [13] [14] are available in the market to shape these attacks and their mitigation processes as opponents in the “cyber war”. Most of the analytics based DDoS defense mechanisms are mainly based on incoming traffic feature assessment [15]. Defense methods primarily work online and perform a threshold based anomaly detection in the incoming traffic which follows learning based on past attacks.
Attack data absorption is an important milestone before triggering any analytical threat intelligence activity. Many of the recent solutions are based on the dynamic resource scaling which advocate to use quick deployment of enormous resources to absorb the attack as quickly as possible [16] [17]. These solutions achieve the quick attack absorption by min-imizing the attack surface. Though the cost implications of the resource scaling can be against the sustainability of the organizations in case of budgetary limitations or specially in case of persistent, stealthy or repetitive attacks. During massive and extreme DDoS attacks the resources of victim services, are stressed heavily. The legitimate traffic coming to the victim services does not get service responses during the downtime resulted due to the attack.
The effects of the attack depends upon the target application resource usage, as the attacks may result into an extreme resource contention which may affect the attack absorption and subsequent threat mitigation adversely. The resource con-tention may be severe enough such that the mitigation methods 1
For Review Only
may not get the needed resources to perform the necessary processing in time. Additionally, the attacks may also affect non-target co-located services on the same victim machine which might be very critical for the recovery and monitoring (for example a remote login utility). There are recent incidents which even show evidences of mitigation methods/tools get-ting attacked during DDoS attacks [18]. Additionally, attackers are using DDoS attacks to smokescreen and perform other severe attacks behind the DDoS attacks [19] [20].
To effectively showcase the observations made in this work, we do extensive attack experiments on various kinds of victim applications with resource scaling in place. We observe some important behaviors related to the attack absorption and attack mitigation.The resource scaling may also become less effective in case the resource contention is not properly managed during the attack. The major component to the heavy resource con-tention is the “Resource Utilization Factor” for each incoming request which if lowered down in the presence of attack, may solve the issues related to the contention. We argue that during the attack downtime, the easy availability of the basic resources such as CPU, memory, disk, and bandwidth results into quick attack absorption and subsequent attack mitigation processes. We propose a novel mechanism to lower down the “Resource Utilization Factor” of the victim service during the attack. We name this approach as “Scale Inside-out” by doing in-resource scaling of the victim application. The major idea behind our proposed approach is to sacrifice the victim service resources during downtime and contention to expedite the overall attack absorption and attack mitigation processes. We also provide a formal model of attack absorption and outline its major requirements in this work.
The rest of the paper is organized as follows. Section II shows the relationship between cyber threat intelligence and attack absorption which forms the main basis of attack miti-gation. We show our initial attack experiments to prepare the requirements of effective mitigation based on the important observations in the attack outcomes in Section III. We give a formal model of resource utilization factor and its role in the attack mitigation process in Section IV. In Section V, we describe the proposed approach and its detailed working. We give experimental evaluation in Section VI. Section VI also provides a detailed discussion on the outcomes and their applicability. We provide an analysis of the related work in Section VII. Finally, we conclude our work with a light on the future work in Section VIII.
II. CYBERTHREATINTELLIGENCE IN THECLOUD
In Figure 1, We present a generic information flow dia-gram showing the DDoS attack source, participants, target infrastructure and cyber threat intelligence to combat any possible attacks. DDoS attacks are normally coordinated by a command and control server which may control a large number of possible attack sources in the form of bot run zombie computers. The attack sources may include phones, servers, desktops, PDAs, cloud VMs or more recently other Internet of Things devices (IoT). After the emergence of cloud computing there are attack incidents which are even using cloud resources
(BotClouds) to originate such attacks as a service [21]. Most of the recent notorious attacks are reflection and amplification attacks which also include attacks on many popular cloud services[11]. The share of cloud services among all the at-tack victims worldwide has reached a considerable mark of 33%[11]. The victim services on clouds run inside virtual machines (VMs) on a virtualized multi-tenant environment. Cloud services are termed to show additional DDoS attack effects due to their mutli-tenant and on-demand computing and pricing based business model [15]. These additional attack effects include economic losses and a number of collateral damages on non-targets[22]. Cyber threat intelligence related to DDoS class of attacks may intend to provide a complete security framework which involves implementing methods to prevent, detect and recover from DDoS attacks.
A. Input to Threat Intelligence
Detection methods are mostly functions used to identify patterns in the incoming traffic and logs [8]. Attack data which is mostly collected from the victim server file system/logs may be supplemented by other collected data from other parts of the overall network. Additional important inputs to the threat intelligence include security analytics in the form of security knowledge based updates about the newer threats and methods. Additional compute, storage and bandwidth resources may also be provided as inputs to perform the attack analytics, associated computation, maintain the availability, fasten the attack absorption and recovery. In many of the large scale and sophisticated attacks, manual human intervention is required to achieve the goals of threat intelligence. Attack absorption is most important aspect for our work and a key ingredient to the success of timely and efficient attack mitigation and subsequent service availability.
B. Threat Intelligence Outcomes
Threat intelligence outcomes include identified attacks, at-tack sources and atat-tack vulnerabilities [8]. Atat-tack mitigation will have methods which will block the attack sources to send any incoming traffic further and drop any established attack connections. Service recovery to gain availability may require some time due to a range of attack mitigation activities. If the attacks remain present for longer duration or remain undetected due to the stealthy and sophisticated nature, may even delay the recovery further. We show in Figure 1 about additional outcomes in the form of new and incremental “threat knowledge” which updates the existing knowledge base of threat intelligence. To extend our discussion towards the major findings of our work, we expand the discussion of the generic cyber threat intelligence towards real attack analytics. We detail the real attack experimental study with critical aspects of attack absorption, mitigation and recovery in Section IV.
III. REAL-TIMEATTACKS: CRITICALASPECTS
The cyber threat intelligence flow discussed in Figure 1 shows attacks origin, generation, attack target and attack 1
For Review Only
Victim VM
Cloud Infrastructure
Attack Identification
Attack Mitigation
Service Recovery
Intelligence Updates
Attackers
Attack Data
Target Defense
Resources Cyber
Threat Intelligence
Network Data
[image:5.612.71.537.55.195.2]Security Analytics
Fig. 1: Cyber Threat Intelligence and Role of Attack Absorption
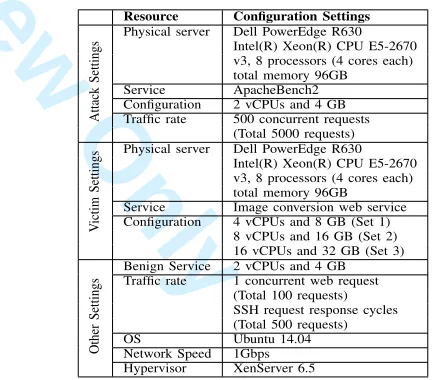
mitigation. In this section, we will try to see the attack dynamics from its origin to detection and mitigation with the help of real attack experiments. To achieve these aims, we use an attacking cloud and a victim cloud running VMs as attack and defense infrastructure respectively. We show various configuration settings related to the attack experiments in Table I and the experimental setup in Figure 2. The victim service is a dynamic file conversion website which converts an image from one format to another format on each service
request. In this set of experiments, we are using.jpegimages
of size 2MB to a .pngimage. On the other hand, we send
attack traffic with 500 concurrent requests from a single attack VM. We do not send the attack traffic from multiple sources to achieve a deterministic attack detection time over multiple repetitions of the experiments. In case of multiple sources, the attack detection time varies depending upon the connection share of each attack source in the total number of established connections at victim server end. Moreover, the main focus of our experiments is on the attack absorption and its subsequent mitigation at the victim side which are purely victim side processes. We planned the attack traffic with the help of the classical work [23].
Attack Infrastructure
Victim Infrastructure Attack VM Victim Web Service
Benign User
[image:5.612.311.529.393.583.2]Administrator (SSH)
Fig. 2: Experimental Setup
To demonstrate the service availability behavior of the victim service under attack, we use a host to send benign traffic by sending one concurrent request for a total of 100 requests. We are also interested to see the behavior and performance of other critical services which are co-hosted with victim service on the same VM. For this purpose, we design a test to assess the availability of secure shell (ssh) by sending a ssh session request, establishment, and session close cycle. Test for ssh represents the communication medium by which the VM/victim service owner connects to the service. We scheduled the attack experiments in a manner such that the attack traffic, benign traffic and ssh requests are launched at the same time. We also aim at analyzing the performance
dynamics of attack absorption and other important attack mitigation and availability concerns while the victim VM gets more resources. For this purpose, in Set 1 experiments, we provide resources equivalent to an EC2 “C4” instance [24]. In Set 2, we expand these resources to see the attack dynamics with resources twice of C4 resources. We term Set 2 resources equal to two C4 instances. We expand these services to as high as four times as that of the basic C4 resources in Set 3 which are equivalent to four C4 instances. Instead of scaling the resources dynamically while the attack is present, we do three separate attack experiments to observe the effects on service downtime, attack detection time, and performance of other services. We study the attack mitigation behavior by placing a generic DDoS mitigation mechanism in place.
Resource Configuration Settings
Attack
Settings
Physical server Dell PowerEdge R630 Intel(R) Xeon(R) CPU E5-2670 v3, 8 processors (4 cores each) total memory 96GB Service ApacheBench2 Configuration 2 vCPUs and 4 GB Traffic rate 500 concurrent requests
(Total 5000 requests)
V
ictim
Settings
Physical server Dell PowerEdge R630 Intel(R) Xeon(R) CPU E5-2670 v3, 8 processors (4 cores each) total memory 96GB Service Image conversion web service Configuration 4 vCPUs and 8 GB (Set 1)
8 vCPUs and 16 GB (Set 2) 16 vCPUs and 32 GB (Set 3)
Other
Settings
Benign Service 2 vCPUs and 4 GB Traffic rate 1 concurrent web request
(Total 100 requests) SSH request response cycles (Total 500 requests) OS Ubuntu 14.04 Network Speed 1Gbps Hypervisor XenServer 6.5
TABLE I: Attack Experiment Detailed Settings
We use “DDoS-Deflate” which is one of the popular
open source DDoS mitigation tools which detects the attacks sources on the basis of a threshold on maximum number of connections [25] by a source. The detected attack sources are
then suitably blocked by a firewall such as iptables[26].
The main motivation behind using this specific method is due to its popular and widespread use in DDoS detection. It is also a generic representation of many other DDoS mitigation methods which work on incoming traffic features. Our results and their suitability is not dependent on the DDoS mitigation tools and any other similar DDoS mitigation tool can be used as a replacement. Additionally, in order to 1
[image:5.612.73.275.499.591.2]For Review Only
Resources Time of Time of Downtime Time to Maximum Minimum Average Attack Attack of Victim complete Response Response Response Detection (s) Reporting (s) Service (s) the requests (s) Time (s) Time (s) Time
Set 1 Unknown 2481 2481 2911.34 1507.68 4.053 29.11
Set 2 Unknown 931 931 1367.19 593.371 4.065 13.67
[image:6.612.107.505.50.188.2]Set 3 41.58 41.58 971 1384.13 956.895 4.071 13.8413
TABLE II: Performance of DDoS mitigation service during attacks
Resources Downtime Time to Maximum Minimum Average
of ssh complete Response Response Response
service (s) ssh requests (s) Time (ssh) (s) Time (ssh) (s) Time (ssh) (s)
Set 1 2269.46 2373.15 706.4 0.15 4.7463
Set 2 864.2 940.657 254.88 0.147 1.88131
Set 3 0 83.309 0.475 0.145 0.166618
TABLE III: Performance of SSH request-response behavior during attacks
generalize the observations and their wider applicability we use this generic connection based detection method. While performing the attack experiments, we keep a close eye on attack absorption behavior of the victim VM and the DDoS mitigation service. We achieve this by keeping a track of various metrics such as attack detection time, attack reporting time, downtime of victim service, service response time, number of attack requests served before the attack detection, downtime of ssh service, and response time behavior. One more behavior for which we are particularly interested to see the attack absorption behavior is the number of established connections during the attack period. Connection establish-ment depends on the server resources availability and the duration of connection cycle which comprises of connection-establishment and connection-close cycle. We will detail about this important factor while discussing the attack dynamics in Section IV.
A. Results and Important Observations
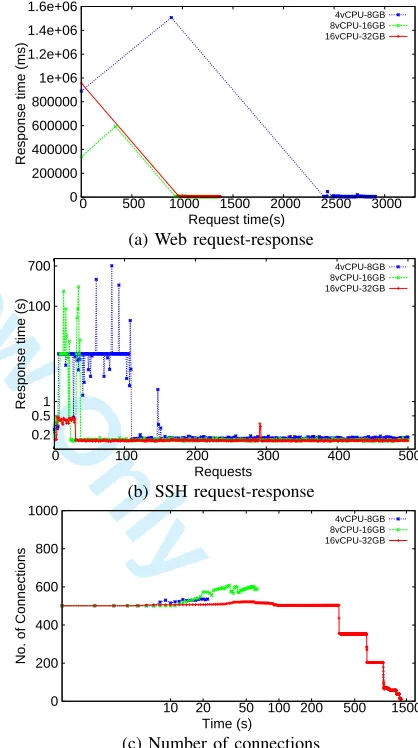
Various attack outcomes are shown in Figure 3, Table II and Table III for the three sets of victim resources, Set 1 (4 vCPUs-8GB), Set 2 (8 vCPUs-16GB), and Set 3 (16 vCPUs-32GB). Figure 3a shows the behavior of victim service response time for the requests sent by the benign sender. As soon as the attack starts the downtime of the service starts and the response times become very high (Table II). We changed the behavior of benign sender in such a manner that it waits for the longer responses to come without getting timed out. The response time behavior is having a large downtime and huge peaks in responses in Set 1. Set 2 with increased resources settles the downtime from a huge 2481s to 931s which is quite similar in the case of Set 3. However, one important factor to consider related to the attack mitigation performance is attack reporting time. Set 1 and Set 2 victim VM is not responsive for the whole downtime and the reporting of attack detection time is unknown.
We configured the DDoS mitigation service in such a manner that once the attackers are identified from the traffic the mitigation service notifies the attack detection in an attack log file. However, the huge resource usage during the attack did not allow the access to VM interface and the reporting time remains unknown till all the attack effects are not over. DDoS mitigation service achieved the attack reporting in the case of Set 3 resources. The behavior of other co-hosted services
(inside the same victim VM) as demonstrated by Figure 3b and various performance metrics in Table III.
0 200000 400000 600000 800000 1e+06 1.2e+06 1.4e+06 1.6e+06
0 500 1000 1500 2000 2500 3000
Response time (ms)
Request time(s)
4vCPU-8GB 8vCPU-16GB 16vCPU-32GB
(a) Web request-response
0.2 0.5 1 100 700
0 100 200 300 400 500
Response time (s)
Requests
4vCPU-8GB 8vCPU-16GB 16vCPU-32GB
(b) SSH request-response
0 200 400 600 800 1000
10 20 50 100 200 500 1500
No. of Connections
Time (s)
4vCPU-8GB 8vCPU-16GB 16vCPU-32GB
[image:6.612.327.536.252.626.2](c) Number of connections
Fig. 3: Attack effects with varied resources
The SSH service though not the real direct target of the DDoS attack faces downtime and performance penalties in the later part of the web-service downtime. SSH service downtime and response time see a decremental trend from Set 1 to Set 3. Set 3 having highest resources (Four times the Set 1 resources) sees no downtime of the SSH service, though there are response times which are as high as thrice to the minimum response time. In Figure 3c we show the total number of 1
For Review Only
connections at the victim service end since the start of the attack. Number of connections remains around 500-600 for all the three sets. However, for the Set 1 and the Set 2, the number of connections are unknown as the victim VM became non-responsive and values were not retrieved after 40s-50s.
Set 3 stays at∼500 connections for most of the duration and
then a step-wise decrease is observed till all the attack effects are over. We made the following observations during attack experiments.
1. Resource Contention during attack:Non-responsive VM,
unknown attack detection time, unknown number of connec-tions and huge peaks in SSH request-response cycles are the number of observations which are the result of a heavy resource contention formed by the DDoS attack. In addition to just service denial during the downtime, all these effects transforms these attacks in “extreme DDoS” attacks. Resource contentions occur due to heavy resource usage by victim service and no timely resource availability to other important processes at the operating system level. Resource contention and the absence of performance isolation are important issues while designing operating system and virtual machine moni-tors [27], [28], [29]. Resource contention should be minimized as this is an important effect of DDoS attacks and also a major contributor to the other three observations.
2. Downtime Post-attack Detection: Even though the attack
detection time is unknown in the cases of Set 1 and Set 2 due to the heavy resource contention, in Set 3 it is around 41s. Still in Set 3, the service downtime is 971s. After detecting the attack, the DDoS mitigation service with the help of the firewall drops all the incoming attack connections from identified attackers. In addition to this, the DDoS mitigation services tries to remove all the connections which are established by the attackers. Connection removal is achieved by reseting the
connections by utilities such as tcpkill. The removal of
these connections also take up a considerable amount of time due to heavy resource usage as all these connections are already having requests which are served by the victim service. In order to minimize the overall downtime, the post-attack detection downtime should also be minimized.
3. Number of Connections:In all the three set of experiments, we observe the stability of number of connections to 500-600, which is the major reason behind the high post-attack mitigation time. We also increased the environment variables such as maximum number of connections and port-ranges, still the number of connections remains stable. Number of connections decide the overall attack surface on the victim and should be maximized to absorb the attack traffic as soon as it arrives.
4. Collateral Effects on Other Services: We see adverse
performance on SSH service in Figure 3b. SSH service is very light resource usage utility as compared to the co-hosted dynamic website. Still, the SSH request-response cycle is severely affected by the large resource contended downtime. We observe similar effects by non-responsive VM, unknown attack detection time, and unknown number of connections. Reduction in the contention may also solve the collateral damages. We will use the above observations in preparing the requirements for the proposed approach.
IV. FORMALIZINGDEFENSEREQUIREMENTS
We formally define important requirements keeping the four important observations we made during the attack experiments in Section III. For this purpose, we first define a DDoS Attack mitigation activity as a three stage process (also shown in Figure 4).
Stage 1
Stage 2
Stage 3
Attack Absorption
Attack Identification and Mitigation
Post-attack-detection time to Recovery
Fig. 4: Three Stages of DDoS Attack Mitigation
Stage 1. Attack Absorption: In absorption, the mitigation
method tries to absorb the traffic as soon as it arrives on the network interface. Traffic input comes through the network connections and absorption gets affected if the victim service is not able to create quick connections.
Stage 2. Attack Identification and Mitigation: Attack
absorption is an online activity which always runs to ensure the timely traffic assessment and threat analytics. Attack identification and mitigation (blocking and dropping the attack connections) are completely causally dependent on the attack absorption. Resource availability to DDoS mitigation service and other critical services must be ensured to have resource contention free attack mitigation. Each incoming request is the contributor to the resource usage, and a huge number of requests during the DDoS attack forms the contention.
Stage 3. Post-Attack Detection to Recovery:Quick service
recovery is dependent on the timely attack absorption and mitigation. Quick removal of established attack connections is the key to minimize the time required to achieve service availability post-attack detection.
The performance of the attack absorption stage is completely dependent on the attack absorption delay. Attack absorption
delay (Tabsor b), which is the difference between the time at
which the traffic flow reaches the victim interface (Tinter f ace)
to the time when it is actually within the reach of the DDoS mitigation service (TD M S). We define attack absorption delay
with the help of the following equation.
Tabsor b=TD M S−Tinter f ace. (1)
Victim VMs are provided certain basic resources such as vCPUs (C), memory (M), disk (D) and the bandwidth (B). We define the resource allocation to a VM as its capacity.
Resources(Vi)=<Ci,Mi,Di,Bi > . (2)
The actual capacity of a victim server running inside the VM is usually represented by the total number of simultaneous requests it can serve at the same time. The number of requests
(r) which the service will be able to serve depends upon the
resource requirements of each request. We define the resource 1
For Review Only
requirements of each request,r, with the help of the resource
utilization factor,S(r), which is the total resource requirements
to complete a requestr. Processing a request requires access
to few or all of the basic resources.
Sr =<Cr,Mr,Dr,Br > . (3)
We define the capacity of the victim VM by the following
equation where the VM,Vi is able to serve N requests.
Capacity(Vi)=N∗S(r). (4)
We assume that the victim service has a defined set of require-ments for achieving a minimum quality of service (QoS) in order to have timely and correct output. The maximum number
of requests (Nmax) which can be served by the victim service
with the required QoS, are given by
Nmax=
Capacity(Vi)
Sr
. (5)
In order to extend the notion of resources, we also utilize
the maximum number of connections (Cmax) as an important
resource of the victim service. We assume that we can only
maximize the Nmax value if we are able to establish as
many connections (maximizingCmax) as possible. It is evident
from Equation 5 that if we want to maximize the number of
maximum requests (Nmax) which can be served by the victim
service, we need to either increase theCapacity(Vi)or reduce
the Sr. Following are the ways/requirements of a mitigation
method by which the attack absorption can be expedited: R1. Tabsor b Reduction: During an attack, the number of
connection requests coming to the victim service are huge. The time at which the traffic reaches the interface and transforms in the form of established connections is an important delay
which is actually the Tabsor b (attack absorption delay). For
the cases where the mitigation methods filter more fine grain features, the attack absorption delay may be extended to serving the initial requests (index page) and then allowing the additional requests to enter the service. These requests might be waiting to enter the service queue or they may be even
retransmissions. The delay Tabsor b can be minimized if the
connection life-cycle and the delay in providing the incoming traffic features to the DDoS mitigation service can be reduced. R2.Sr Reduction:Resource utilization factorSr comprises of
multiple activities at the service end for each incoming request.
As per Equation 5, reduction in Sr will lead to increase in
Nmax and reduction in Tabsor b. Additionally, reduction inSr
may also lead to minimizing of the resource contention effects as all the three stages of mitigation process run in parallel to each other and resource contention shows adverse effects
on the parallel activities. Reducing Sr is not straightforward
as it denotes the resource usage of each incoming request processing and responding with a suitable request outcome. R3. Capacity(Vi) Scaling: The auto-scaling capabilities of
cloud computing facilitate dynamic resource scaling, on the go, without any noticeable downtime in VM stop-resume. Capacity scaling can be achieved with the help of vertical or horizontal resource scaling as described in [30][31]. As described earlier the resource scaling comes with an additional cost. By increasingCapacity(Vi), it is assumed that the attack
Connection Request Read Request Process Request
Send Response Connection Close CPU Usage Memory Usage
Disk Usage Bandwidth Usage Prepare Response
Connection Request Read Request
[image:8.612.341.532.55.191.2]Send Response Connection Close
Fig. 5: Scale Inside-out the Resource Utilization Factor
absorption will be quick and the Tabsor b will be minimized
by increasing theNmax (in turnCmax). In next Section V, we
detail our approach by addressing these three requirements.
V. OURPROPOSAL: THESCALEINSIDE-OUTAPPROACH
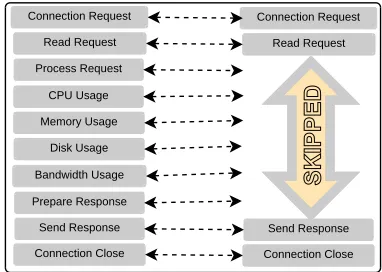
We now address the attack mitigation requirements detailed in Section IV by describing the novel solution elements incorporated in the proposed approach. The main contributions of our work lies in providing quick attack mitigation by combating the four important attack observations made in the attack experiments in Section III. We address the problem of reduction in attack absorption delay,Tabsor b, by reducing the
resource utilization factor Sr. In the client server
architec-ture of web-service such as the one which we used in our experiments, there are number of activities related to each request. Receiving a connection request, reading the request, processing the request, preparing a reply, sending a response, and closing the connection are few essential activities which a server end normally performs during a request-response cycle. Processing a request requires utilizing various resources such as CPU, memory, disk and the bandwidth. We show all these activities as part of the resource utilization factor in Figure 5. DDoS attacks being a onslaught having a huge number of such requests will create a heavy resource usage adding individual resource utilization factor of each request which consequently forms the resource contention problem for all the basic resources such as CPU and memory. Though DDoS mitigation service in our experiments is a very low resource usage based service, still, the resource contention severely affects the overall attack mitigation process. Additionally, we saw in the attack experiments in Section III, scaling of victim service resources to four times also does not solve the problem of attack downtime, specially the post-attack mitigation downtime. Meeting requirement R3 alone does not solve the local operating system level resource contention completely and comes with an additional cost.
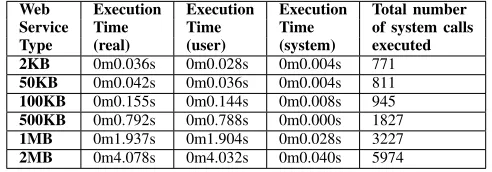
We calculated the cost of various web services in the form of an estimate of their resource utilization factor and summarized in Table IV. We show the amount of time taken and the total number of system calls executed by the victim web service using different image sizes. We can see that the utilization of various resources is reflected in the time taken to perform the request and it increases with the size of the image. We use this fact in our novel approach “Scale Inside-out”, where in 1
For Review Only
Algorithm 1:Scale Inside Out Algorithm SCALE-INSIDE-OUT;
Data: Response time =Tr es ponse,
Request timeout =Ttimeout,
Cnow= No. of connections,
Catt ack = Minimum connections during an attack,
Satt ack = Resource Utilization Factor during attack,
Sr = Resource Utilization Factor without an attack,
V = Victim service;
Result: Attack Mitigated Start;
while (Tr es ponse <Ttimeout &&Cnow <=Cmax)do
Nothing end
ScaleInsideOut(V,Satt ack);
while (Tr es ponse >=Ttimeout &&(Cnow >=Cmax)do
Nothing; end
ScaleInsideOut(V,Sr);
Show “Attack Mitigated”; end
Algorithm 2:Function ScaleInsideOut() ScaleInsideOut();
Data: Web serviceW
Resource utilization factor =U,
Result: Updated Resource Utilization Factor initialization;
Apply Uto web service W;
end
addition to capacity scaling, we argue to perform an internal application scaling to reduce the resource utilization factor during a DDoS attack. We term our approach as “Scale
Inside-out” as it reduces the request processing (by reducing Sr) to
increase Nmax and Cmax which in turn minimizes, Tabsor b.
To achieve this goal, we skip all the activities between “read request” and “send response” as shown in Figure 5. By doing the reduction inSr, only during the attack period, we argue that
the resource contention and all the subsequent problems like attack absorption delay, post-attack mitigation downtime, and collateral damages are resolved. We show the working of this approach using algorithms 1 and 2. We test the applicability of our method by a quick and dirty check in which we keep checking response time of the service and the total number of connections available on the victim service.
To demonstrate the applicability, we use thresholdsTtimeout
andCatt ack which best describes the attack situation by having
a timeout value and the minimum number of connections during an attack. Whenever the response time becomes higher than the acceptable response time and the number of connec-tions (Cnow) become more than or equal toCatt ack, the “Scale
Inside-out” approach changes the resource utilization factor
of the victim web-service from Sr to Satt ack. We observe
the resource utilization factor changing back to its original value once the service is restored back. The major motivation
Web Execution Execution Execution Total number
Service Time Time Time of system calls
Type (real) (user) (system) executed
2KB 0m0.036s 0m0.028s 0m0.004s 771
50KB 0m0.042s 0m0.036s 0m0.004s 811
100KB 0m0.155s 0m0.144s 0m0.008s 945
500KB 0m0.792s 0m0.788s 0m0.000s 1827
1MB 0m1.937s 0m1.904s 0m0.028s 3227
[image:9.612.313.559.52.138.2]2MB 0m4.078s 0m4.032s 0m0.040s 5974
TABLE IV: Resource Utilization Factor of different services
behind “Scale Inside-out” approach is that during the attack downtime, it is fine to sacrifice the victim service resources to expedite all the three stages of attack mitigation if the mitigation method minimized the downtime and other effects. “Scale Inside-out” works as a supporting resource framework which tries to minimize the attack downtime, minimize the effects on the legitimate users with an aim of working with any kind of DDoS mitigation service.
VI. EXPERIMENTALEVALUATION ANDDISCUSSION
In order to analyze the efficacy of the “Scale Inside-out” (SIO) approach, we perform exhaustive real time attack experiments. We use various image sizes (2KB, 50KB, 100KB, 500KB, 1MB, and 2MB) and resources (Set 1, Set 2, and Set 3) and apply the “Scale Inside-out” approach to evaluate various metrics such as attack detection time, attack reporting time, service downtime, and post-attack detection time. Sim-ilarly, we collect various metrics for other critical services to observe the resource contention and collateral damages. The major motivation of using three sets of resources is to show the effects of capacity scaling on the mitigation performance. The experimental settings are similar to what we see in Table I and Figure 2 in Section III.
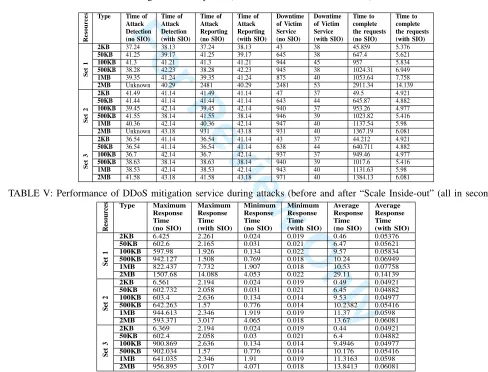
We show the detailed results on effects of “Scale Inside-out” on victim web service performance in Table V and Table VI. We will first describe the patterns in the results related to the victim service performance with the help of Figure 6. Figure 6a shows the response time behavior to the benign user while we do not employ the proposed approach for Set 1 resources. In this case, we observe that the attack detection time (‘D’ as shown after the vertical arrow on the graph) is not known till the attack effects are completely over. Attack reporting time (‘R’) and attack detection time (‘D’) are only observed after the victim service achieves the service availability state (‘A’). The heavy resource contention also resulted in the unavailability of VM interface as well as longer peaks in the response time behavior. On the other hand after applying the “Scale Inside-out” approach to help the attack mitigation expedition, the web service response is similar to the Figure 6b.
The three important metrics, the attack detection time (D), the attack reporting time (R) and the service availability (A), are heavily reduced to around 40s. Additionally, the post-attack detection time, reduces to nearly 0s, which is quite high in the cases where we do not employ the “Scale Inside-out” approach. After the reduction of the resource utilization factor fromSr toSatt ack, all the benign requests are given a response
which is not useful for them. Therefore, the response time behavior as shown in the Table VI shows a huge reduction 1
For Review Only
0 200000 400000 600000 800000 1e+06 1.2e+06 1.4e+06 1.6e+06
0 500 1000 1500 2000 2500 3000 3500
Response time (ms)
Request time (s)
D (Unknown)
R
A
4vCPU-8GB
(a) Web request response (before Scale Inside Out)
0 2000 4000 6000 8000 10000 12000 14000
0 10 20 30 40 50
Response time (ms)
Request time (s)
D
R
A
4vCPU-8GB
[image:10.612.56.539.60.189.2](b) Web request response (after Scale Inside Out)
Fig. 6: Web response (before and after Scale Inside Out)
Resour
ces Type Time of Time of Time of Time of Downtime Downtime Time to Time to
Attack Attack Attack Attack of Victim of Victim complete complete Detection Detection Reporting Reporting Service Service the requests the requests (no SIO) (with SIO) (no SIO) (with SIO) (no SIO) (with SIO) (no SIO) (with SIO)
Set
1
2KB 37.24 38.13 37.24 38.13 43 38 45.859 5.376
50KB 41.25 39.17 41.25 39.17 645 38 647.4 5.621
100KB 41.3 41.21 41.3 41.21 944 45 957 5.834
500KB 38.28 42.23 38.28 42.23 945 38 1024.31 6.949
1MB 39.35 41.24 39.35 41.24 875 40 1053.64 7.758
2MB Unknown 40.29 2481 40.29 2481 53 2911.34 14.139
Set
2
2KB 41.49 41.14 41.49 41.14 47 37 49.5 4.921
50KB 41.44 41.14 41.44 41.14 643 44 645.87 4.882
100KB 39.45 42.14 39.45 42.14 940 37 953.26 4.977
500KB 41.55 38.14 41.55 38.14 946 39 1023.82 5.416
1MB 40.36 42.14 40.36 42.14 947 40 1137.54 5.98
2MB Unknown 43.18 931 43.18 931 40 1367.19 6.081
Set
3
2KB 36.54 41.14 36.54 41.14 43 37 44.212 4.921
50KB 36.54 41.14 36.54 41.14 638 44 640.711 4.882
100KB 36.7 42.14 36.7 42.14 937 37 949.46 4.977
500KB 38.63 38.14 38.63 38.14 940 39 1017.6 5.416
1MB 38.53 42.14 38.53 42.14 943 40 1131.63 5.98
2MB 41.58 43.18 41.58 43.18 971 40 1384.13 6.081
TABLE V: Performance of DDoS mitigation service during attacks (before and after “Scale Inside-out” (all in seconds))
Resour
ces Type Maximum Maximum Minimum Minimum Average Average
Response Response Response Response Response Response
Time Time Time Time Time Time
(no SIO) (with SIO) (no SIO) (with SIO) (no SIO) (with SIO)
Set
1
2KB 6.425 2.261 0.024 0.019 0.46 0.05376
50KB 602.6 2.165 0.031 0.021 6.47 0.05621
100KB 597.98 1.926 0.134 0.022 9.57 0.05834
500KB 942.127 1.508 0.769 0.018 10.24 0.06949
1MB 822.437 7.732 1.907 0.018 10.53 0.07758
2MB 1507.68 14.088 4.053 0.022 29.11 0.14139
Set
2
2KB 6.561 2.194 0.024 0.019 0.49 0.04921
50KB 602.732 2.058 0.031 0.021 6.45 0.04882
100KB 603.4 2.636 0.134 0.014 9.53 0.04977
500KB 642.263 1.57 0.776 0.014 10.2382 0.05416
1MB 944.613 2.346 1.919 0.019 11.37 0.0598
2MB 593.371 3.017 4.065 0.018 13.67 0.06081
Set
3
2KB 6.369 2.194 0.024 0.019 0.44 0.04921
50KB 602.4 2.058 0.03 0.021 6.4 0.04882
100KB 900.869 2.636 0.134 0.014 9.4946 0.04977
500KB 902.034 1.57 0.776 0.014 10.176 0.05416
1MB 641.035 2.346 1.91 0.019 11.3163 0.0598
2MB 956.895 3.017 4.071 0.018 13.8413 0.06081
TABLE VI: Performance of DDoS mitigation service during attacks (before and after “Scale Inside-out” (all in seconds))
in various metrics. However, the reduction in Sr helps in
achieving a huge reduction in the service downtime. Except the 2KB service, which has the leastSr, all the other services have
a service downtime ranging between∼600s-2400s. Another
important observation regarding the service downtime in the cases when “Scale Inside-out” is used, is related to the
achieved stability in the service downtime to∼40s. Coming
to the impact of “Scale Inside-out” on the attack absorption, we show the results in the form of various graphs in Figure 7. With a huge reduction in the resource utilization factor fromSr
toSatt ack, the number of connectionsNmaxreaches to a value
as high as∼50000 connections to absorb the attack as soon as
possible. Victim web services where the Sr is already very
low (2KB-100KB) show number of established connections
ranging between∼2000-20000 while we do not use “Scale
Inside-out”. However, after employing our approach, the rise in number of connections also helps in achieving important goals of reducing the overall downtime and other related effects. We show the effects of our proposed approach on the collateral damages to other critical services in Table VII. For better 1
[image:10.612.50.538.217.589.2]For Review Only
0 10000 20000 30000 40000 5000010 20 50 100 200 500 1500
No. of Connections
Time (s)
4vCPU-8GB 8vCPU-16GB 16vCPU-32GB
(a) 2KB Service (No Scale Inside-Out)
0 10000 20000 30000 40000 50000
10 20 50 100 200 500 1500
No. of Connections
Time (s)
4vCPU-8GB 8vCPU-16GB 16vCPU-32GB
(b) 50KB Service (No Scale Inside-Out)
0 10000 20000 30000 40000 50000
10 20 50 100 200 500 1500
No. of Connections
Time (s)
4vCPU-8GB 8vCPU-16GB 16vCPU-32GB
(c) 100KB Service (No Scale Inside-Out)
0 10000 20000 30000 40000 50000
10 20 50 100 200 500 1500
No. of Connections
Time (s)
4vCPU-8GB 8vCPU-16GB 16vCPU-32GB
(d) 2KB Service (Scale Inside-Out)
0 10000 20000 30000 40000 50000
10 20 50 100 200 500 1500
No. of Connections
Time (s)
4vCPU-8GB 8vCPU-16GB 16vCPU-32GB
(e) 50KB Service (Scale Inside-Out)
0 10000 20000 30000 40000 50000
10 20 50 100 200 500 1500
No. of Connections
Time (s)
4vCPU-8GB 8vCPU-16GB 16vCPU-32GB
(f) 100KB Service (Scale Inside-Out)
0 200 400 600 800 1000
10 20 50 100 200 500 1500
No. of Connections
Time (s)
4vCPU-8GB 8vCPU-16GB 16vCPU-32GB
(g) 500KB Service (No Scale Inside-Out)
0 200 400 600 800 1000
10 20 50 100 200 500 1500
No. of Connections
Time (s)
4vCPU-8GB 8vCPU-16GB 16vCPU-32GB
(h) 1MB Service (No Scale Inside-Out)
0 200 400 600 800 1000
10 20 50 100 200 500 1500
No. of Connections
Time (s)
4vCPU-8GB 8vCPU-16GB 16vCPU-32GB
(i) 2MB Service (No Scale Inside-Out)
0 10000 20000 30000 40000 50000
10 20 50 100 200 500 1500
No. of Connections
Time (s)
4vCPU-8GB 8vCPU-16GB 16vCPU-32GB
(j) 500KB Service (Scale Inside-Out)
0 10000 20000 30000 40000 50000
10 20 50 100 200 500 1500
No. of Connections
Time (s)
4vCPU-8GB 8vCPU-16GB 16vCPU-32GB
(k) 1MB Service (Scale Inside-Out)
0 10000 20000 30000 40000 50000
10 20 50 100 200 500 1500
No. of Connections
Time (s)
4vCPU-8GB 8vCPU-16GB 16vCPU-32GB
(l) 2MB Service (Scale Inside-Out)
Fig. 7: No. of connections during attack (before and after Scale Inside Out)
comprehension, we show the performance of SSH test in the form of SSH response times by various graphs in Figure 8. Proposed approach removes the the collateral effects which were formed by the victim service on SSH service. The huge peaks in the response times, specially in the cases of web
services with a higher Sr are reduced to acceptable values.
Additionally, it is also visible that the collateral effects on SSH service seems to disappear in case of Set 3 without employing the proposed approach. However, a close look on the maximum time taken in the request-response cycle in SSH is more than double in all the cases where we use the proposed approach.
These results also prove that the capacity scaling alone may not solve all the collateral effects as the resource contention highly depends upon the application type and its resource
utilization factor Sr. Therefore, even the Set 3 resources may
become resource contended for heavier services or attacks. However, “Scale Inside-out” always shows the stable results for various metrics for critical co-located services. In addition to all these metrics, we also show an additional metric which is quite important to understand the attack absorption dynamics.
We show the number of attack requests served by the victim service under attack, before the attack is actually detected in Table VIII. This metric is important from two perspectives, first, the cost of outgoing bandwidth spend on responding to these attack requests will be huge if the attack is not detected in time. Second important aspect is the severity of resource contention will be higher in the victim service keeps serving the attack requests without the mitigation service actually identifying them timely. The attack requests served before detection, are heavily reduced in the cases when the “Scale
Inside-out” is used. In the case of higher Sr the number of
attack requests served before detection remains similar before and after “Scale Inside-out”. This is due to the minimum time required to complete the quick and dirty check by the proposed approach. On the other hand, the capacity scaling (Set 2 and Set 3) shows negative impact here as the scaled resources serves more and more requests before getting a detection trigger. After discussing the detailed results of the evaluative experiments, we will now discuss various aspects of the proposed approach. Following are various important usage aspects related to the “Scale Inside-out” approach.
For Review Only
Resour
ces Type ssh ssh Time to Time to Max. Max. Min. Min. Average Average
down down complete complete ssh ssh ssh ssh ssh ssh time time ssh test ssh test Time Time Time Time Time Time (no SIO) (SIO) (no SIO) (SIO) (no SIO) (SIO) (no SIO) (SIO) (no SIO) (SIO)
Set
1
2KB 0 0 81.616 77.846 0.341 0.231 0.144 0.144 0.163 0.155692
50KB 0 0 82.016 81.045 0.332 0.283 0.145 0.146 0.164 0.16209
100KB 0 0 85.139 80.685 0.374 0.316 0.145 0.146 0.17 0.16137
500KB 0 0 84.779 81.127 0.409 0.489 0.146 0.146 0.169 0.162254
1MB 445.75 0 549.26 80.722 120.07 0.321 0.145 0.146 1.09853 0.161444
2MB 2269 0 2373.15 81.928 706.4 0.346 0.15 0.146 4.7463 0.163856
Set
2
2KB 0 0 84.54 78.389 0.458 0.223 0.148 0.147 0.169 0.156778
50KB 0 0 84.48 78.308 0.566 0.218 0.146 0.147 0.168 0.156616
100KB 0 0 83.622 78.347 0.441 0.331 0.145 0.146 0.167244 0.156694
500KB 0 0 84.262 78.977 0.474 0.47 0.146 0.146 0.168 0.157954
1MB 0 0 83.536 78.581 0.431 0.334 0.145 0.147 0.167072 0.157162
2MB 864.2 0 940.657 77.219 254.88 0.489 0.147 0.146 1.88131 0.154438
Set
3
2KB 0 0 81.1 78.389 0.419 0.223 0.145 0.147 0.162 0.156778
50KB 0 0 82.221 78.308 0.476 0.218 0.145 0.147 0.164442 0.156616
100KB 0 0 83.196 78.347 0.491 0.331 0.147 0.146 0.166392 0.156694
500KB 0 0 83.394 78.977 0.506 0.47 0.147 0.146 0.166788 0.157954
1MB 0 0 83.191 78.581 0.501 0.334 0.144 0.147 0.166382 0.157162
2MB 0 0 83.309 77.219 0.475 0.489 0.145 0.146 0.166618 0.154438
TABLE VII: SSH request-response behavior during attack (before and after “Scale Inside-out” (all in seconds))
Resources 2KB 50KBType of the Victim Service100KB 500KB 1MB 2MB
Set 1 (No SIO) 5581 4115 794 30 6 4
Set 1 (SIO) 323 179 44 13 13 8
Set 2 (No SIO) 10820 6916 1542 198 24 20
Set 2 (SIO) 515 313 109 58 13 8
Set 3 (No SIO) 18825 12778 2920 487 170 20
Set 3 (SIO) 793 415 80 19 13 12
TABLE VIII: Number of Attack Requests Served Before Attack Detection
1. Attack Downtime:Many of the recent DDoS attacks show
the attack downtime ranging between few days to weeks and the unavailability causes enormous losses [32]. During the downtime, the legitimate customers will not get served, hence, we utilize the idea of sacrificing the victim service resources and make the resources available for the DDoS mitigation service and other critical services.
2. Variable Sr: The real web services do not have a fixed
resource utilization factor for all the requests (except in the
cases of static services). We change the Sr to Satt ack in all
the cases, however, variable Sr values for different resource
users/dependent services may be used to ensure a minimum availability during the downtime.
3. Effects on other DDoS mitigation methods:The proposed
approach is independent of the DDoS mitigation method used as it aims at providing resources to the mitigation service. For most of the DDoS mitigation methods which work at the network or the application level, proposed approach will be helpful as it is able to absorb the attack data timely. However, application layer filtering approach which are based on more fine-grain user inputs may require additional support.
4. Attack Absorption: Our major aim and contribution in
this work is to expedite the attack absorption with minimizing
the attack absorption delay (Tabsor b). Methods requiring
additional data in mitigation may require other mechanisms. 5. Attackers are not interested in response: One important argument in support of the reduction inSr, is that the attackers
being mostly bots do not have any interest in the service
response. However the responses with reduced Sr may trigger
the bots to automatically increase/change the attack vectors (guessing that the service is not down yet). This instigation may also help the mitigation method to get the upcoming
attacks quickly for quick detection. 6. Legitimate users:
At first instance it may appear that the service is giving
unusable responses to the benign users. However, due to a heavy reduction in downtime, the legitimate users are served right after the attack detection.
7. Repeated/stealthy/sophisticated attacks: As discussed
in point number 5, the attacks which are undetectable or requires additional efforts (at times manual efforts) should show reduced effects if the proposed approach is used as the
Sattack will be minimum during the downtime. If the attacks
are repeated during the downtime, the detection will be quick as the service is already usingSatt ack.
8. Sacrifice vs losses:In order to achieve the loss minimization and quick availability, we are applying a forceful downtime using “Scale Inside-out”. The sacrifice of service resources by
reducing the Sr results in minimizing the losses, which are
quite higher as compared to the losses due to this reduction. 9. Costs:Capacity scaling comes up with the additional cost and in case of repeated/stealthy/sophisticated attacks it may become quite high which may even question the sustainability of the victim organization [33][22]. However, “Scale Inside-out” approach also works well without the scaling methods.
10. “Scale Inside-out” vs. Shutdown: Proposed approach
may look like victim service/machine shutdown, as in the case of shutdown the victim service administrator anticipates that the attack will go away soon. However, without shutting the service, we collect all the attack data and use the resources to detect and mitigate the attack as quickly as possible. Additional advantages as compared to the shutdown are as listed in other points from 1 to 9.
VII. RELATEDWORK
Cyber threats such as DDoS attacks remains a major re-search area for the cyber security community. However, the challenges posed by newer forms of DDoS attacks and their variants bringing sophistication, require new and effective 1
For Review Only
0.2 0.3 0.4 0.5 1
0 100 200 300 400 500
Response time (s)
Requests
4vCPU-8GB 8vCPU-16GB 16vCPU-32GB
(a) 2KB Service (No Scale Inside-Out)
0.2 0.3 0.4 0.5 1
0 100 200 300 400 500
Response time (s)
Requests
4vCPU-8GB 8vCPU-16GB 16vCPU-32GB
(b) 50KB Service (No Scale Inside-Out)
0.2 0.3 0.4 0.5 1
0 100 200 300 400 500
Response time (s)
Requests
4vCPU-8GB 8vCPU-16GB 16vCPU-32GB
(c) 100KB Service (No Scale Inside-Out)
0.2 0.3 0.4 0.5 1
0 100 200 300 400 500
Response time (s)
Requests
4vCPU-8GB 8vCPU-16GB 16vCPU-32GB
(d) 2KB Service (Scale Inside-Out)
0.2 0.3 0.4 0.5 1
0 100 200 300 400 500
Response time (s)
Requests
4vCPU-8GB 8vCPU-16GB 16vCPU-32GB
(e) 50KB Service (Scale Inside-Out)
0.2 0.3 0.4 0.5 1
0 100 200 300 400 500
Response time (s)
Requests
4vCPU-8GB 8vCPU-16GB 16vCPU-32GB
(f) 100KB Service (Scale Inside-Out)
0.2 0.3 0.4 0.5 1
0 100 200 300 400 500
Response time (s)
Requests
4vCPU-8GB 8vCPU-16GB 16vCPU-32GB
(g) 500KB Service (No Scale Inside-Out)
0.2 0.5 1 100 700
0 100 200 300 400 500
Response time (s)
Requests
4vCPU-8GB 8vCPU-16GB 16vCPU-32GB
(h) 1MB Service (No Scale Inside-Out)
0.2 0.5 1 100 700
0 100 200 300 400 500
Response time (s)
Requests
4vCPU-8GB 8vCPU-16GB 16vCPU-32GB
(i) 2MB Service (No Scale Inside-Out)
0.2 0.3 0.4 0.5 1
0 100 200 300 400 500
Response time (s)
Requests
4vCPU-8GB 8vCPU-16GB 16vCPU-32GB
(j) 500KB Service (Scale Inside-Out)
0.2 0.5 1 100 700
0 100 200 300 400 500
Response time (s)
Requests
4vCPU-8GB 8vCPU-16GB 16vCPU-32GB
(k) 1MB Service (Scale Inside-Out)
0.2 0.51 100 700
0 100 200 300 400 500
Response time (s)
Requests
4vCPU-8GB 8vCPU-16GB 16vCPU-32GB
(l) 2MB Service (Scale Inside-Out)
Fig. 8: SSH request-response behavior during attack (before and after Scale Inside Out)
solutions. DDoS attack models and defense methods are clas-sified in the detailed surveys such as [34]. Authors in [15] gave a detailed solution taxonomy related to DDoS attack solutions for cloud computing. DDoS attacks in cloud computing and the security assurance and protection are given in contribu-tions such as [35] and [36]. Taxonomies and surveys such as [37] [38] provide mitigation solutions related to emerging DDoS attacks in the area of cloud computing with a special emphasis on software defined networks (SDN). Similarly, attack solutions in cloud computing are also complemented by the paradigms such as big data analytics based detection in [39]. Many authors also studied the novel characterization of DDoS attacks and its variants on cloud computing and advocated about the need of solutions specifically designed for the on-demand computing model of cloud. Authors in [40] show DDoS attacks on cloud data centers and observe impacts beyond the downtime of the service. Authors showed effects of attacks which may even result in switching off the victim servers and permanent hardware damages. Authors in [41] show newer DDoS attacks which result in power spikes in the data center power utilization resulting in power
over-subscription by attack workloads. Authors in [42] show a discussion on DDoS attacks which target the server bandwidth to achieve the service denial. Authors in [43] provide puzzle based solution to bandwidth based DDoS attacks. Authors pro-vide attack algorithms of novel stealthy DDoS attacks in cloud computing in contributions such as [44] [45]. These stealthy attacks try to remain undetected by intelligently defeating the attack filters.
There are two important features which differentiate a cloud based victim service from a fixed infrastructure server. These features are on-demand “Pay-as-you-Go” model of cloud computing and multi-tenant nature of cloud infrastructure. Idziorek et. al [46] showed the DDoS attack variant in the form of fraudulent resource consumption (FRC). Economic denial of sustainability attack (EDoS) [47] is similar to the FRC attack where the attackers exploit the vulnerabilities of on-demand resource scaling capability of victim cloud services. Authors in [48] [47] present solutions which are based on challenge response protocol such as CAPTCHAs to prevent the exploitation of “Pay-as-you-Go” model. Authors in [46][49] present traffic anomaly detection solution based 1
For Review Only
on the session duration and the “Zipf” distribution. The multi-tenant nature of cloud computing results into a new venue of security threats among co-located VMs. Authors in [50] show security threats among VMs hosted on the same physical server. Similarly solutions such as [51] show resource con-tention among co-located VMs at the level of I/O operations and [52] show resource contention in network bandwidth resources. Performance interference and resource contention is a well studied aspect of virtualization technology and there are number of characterization studies such as [28] [27]. Recent DDoS characterization studies [22] extends the VM resource contention to the DDoS attacks and show collateral damages of DDoS attack effects on co-hosted VMs and overall cloud resources including energy consumption effects. Similarly, authors in [53] show effects of DDoS attacks on virtual machines. Since the inception of cloud computing, there were anticipations that the profound amount of resources available in the cloud infrastructure will help in immediately curbing the attack by resource scaling at victim end. There are industry solutions such as [17][16][54] which aims at minimizing the attack surface and expediting the attack absorption by resource capabilities of cloud computing to be used during an attack. Solutions such as[2] [55] [56] [57] provide methods which scale the victim server resources in attack cases till the service becomes normal. On the other hand, authors in [33] have proposed a DDoS aware resource scaling algorithm which only scale the resource if there is a presence of an attack. Authors in [58] propose a moving target based mitigation mechanism in which the hidden servers and ports are assigned to the users on the go to create another interface between the real servers and users. On the other hand, authors in [59] propose to migrate the victim server under attack to reserved resources in anticipation that the attack will be over soon.
Most of the DDoS attack solutions in the cloud contributed towards resource scaling methods and other contributions show resource contention among VMs on the same physical server. Our proposed work shows a novel characterization where the local resource contention among the operating system level services (at the level of single victim VM) gets formed due to the attack. We also show that the attack absorption being the most important phase of attack mitigation may be delayed due to these effects where capacity scaling may not help. As per the related work, we believe that our proposed solution provides a novel solution based on the reduction in resource utilization factor per request during the attack.
VIII. CONCLUSION
In this work, we show that during massive and extreme DDoS attacks, the victim service resources are stressed heav-ily. The legitimate traffic coming to the victim services does not get serviced during the downtime due to these attacks. In addition to these effects collateral damages due to the heavy resource contention delays the overall mitigation process. The traffic flow in these attack cases is really huge which cannot be timely absorbed by the victim machine with the available resources. Most of the DDoS solutions use the dynamic scaling capabilities of cloud computing to scale service instances to
absorb the attack quickly. The resource scaling capabilities provided by profound and on-demand resources provide a great help in mitigating the attacks quickly and restoring the services back. Resource scaling allows quick collection of at-tack data and features to expedite the atat-tack detection and mit-igation, however, it brings additional cost to the overall attack mitigation. In addition to dynamic scaling of resources, we argue that a reorganization and in-resource scaling of critical bottleneck resources may fasten the overall mitigation process further. Most of the DDoS mitigation tools/frameworks rely on the incoming traffic features such as traffic rate/connections to evaluate and segregate the traffic.
We show that the overall mitigation activity could be fas-tened if the attack absorption delay which is the time between the request arrival and request evaluation by the mitigation method can be minimized. To minimize the attack absorption delay, we propose to reduce the "Resource utilization" per request during an attack. To showcase the efficacy of our claims we also take the case of "number of connections" as a critical resource as it directly affects the overall time and efficiency of traffic data absorption during segregation process. To increase the number of connections, we propose to reconfigure the victim service to have a reduced resource utilization per request during the downtime. This essentially means that for each incoming request (during the attack), the server does not perform the requested activity which forms the resource contention. Additionally, this implementation fastens the incoming traffic arrival and evaluation as this reconfig-uration results into the establishment of a huge number of connections which helps in absorbing the attack as quickly as possible. We perform real time attack experiments on cloud services to showcase the efficacy of our scheme. We also believe that our proposed technique opens up a new direction of "in-resource" scaling by which the attack data collection leading to early attack mitigation can be achieved.
REFERENCES
[1] A. A. Cárdenas, P. K. Manadhata, and S. P. Rajan, “Big Data Analytics for Security,” IEEE Security and Privacy, vol. 11, no. 6, pp. 74–76, Nov. 2013.
[2] S. Yu, Y. Tian, S. Guo, and D. O. Wu, “Can we beat ddos attacks in clouds?” Parallel and Distributed Systems, IEEE Transactions on, vol. 25, no. 9, pp. 2245–2254, 2014.
[3] H. Chen, R. H. Chiang, and V. C. Storey, “Business Intelligence and Analytics: From Big Data to Big Impact,”MIS quarterly, vol. 36, no. 4, pp. 1165–1188, 2012.
[4] W. Hurst, M. Merabti, and P. Fergus, “Big Data Analysis Techniques for Cyber-threat Detection in Critical Infrastructures,” in Advanced Information Networking and Applications Workshops (WAINA), 2014 28th Int. Conf. on, May 2014, pp. 916–921.
[5] R. Bhatti, R. LaSalle, R. Bird, T. Grance, and E. Bertino, “Emerging trends around big data analytics and security: Panel,” inProc. of the 17th ACM Symp on Access Control Models and Technologies, ser. SACMAT. New York, NY, USA: ACM, 2012, pp. 67–68.
[6] Saroj Kar , “Gartner Report: Big Data will Revolutionize Cyber Security in the Next Two Years,” http://cloudtimes.org/2014/02/12/gartner-report-big-data-will-revolutionize-the-cybersecurity-in-next-two-year/, 2014. [7] Christy Pettey , “Security Embraces Advanced Analytics and
Ma-chine Learning,” http://www.gartner.com/smarterwithgartner/security-embraces-advanced-analytics-and-machine-learning/, 2016.
[8] CERT-UK, “An Introduction to Threat Intelligence,” https: //www.cert.gov.uk/wp-content/uploads/2015/03/An-introduction-to-threat-intelligence.pdf, 2015.
[9] Dave Shackleford, “SANS Security Analytics Survey,” https://www.sans. org/reading-room/whitepapers/analyst/security-analytics-survey-34980, 2013.