Rochester Institute of Technology
RIT Scholar Works
Theses Thesis/Dissertation Collections
5-15-2014
An Ecological Framework to Assess Sustainability
Impacts for an Evolving Consumer Electronic
Product System
Erinn G. Ryen
Follow this and additional works at:http://scholarworks.rit.edu/theses
This Dissertation is brought to you for free and open access by the Thesis/Dissertation Collections at RIT Scholar Works. It has been accepted for inclusion in Theses by an authorized administrator of RIT Scholar Works. For more information, please [email protected].
Recommended Citation
An Ecological Framework to Assess Sustainability Impacts for an Evolving Consumer Electronic Product System
By Erinn G. Ryen
A Dissertation Submitted in Partial Fulfillment of the Requirements for the Degree of
Doctorate of Philosophy in Sustainability
Department of Sustainability Golisano Institute for Sustainability
Rochester Institute of Technology Rochester, NY
May 15, 2014
Author: _________________________________________________________________
Golisano Institute for Sustainability
Certified by: _____________________________________________________________ Callie W. Babbitt, Ph.D. Assistant Professor, Golisano Institute for Sustainability
Approved by: ____________________________________________________________ Dennis A. Andrejko Interim Head, Department of Sustainability Program
NOTICE OF COPYRIGHT
© 2014
Erinn G. Ryen
REPRODUCTION PERMISSION STATEMENT
Permission Granted
An Ecological Framework to Assess Sustainability Impacts for an Evolving Consumer Electronic Product System
I, Erinn G. Ryen, hereby grant permission to the Wallace Library of the Rochester Institute of
Technology to reproduce my dissertation in whole or in part. Any reproduction will not be for commercial use or profit.
Signature of Author:
An Ecological Framework to Assess Sustainability Impacts for an Evolving Consumer Electronic Product System
By
Erinn G. Ryen
Submitted by Erinn G. Ryen in partial fulfillment of the requirements for the degree of Doctor of Philosophy in Sustainability and accepted on behalf of the Rochester Institute of Technology by the dissertation committee.
We, the undersigned members of the Faculty of the Rochester Institute of Technology, certify that we have advised and/or supervised the candidate on the work described in this dissertation. We further certify that we have reviewed the dissertation manuscript and approve it in partial fulfillment of the requirements of the degree of Doctor of Philosophy in Sustainability.
Approved by:
____________________________________
Callie W. Babbitt, Ph.D. Date:
Chairperson/Adviser, Golisano Institute for Sustainability
___________________________________
Dennis A. Andrejko Date:
Interim Head, Department of Sustainability Program
____________________________________
Dr. Nabil Nasr, Ph.D. Date:
Associate Provost and Director, Golisano Institute for Sustainability
____________________________________
Dr. Anna Christina Tyler, Ph.D. Date:
Committee Member, Thomas H. Gosnell School of Life Sciences
____________________________________
Gabrielle Gaustad, Ph.D. Date:
Committee Member, Golisano Institute for Sustainability
____________________________________
Eric Williams, Ph.D. Date:
Committee Member, Golisano Institute for Sustainability
___________________________________
Gregory Babbitt, Ph.D. Date:
ABSTRACT
Golisano Institute for Sustainability
Rochester Institute of Technology
Degree: Doctor of Philosophy
Name of Candidate: Erinn G. Ryen
Title: An Ecological Framework to Assess Sustainability Impacts for an Evolving Consumer Electronic Product System
Consumer electronics have revolutionized the manner in which we work, read, and
entertain ourselves. However, this transformation comes at a high cost, with significant
energy input and emissions releases across all stages of the electronic product life cycle. The
limited success of ‘per product’ efficiency improvements, often formulated in the field of
industrial ecology, does not address the electronic product system as a whole because
escalating consumption may actually offset any individual impact reductions. Additionally,
existing industrial ecology models fail to effectively capture energy, material, and waste
flows associated with real consumption patterns, as consumers purchase, use, and discard a
group of interrelated devices such as desktops, laptops, printers, mobile phones, and digital
cameras.
To address this challenge, this dissertation develops and applies novel industrial
ecology methodologies to more effectively characterize changes to rapidly evolving and
interrelated product systems. Notably, these approaches borrow heavily from underutilized
biological ecology concepts from community ecology and optimal foraging theory, but
adapted for use as applied to a complex product system like consumer electronics. These
approaches can lead to more effective design, production, green purchasing decisions, and
end of life practices and policies, while at the same time expand industrial ecology’s
traditional focus on the ecosystem metaphor and ‘per product’ approaches and strengthen its
connection to the source science: biological ecological roots.
Abstract Approval:
ACKNOWLEDGMENTS
I want to thank my committee members (Gabrielle Gaustad, Anna C. Tyler, and Eric
Williams for their invaluable guidance, feedback, and support. I want to thank Greg Babbitt,
who has provided me with ideas and valuable feedback on my work. I also want to gratefully
acknowledge students (Barbara Kasulaitis, Mona Komeijani, and Matt Koskinen) for their
assistance in preparing graphics and data collection, as well as my fellow GIS colleagues and
staff members for their support. To my advisor and mentor Callie Babbitt. I am particularly
appreciative for her ongoing support and guidance. Callie has pushed me ‘beyond the
ecosystem’ academically, emotionally, and physically. As a result of her guidance and my
studies at RIT, I will use innovative tools and a creative mindset to help businesses,
communities, and future leaders understand and characterize sustainability impacts, reduce
environmental footprints, and live well with less. I am appreciative that Callie has been my
side during this journey.
Finally, a special acknowledgement to my personal ‘community.’ My children
Hannah and Ethan, husband Matthew, parents, siblings, extended family, and close friends
who stood by me and gave me the encouragement and friendship (in addition to carpools,
meals, and childcare coverage) to help me finish this adventure.
This research was supported by the STAR Fellowship Assistance Agreement no. FP
-91736401-1 awarded by the U.S. Environmental Protection Agency (U.S. EPA). The U.S.
EPA has not formally reviewed the research. This research was also supported by the
Golisano Institute for Sustainability at Rochester Institute of Technology (RIT) and by the
TABLE OF CONTENTS
List of Figures ... vii
List of Tables ... viii
I. INTRODUCTION ...1
1.1. Background and Rationale ...1
1.2. Research Goals and Objectives ...4
II. ADAPTING ECOLOGICAL CONCEPTS ...6
III. ASSESSING COMMUNITY STRUCTURE AND FUNCTION ...11
3.1. Introduction ...11
3.2. Methodology ...12
3.3. Results and discussion ...21
3.3. Implications...33
IV. LINKING COMMUNITY STRUCTURE TO ECOSYSTEM-LEVEL ENERGY FLOWS ...34
4.1. Introduction ...34
4.2. Methodology ...36
3.3. Results and discussion ...57
3.3. Implications...67
V. EVALUATING FORAGING DECISIONS ...68
5.1. Introduction ...68
5.2. Methodology ...71
5.3. Results and discussion ...88
5.3. Implications...96
VI. CONCLUSIONS ...98
VII. APPENDIX ...101
List of Figures
Figure 1 Adoption of community ecology principles
to a the electronic product community ...8
Figure 2 Classification of functions ...18
Figure 3 Dynamic changes in species abundance (number of products per household) from 1990-2000 ...22
Figure 4 Ecological diversity metrics illustrate changes in the consumer electronic community structure from 1990-2010 ...23
Figure 5 Changes in community-level functionality ...24
Figure 6 Hypothetical consumption-weighted functional capacity ...25
Figure 7 Comparison of true and hypothetical functional capacity ...26
Figure 8 Trends in functional groups and emergent functional phases ...28
Figure 9 Comparison of minimal and hypothetical functional capacity ...30
Figure 10 Consumption-weighted LCA methodology and scope ...38
Figure 11 Temporal changes in IO sector energy (MJ) per constant U.S. dollar (2007) ...40
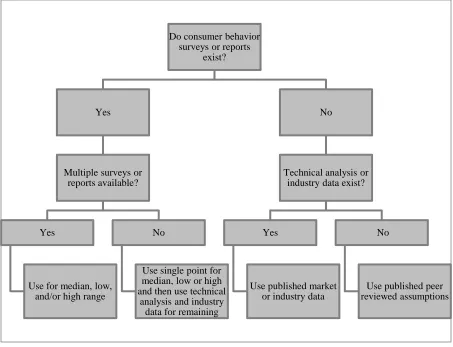
Figure 12 Decision tree diagram used to select the baseline lifespan for each product ...43
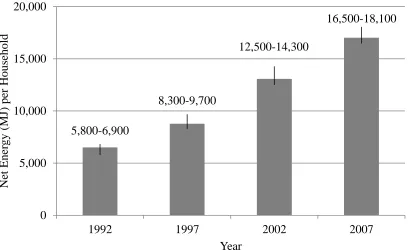
Figure 13 Dynamic changes in net annualized energy impact ...57
Figure 14 Partitioning the net annualized energy impact on a ‘per product’ (a) and consumption-weighted ‘per community’ (b) basis ...59
Figure 15 Comparison of net annualized energy impact on a consumption-weighted basis for the electronic product community using U.S.- and Asian-based manufacturing energy ...60
Figure 16 Comparison of baseline 2007 and resultant changes from conventional interventional strategies and future converging scenarios ...64
Figure 19 Detail of model parameters and decision variables ...79
Figure 20 Relationship between changes in net profit, number of components selected, and labor costs ...92
Figure 21 Comparing En/T and En in comparison to ranges of data points related to: a) material recovery efficiency rates, b) shredding costs, and c) disassembly times ...94
List of Tables Table 1 Adaption of community ecology concepts to a household electronics community...7
Table 2 Household consumer electronic products included in the analysis ...13
Table 3 Qualitative comparisons of general succession trends between natural and household electronics communities ...31
Table 4 Summary of average producer prices ...42
Table 5 Summary of lifespan data ...44
Table 6 Average annual unit energy consumption (UEC) (kWh/year) input values ...52
Table 7 Descriptions of green intervention strategies and devices included ...54
Table 8 Net Annualized energy impact (‘per community’) with U.S.- and China-based manufacturing energy ...61
Table 9 Percent savings from baseline net energy annualized impact for the green intervention strategies ...63
Table 10 Translation of ecological model parameters into e-waste equivalents ...75
Table 11 Disassembly revenue input variables ...81
Table 12 Cumulative disassembly time per component ...83
Table 13 Shredding revenue input variables ...85
Table 14 List of parameters used in models ...87
Table 15 Conventional profit maximization model outputs ...89
I. Introduction
1.1.Background and Rationale
The continual evolution and rapid adoption of consumer electronic devices has
changed the way people read books, watch movies, manipulate data, and snap pictures. In
1990, the average American household owned 10 electronic products, and its residents
watched television (TV) on cathode ray tube (CRT) TV screens, worked at desktop
computers and perused hardcopy books. Twenty years later, the average number devices per
household more than doubled to 24 (CEA 2008, 2010). Product innovations have
un-tethered people from outlets and cables, allowing them to read books on tablets and
e-readers, view or stream movies and TV programming on liquid crystal display (LCD) and
plasma TV screens, and talk, play games, browse the web, and snap photographs on
smartphones. Technological advances have contributed to increased productivity, economic
growth, and more efficient use of resources (Berkhout and Hertin 2004; Weber et al. 2010;
Masanet and Matthews 2010; Koomey et al. 2011).
Unfortunately, digital transformation has come at a high environmental cost.
Increased consumer demand and rapid innovation cycles compound impacts across a
product’s life cycle: embodied energy in manufacturing materials and devices (Köhler and
Erdman 2004; Malmodin et al. 2010), electricity consumption during use (Köhler and
Erdman 2004), and environmental and human health risks of managing these products in the
waste stream when toxics (lead, mercury, and arsenic, among others) may be released in
uncontrolled environments (Williams et al. 2008). In response to these environmental
challenges, the field of industrial ecology, which attempts to model industrial systems after
biological processes to achieve sustainability objectives, has developed strategies including
dematerialization, eco-design, energy efficiency, life cycle management, and extended
producer responsibility policies. For example, in the U.S., the Electronic Product
Environmental Assessment Tool (EPEAT®) green purchasing tool and the U.S. EPA’s
Energy Star® efficiency standard have aimed to reduce the environmental footprint of
improvement strategies and the rebound in consumption is the reality that electronic products
are consumed in a highly interrelated fashion, where ownership of one influences the
purchase of another. For example, when purchasing a laptop, a consumer is also likely to
purchase a printer, cable modem, digital music player, and external data storage drive that all
work together to provide the desired computing services. Thus, escalating consumption may
actually offset any individual impact reductions since ‘per product’ management strategies
do not address the electronic product system as a whole.
Industrial ecology’s premise that industrial systems are part of a broader natural
ecosystem (Frosch and Gallopoulos 1989; Ashton 2002) has been a widely appealing
organizing concept and, as a result, provided a foundation upon which to build models to
advance the sustainability science. The success of industrial ecology to date may be largely
attributed to recognizing that natural systems are the only real model available for
sustainability (Bey 2001) because ecosystems have evolved over millions of years to exhibit
qualities such as robustness, efficient functionality, and effective material recycling (Nielsen
2007). Thus, sustainability practitioners endeavor to understand and emulate properties of
natural systems containing desirable qualities that lack in existing ‘unsustainable’ industrial
systems (Nielsen 2007).
Subsequently, a wide body of industrial ecology literature has traditionally focused on
concepts found in stable biological ecosystems such as food webs, metabolism, material
cycling, interdependence, and symbiosis (Harper and Graedel 2004; Korhonen 2001). The
ecosystem point of view is appropriate and attractive to many scholars because of industrial
ecology’s emphasis on systematic thinking and emergent behavior and proprieties from
complex techno-industrial systems. However, the implementation of tools can be
challenging due to the complexity of scale, number of interacting organisms, diversity of
biotic and abiotic material flows, temporal and spatial heterogeneity, and dynamic evolution
towards increasing complexity (Jorgensen 1992/1997; Hermansen 2006). For instance, many
tools have been developed in a static mindset, in contrast to constantly evolving natural
ecosystems and communities that need to be evaluated in a dynamic manner (Ricklefs and
Miller 2000). Moreover, the focus on the concepts of ecosystems and symbiosis have
resulted in a limited number of successfully designed sustainable industrial systems due to a
awareness or trust, and difficulty of sharing information (Boons and Howard-Grenville
2009).
Although other ecological concepts are potentially applicable and scholars agree there
is a need to move beyond the ecosystem-scale metaphors (Bey 2001; Spiegelman 2003;
Mayers 2008), limited examination has occurred. Levine (1999, 2003) has suggested that a
product approach would add value and complement existing ecosystem-centered studies.
One example of research applied to products is Babbitt et al. (2009)’s application of
age-structured model of population dynamics to predict computer lifespan and electronic waste
generation. While some novel concepts like diversity or community structure have been
applied previously in industrial ecology, these models have remained at the ecosystem level
and focused on firms (Matutinovíc 2001; Korhonen and Snäkin 2005; Wright et al. 2009;
Nieuwenhuis and Lammgård 2010) or economic sectors (Templet 1999, 2004; Ashton 2009)
rather than groups of products.
Addressing household electronics as a group or a ‘portfolio’ in the case of Williams
(2011) builds upon Levine’s product-centered approach (1999, 2003) and a limited number
of preceding studies that have examined various combinations and types of consumer
electronics (Hertwich and Roux 2011; Malmodin et al. 2010; Teehan and Kandlikar 2013).
In addition, a limited analysis on other groups of products has occurred including an
‘ensemble’ of energy generating systems (Gutowski 2010; Kotaro et al. 2012), ‘fleet’ of ferry
vessels (Winebrake et al. 2005) or fishing boats (as reviewed by Van Putten et al. 2012), a
‘fleet’ of automobiles (Field et al. 2000; Levine et al. 2007; Stasinopoulos 2012), and group
of mobile telephony (Michalakelis et al. 2010). The field of biological community ecology,
which studies groups of organisms living and interacting in a defined habitat, offers a
promising approach to modeling and managing groups of interacting consumer electronics.
Furthermore, using community ecology and optimal foraging as a basis for new approaches
responds to a repeated theme in the industrial ecology literature: a need for more connection
to the underlying source science, biology itself (Templet 2004; Wells and Darby 2006;
(Levine et al. 2007). Focusing on the meso scale is important because impacts for emerging
technologies (in addition to land use, agriculture, and transportation) are often linked to
consumption behavior (Guinée et al. 2010). Moreover, the household scale is critical in
pro-environmental behavior research because residents generally have more control over the
household’s purchasing decisions, in contrast to the larger macro scale (firm or nation), in
which only a few people hold overall responsibility (Reid et al. 2010). Systematic
understanding of how interactions within households can lead to more effective policies that
encourage behavioral changes, reduce overall household environmental impacts (Reid et al.
2010), and broaden the application and scope of LCA methodology (Guinée et al. 2010). For
example, considering products as an interconnected group rather than on a single product or
‘per product’ basis has already facilitated the development of pollution reduction standards
and policies (e.g., vehicle mileage standards) (Winebrake et al. 2005).
1.2. Research Goals and Objectives
The overall goal of this research is to build new industrial ecology methodologies to
characterize a group of rapidly evolving consumer electronics products and lend insight to
more effective design, purchasing, and end of life (EOL) management decisions. The goal is
achieved by:
1) Identifying research methodologies inspired by community and behavioral ecology
for use in the field of industrial ecology, the ‘science of sustainability’ that is
otherwise primarily focused on ecosystem metaphors and product-based models,
2) Adapting these methodologies from their biological basis into innovative practical
tools relevant for industrial and product systems, and
3) Applying these methods to a case study of household consumer electronics in the
U.S. that supply information, communication, and entertainment services.
By demonstrating the utility of the ‘community’ approach for a complex system such as
products that provide information and communication services, findings from this research
may be applied to product systems in other complex, emerging fields such as
nanotechnology, biotechnology, and renewable energy infrastructure. Moreover, this
research may also help validate existing biological models.
Chapter II - adapting ecological concepts into industrial equivalents for a community
of consumer electronics;
Chapter III – establishing a framework to measure the structural composition and
functional diversity of a group or community of consumer electronics devices owned
by an average U.S. household (i.e., electronic product community);
Chapter IV - linking the electronic product community’s structural changes with
ecosystem level energy flows; and
Chapter V – evaluating EOL processing decisions to manage an increasingly diverse
II. Adapting Ecological Concepts
As a whole, a biological community is a collection of populations of plants, animals,
bacteria, and fungi that live and interact with one another in a delineated area and form a
“distinctive living system with its own composition, structure, environmental relations, development, and function” (Whittaker 1970, 1). A biological community can be as large as
all the plants and animals in the world, or as small as a single rabbit and bush (Dice 1968).
Ecologists generally focus on changes in community’s structure (i.e., number and distribution
of species), interaction of species (e.g., competition, commensalism, and mutualism), and the
variety of functions provided by these species subsiding in the community (Krebs 2009).
While the field initially began with simply descriptions and enumerations about the number
and type of species in a given environment or locale, modern community ecology has
progressed to using experiments and models exposing underlying processes that are created
from particular patterns or structure in a community (Hairston 1989).
To demonstrate the utility of applying ecological concepts for the study of product
communities, relevant concepts from community and behavioral ecology are adapted from
their biological basis into terminology germane to the electronic product community.
Ecological concepts selected must be expressly applied and understood in the context of
industrial ecology. Table 1 provides a sample of terminology adapted specifically for a
group of consumer electronic devices. As noted in Table 1, biological species is an
evolutionary unit with the potential to reproduce with another individual within its
classification (Ricklefs and Miller 2000; Smith and Smith 2000). Species are characterized
by attributes or traits, such as morphology or size (Smith and Smith 2000; Krebs 2009),
whereas a population, or group of individuals from the same species living in the same
habitat at the same time, is measured in terms of abundance (i.e., population size) (Smith and
Smith 2000). A species fulfills one or more ecological functions or roles in a system.
Functions are defined by consumption (e.g., predator eating prey) (Bengtsson 1998),
influence on ecosystem processes (e.g., nutrient cycling) (Díaz and Cabido 2001), or
response to external perturbations (e.g., changes in climate) (Díaz and Cabido 2001). For
example, the bacterial species Rhizobium leguminosarum facilitates the uptake of nitrogen
the range of conditions in which it exists is known as a species’ niche (Hutchinson 1957;
[image:16.612.93.536.164.679.2]Whittaker 1970).
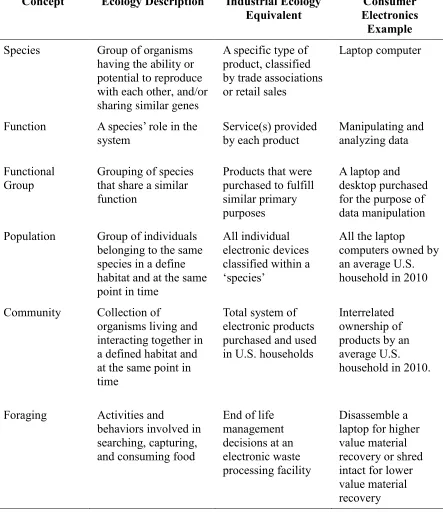
Table 1 Adaption of community ecology concepts to a household electronics community.
Concept Ecology Description Industrial Ecology
Equivalent Electronics Consumer
Example
Species Group of organisms
having the ability or potential to reproduce with each other, and/or sharing similar genes
A specific type of product, classified by trade associations or retail sales
Laptop computer
Function A species’ role in the
system
Service(s) provided by each product
Manipulating and analyzing data
Functional
Group Grouping of species that share a similar function
Products that were purchased to fulfill similar primary purposes
A laptop and desktop purchased for the purpose of data manipulation
Population Group of individuals belonging to the same species in a define habitat and at the same point in time
All individual electronic devices classified within a ‘species’
All the laptop
computers owned by an average U.S. household in 2010
Community Collection of
organisms living and interacting together in a defined habitat and at the same point in time
Total system of electronic products purchased and used in U.S. households
Interrelated ownership of products by an average U.S. household in 2010.
Foraging Activities and
behaviors involved in searching, capturing, and consuming food
End of life management decisions at an electronic waste processing facility
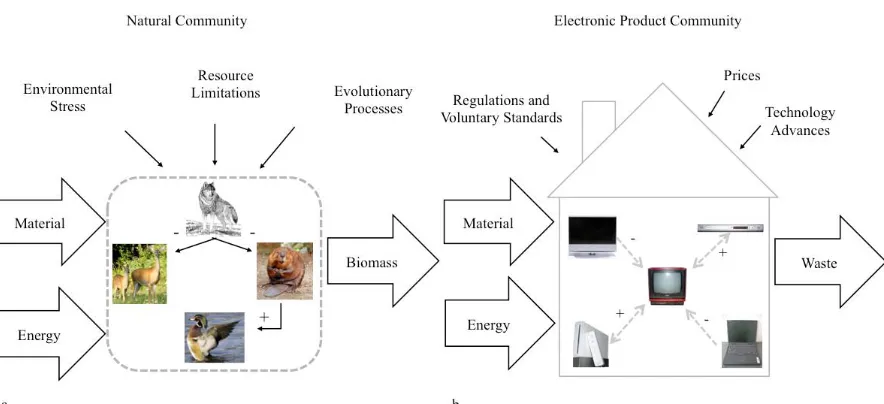
As shown in Figure 1a, a community’s structure and the functions provided by its species are
affected by inputs (nutrient and resource availability), outputs (biomass from deceased
organisms), and exogenous factors, such as food limitations or temperature fluctuations
[image:17.612.95.537.190.392.2](Ricklefs and Miller 2000).
Figure 1 Adoption of community ecology principles to a the electronic product community: a) illustrates the community ecology concepts in terms of an example animal community (e.g., grey wolf, white tail deer, and beaver) in the Adirondack Park, New York State, and b) applies community ecology concepts to a select group or ‘community’ of consumer
electronics owned by an average U.S. household. Images are from the NYS Department of Environmental Conservation (2012) and Wikimedia Commons (2012).
One of the interactions noted in Figure 1a is competition or the predator-prey
relationship (e.g., wolf eating a deer). Foraging, or the activities and behaviors associated
with locating, handling (i.e., capturing and taking apart) and consuming, is an important
interaction that is critical to a natural species’ health and reproductive success (Reilly et al.
2007). Foraging strategies are widely studied in ecology because the “..stomach sways the
world” (Fabre 1913 as noted in O’Brien et al. 1990), or in other words, influences ecosystem processes (O’Brien et al. 1990). As a result, ecologists have constructed prey selection,
search strategy, and patch selection optimization models (Stephens and Krebs 1986).
Following Figure 1b and as noted in Table 1, ecological concepts are adapted to the
industry-defined category (e.g., laptop computer). Following Whittaker’s (1970) definition, an
electronicproduct community would be an assemblage of products that exist and interact
directly or indirectly in a shared spatial and temporal setting. This research defines the
boundary of the electronic product community as the average U.S. household between 1990
and 2010. Moreover, consumer electronics provide functions, such as a laptop initially
purchased to fulfill a function of manipulating and analyzing data, images, and text, but also
provides additional functions (e.g., playing audio, messaging, and e-mailing). An electronic
product community, as with natural communities, has its own composition, internal and
external interactions, functions, inputs, and outputs (Figure 1b). Energy inputs are electricity
and fuel; material inputs include plastics, base and precious metals, and glass; and outputs are
obsolete products. Similar to natural communities, changes in electronic product inputs and
outputs are a function of household purchase and usage behaviors. Additionally, the
electronic product community would respond to external perturbations, such as technological
improvements and price fluctuations. Considering household electronic devices as a group
or community also enables the evaluation of ‘foraging’ strategies faced by an e-waste
processing facility such as shredding a product lower value material recovery or
disassembling for higher value material recovery. Thus, the field of community ecology
offers a systematic approach to assessing the electronic product community’s dynamic net
environmental impacts.
Jensen et al. (2011) criticizes industrial ecology for cherry picking ecological
concepts. In an attempt to address this concern, the similarities and differences between both
systems is compared throughout. Learning from the differences between ecological and
industrial systems is just as significant as the similarities, because the descriptive divergences
may “limit the value of a prescriptive model we might derive” (Levine 2003, p.). The goal
here is to operationalize ecological concepts as relevant and useful tools for the selected
industrial product system (consumer electronics). Methodologies from this research would
need to be re-adapted to other product groupings, as the structures and interactions may vary,
competition) that result in a given structure. However, the first stage in understanding
interactions among electronic devices in terms of purchase and use patterns and resultant
environmental implications is the characterization and quantification of the community’s
species and functions, as described in Chapter III. The connection between community
structure and ecosystem energy flows is then described in Chapter IV, in which a
methodology is developed to analyze the net environmental impact for the entire community
of electronic products. Finally, Chapter V demonstrates the applicability of behavioral
ecology’s optimal foraging theory to evaluate decisions related to ‘feeding’ or the processing
III. Assessing Community Structure and Function
3.1. Introduction
Due to growing negative and positive environmental, social, and economic impacts
associated with consumer electronics production, use, and disposition, this research asserts
that effective sustainability strategies must account for the interdependence of product
consumption by considering an entire community of consumer electronics. The field of
biological community ecology, which studies groups of organisms living and interacting in a
defined habitat, offers a hopeful approach to modeling and managing groups of interacting
consumer electronics. Additionally, a new methodology based on the field of community
ecology answers a call in the industrial ecology literature for stronger connection to the
fundamental source science (Templet 2004; Wells and Darby 2006; Mayer 2008; Jensen et
al. 2011).
The purpose of this chapter is to demonstrate the utility of adapting a community
ecology perspective for complex and rapidly changing groups of interconnected products so
decision makers can better understand the mechanism driving the sustainability of electronic
product community. This methodology provides a foundation on which environmental
impacts (e.g., life cycle energy intensity or material flows) can be assessed for an entire
product system, ensuring that quantified impacts reflect actual consumption and technology
dynamics.
This chapter incorporates the relevant community ecology concepts that are translated
into industrial equivalents in Chapter II into a community structure and function
methodology. The methodology demonstrated in this research mirrors a process of how
ecologists assess dynamic changes in biological community structure and function.
Ecologists assess the structure of species composition, functions provided by these species,
and resulting species interactions. Community structure is assessed using diversity indices,
which measure the number and distribution of species present over time (Collier et al. 1973;
The novelty of using the community ecology perspective will lend insight to effective
design, purchase, and life cycle management for communities of consumer electronics to
avoid some of the pitfalls of ‘per product’ solutions described in Chapter I. This chapter also
seeks to better understand similarities between natural and product communities and where
such analogical methodologies must diverge. Ultimately, the knowledge from the
community scale can contribute to comprehending stability and sustainability impacts at a
larger scale. The results are then incorporated into other sections of the dissertation, thereby
linking structural changes to ecosystem level flows.
3.2.Methodology
The application of the community ecology methods was to a typical group of
consumer electronics consumed by an average U.S. household. The type of products
included in this community was interconnected and responsible for supplying information,
communication, and entertainment services desired by a household. Data were collected to
characterize the representative community, a process that includes identifying species and
classifying their functions. Finally, dynamic changes in community structure and function
were analyzed based on empirical community ecology models.
3.2.1. Characterizing Community Structure
The first stage in implementing community ecology methods was evaluating the
electronic product community’s structure in terms of product species abundance, diversity,
and attributes over time. Abundance is the number of each product species owned per
household. Product species are characterized by attributes of mobility (i.e., stationary or
mobile device) and functionality (i.e., product with single or multiple functions). Each type
of common household electronic device was considered to be an individual ‘species,’ using
product categorizations established by U.S. trade industry reports (CEMA 1998,1999; Roth
and McKenney, 2007; Eskelsen et al. 2009; Urban et al. 2011), trade magazine articles (CEA
2008-2010), and reports on electronic waste by the U.S. EPA (2008, 2011).
Over 30 interrelated electronic products providing information, communication, and
entertainment services for the average U.S. household were identified and then narrowed to
sufficient publicly-available sales or household adoption data and/or products present at less
[image:22.612.88.545.136.671.2]than an average 0.05 devices per household.
Table 2 Household consumer electronic products included in the analysis
Product Type of Data and Years
Available
Data Sources Notes
Blu-ray player Sales units for 2008-2010, household penetration rates 2009-2010, and installed units for 2010
CEA 2009, 2010; Urban et al. 2011
d
Mobile phone - basic
Sales units for 1984-1995 and 2003-2008, installed units for 2006, and household
penetration rate for 2010
CEA July/August 2010; Eskelsen et al. 2009; Roth and McKenney 2007, U.S. EPA 2008, 2011
b,d
Mobile phone – smartphone
Household penetration rates for 2008-2009 and sales units for 2003-2007 & 2010
CEA 2009, 2010; Eskelsen et al. 2009; Herbert 2008
Computer – desktop
Sales units for 1980-2010, installed units for 2006 & 2010, and household
penetration rates for 2008-2010
CEA 2009, July/August 2010; Roth and McKenney 2007; Urban et al. 2011, U.S. EPA 2008, 2011
a-d
Computer – laptop
Sales units 1989-2010, installed units for 2006 & 2010, and household penetration rate for 2008 & 2010
Eskelsen et al. 2009; Roth and McKenney 2007; Urban et al. 2011
c,d
Computer – netbook
Sales units (based on market share) 2008-2009, installed units for 2010
Baker 2008; Urban et al. 2011; Jeffries 2010
d
Digital camcorder
Sales units for 1996-2004 & 2010 and installed units for 2006 & 2010
CEA July/August 2010; Roth and McKenney 2007; Wilburn 2008; Urban et al. 2011
c,d
Digital camera Sales units for 1995-2005, installed units for 2006 & 2010, and household
penetration rates for 2008-2010
CEA 2009, CEA July/August 2010; Herbert 2008; Wilburn 2008; Roth and McKenney 2007; Urban et al. 2011
Product Type of Data and Years Available
Data Sources Notes
DVD player Household penetration rates for 1998-2010 and installed units for 2006 & 2010
CEA 2009, July/August 2010; Eskelsen et al. 2009; Roth and McKenney 2007; Urban et al. 2011
a-d
E-reader Sales units 2006, 2009-2010
and household penetration rate for 2010
CEA July/August 2010; Konig 2010; PBT Consulting 2012; Printed Electronics World 2011 Gaming
console
Installed units for 2006 & 2010, household penetration rates for 2004-2008 & 2010
Arendt 2007; Eskelsen et al. 2009;
Urban et al. 2011; Grabstats.com, 2011
c,d
Monitor – CRT Sales units 1998-2010, installed units for 2006, and household penetration rate for 2010
Roth and McKenney 2007; U.S. EPA 2008, 2011
c,d
Monitor – LCD Sales units 1998-2010, installed units for 2006, and household penetration rate for 2010
Roth and McKenney 2007; CEA July/August 2010; U.S. EPA 2008, 2011
c,d
MP3 player Installed units for 2006 & 2010, and household penetration rates for 2004-2008, 2010.
Eskelsen et al. 2009; CEA July/August 2010; Roth and McKenney 2007 c,d Multi-functional and hardcopy printers
Sales units for 1980-2010, household penetration rates for 2008-2010, and installed units for 2006 & 2010
Herbert 2008; CEA 2009, July/August 2010; Roth and McKenney 2007; Urban et al. 2011; U.S. EPA 2008, 2011
a-d
Tablet Sales units for 2010, expected
sales 2011-2013, installed units for 2010, household penetration rate for 2010
CEA 2011, Chisholm, 2011; Indvik, 2011; Urban et al. 2011
d
TV – CRT Installed units 2006 and sales units from 1980-2010
Roth and McKenney 2007; U.S. EPA 2008, 2011
c
TV – LCD Sales units 1999-2010,
Installed units for 2006, and household penetration rates 2008-2009
Herbert, 2008; CEA 2009, 2011, 2012; Roth and McKenney 2007; U.S. EPA 2008, 2011
c
TV- plasma Sales units 1999-2010 and installed units for 2006
CEMA 2011; U.S. EPA 2008, 2011
Product Type of Data and Years Available Data Sources Notes
VCR Sales units for 1982, 1996-2006, U.S. penetration rates for 1980-2008, and installed units for 2010
Coplan 2006; Roth and
McKenney 2007; Eskelsen et al. 2009; Urban et al. 2011
c,d
20 = Total number products included
Notes: abbreviations in Table 2 are as follows: a) included in Top 10 Products list by CEA (2009), b) included in Top 10 Products list by CEA (July/August 2010), c) analyzed in an energy consumption report for Consumer Electronics Association by Roth and McKenney (2007), or d) analyzed in an energy consumption report for CEA by Urban et al. (2011).
As noted in Table S-1 in the appendices, automobile-related electronics and most analog
(non-digital) products were excluded. Camcorder and camera data included only digital
devices, but some analog products were included in this analysis because of high ownership
concentrations (e.g., VCR) and/or because of conflation of analog and digital sales data (e.g.,
CRT television). Hardcopy printers, fax machines, scanners, and digital copiers were
aggregated into a single product species (hard copy device) because the only available sales
data combined the devices into one category (U.S. EPA 2008, 2011). While limiting the
analysis to those products passing the screening criteria may not provide a complete
inventory, the methodology can be easily adapted as more product data become available.
Product species abundance (n), or population size per average U.S. household, was
computed by quantifying the total stock (Q) of each product type (i) owned in the U.S. in
each year (t) and dividing by the number of U.S. households in that year (Equation 1):
1
The number of U.S. households (x) was directly obtained from the U.S. Census
Bureau (1990, 2000, 2005-2010). For a few products (DVD player, MP3 player, and gaming
console), product abundance was directly available from published household penetration
rates (Arendt 2007; Eskelsen et al. 2009; CEA 2009, 2010; Grabstats.com 2011). Otherwise,
the total stock of products each year was determined using material flow analysis (MFA)
methods that calculate the changes in stock over time using either: 1) known product sales
In the first MFA method, stock (Q) for each product (i) in year (t) was calculated
using data describing previous year’s stock (Qt-1) and current year unit sales (Usales) and units
discarded (Udiscards), from published reports by the U.S. EPA (2008, 2011), as noted in
Equation 2:
Qi,t = Qi,t-1 + Usales,i,t – Udiscards,i,t 2
For products with no known discard rates, the second MFA method was applied, in
which stock was back-calculated by first estimating yearly outflow units using annual sales
data (Wilburn 2008; Eskelsen et al. 2009; CEA 2010; Indvik 2011; PBT Consulting 2011;
Printed Electronics World 2011) and lifespan distribution models (e.g., Babbitt et al. 2009) as
noted in Equation 3:
∑ 3
For each product (i) and year (t), the number of obsolete units (Udiscards) was determined by
multiplying units sold (Usales) in year (t-n) by the fraction (Fn) of those products that reached
obsolescence after an n-year lifespan. Lifespan and sales data were obtained from MFA
studies and lifespan distributions provided by the U.S. EPA (2008, 2011) and additional data
sources (Tables S-2 to S-5).
The structure of the electronic product community was characterized using common
ecological diversity indices. In ecology, diversity is attributed to richness (number of species
present), evenness (how species’ populations are distributed), or a combination thereof
(Magurran 1988; Clark and Warwick 2001). Metrics used to quantify structural changes in
the product community therefore included species richness (St), species abundance (nt) (as
described in the preceding section), Pielou’s evenness index (Jt´), Simpson Dominance Index
(t), Brillouin Index (HB,t), and Shannon Weiner Index (H't), which are described below.
Species richness (St) was determined by counting the number of electronic products
present in the community per year (t). Pielou’s evenness index (Jt´), was calculated as shown
in Equation 4 and has values ranging between zero, which indicates an uneven community
(few products with large populations), and one, which implies a uniformly even distribution
of species’ abundances. Simpson dominance index (t) (Equation 5), also known as an index of “commonness,” (Pielou 1975, 9) is the probability that any two individuals chosen
dominance is calculated based on the proportion of each species in the community (i), a
function of number of individuals (ni) per species divided by total number of individuals in
the community (Pielou 1975; Krebs 2009). Total individuals (Nt) were a count of all
products present in the community per year (t), (Equation 6). While Simpson dominance
also varies from zero to one, the scale is opposite that of evenness: values closer to one are
associated with groups dominated by one or a few species (Pielou 1975).
∑( ( ))
4
∑( ) ∑ ( )
5
∑ 6
Two diversity indices, which integrate concepts of richness and abundance (Magurran
1988; Clark and Warwick 2001), were computed. Brillouin Index (HB,t, Equation 7) is
commonly applied to communities where all members can be enumerated (Pielou 1975), as
in this situation, while large communities requiring sampling are evaluated with the
commonly applied ShannonWeiner Index (Ht', Equation 8).
∑
7
∑ ( ( )) 8
Both diversity metrics are used here, due to their widespread use in ecological studies and as
a means of determining robustness of results depending on indices selected. The analyses
described above were computed using Microsoft Excel and ecological statistical software,
Plymouth Routines in Multivariate Ecological Research (PRIMER) version 6 (Clark and
Gorley 2006).
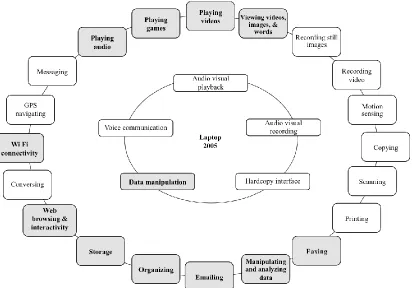
3.2.2. Characterizing Product Functions within the Community
The analysis of the electronic product community’s structure, described above, was
product was also characterized in terms of its total functions at a given time, based on
descriptions provided in product manuals, technical reviews of ‘typical models,’ trade
industry publications, or Consumer Reports publications. Figure 2 illustrates the assignment
of functions: the inner circle identifies the five primary functional groups, while the outer
circle reveals the bundle of all possible functions in an average U.S. household (functions are
either present or absent depending on whether the product in consideration is owned and has
that function at a given time). Thus, a 2005 laptop belonging to the data manipulation
functional group also provided several additional functions that year, as noted by the shaded
boxes, including interactively playing videos and passively viewing videos, images, and
words. All functions per product and model year are provided in Tables S-6 to S-9 in the
appendices.
[image:27.612.103.515.337.625.2]In ecological literature, the variety of functions provided by species is measured by
‘functional richness,’ a count of all unique functional groups (Díaz and Cabido 2001).
Because the electronic product community had a small and static number of functional
groups (five, see Figure 2), this metric was adapted to provide more useful information, by
quantifying the available and totalfunctions provided within the community. Available
functions were determined on a binary basis: at a given time, did the function exist in any
product within the community or not. Evaluation of function was built upon the abundance
analysis, first determining which products existed in the community in year (t) and then
determining which functions those product could theoretically provide at that time. Because
available function is binary, each function is counted only once, even if more than one
product possessed that function. Total functions, on the other hand, included all functions
theoretically provided by the products in the community per year. For example, a household
owning one smartphone and two basic mobile phones had one available conversing function,
but three total conversing functions. The purpose of this distinction is to enable analysis of
functional redundancy, assuming that functions provided by different products are of equal
value to the household, an assumption that is revisited in the discussion. This research also
categorized function within stationary versus mobile products and single versus
multi-functional (having three or more functions) products, for three years in the data set (1990,
2000, and 2010).
The total function analysis described above was also extended to account for actual
product consumption and functional redundancy, which is observed in natural communities
when more than one species provides similar or equivalent functions. For the product
community, a hypothetical ‘consumption-weighted functional capacity’ was calculated to
determine the maximum potential bundle of functions provided by all the products owned by
an average household (in 1990, 2000, and 2010). This analysis quantified capacity per
function (Cf), which accounted for the abundance of each product species (ni) and total
functions that the product can theoretically provide. Total functions were determined with a
For each product (i) and year (t), equaled zero if the function did not exist or one if the
function did exist in that specific product.
Because the entire household does not share each product in the electronic
community, sensitivity analysis on the functional capacity was conducted. An average
household in 2010 consisted of 2.58 members (U.S. Bureau of the Census 2010). However,
the only products in 2010 that would be considered individually owned and had similar or
greater abundances than the average of number of household members were devices included
in the voice communication functional group (basic mobile and smartphone). To calculate
the ‘true’ redundancy for a household in 2010, the functional capacity associated with all the
smartphones and a portion of the basic mobile phones were subtracted from the original
community’s functional capacity. The true functional capacity analysis assumed that 1.03
smartphones and 1.55 basic mobile phones (2.58-1.03) were individually owned by members
(2.58) of the household. Therefore, only a remaining 1.98 basic mobile phones (3.48 total
basic mobile phones) contributed toward the community’s new functional capacity.
Finally, a futuristic scenario was also calculated to begin to explore a household with
‘minimal redundancy’. The minimal redundancy scenario, which was based on the concept
of households sharing fewer, single function devices and individually owning a fewer
number of multifunctional devices, is based on industry trends where patterns of functions
are changing and shared by multiple products (NEEP 2013). For example, viewing video or
television programming has shifted from solely using a traditional TV to multiple products
such as smartphone or tablet (Barns 2014). In this scenario, devices assumed to fulfill a
household’s minimal functional capacity requirements included one laptop, LCD TV, gaming
console, MP3 player, printer per household, and each individual member owning a
smartphone and tablet. To calculate the minimal functional capacity, the binary factor ( )
(whether the function existed or not in 2010) is multiplied by an abundance of one for each
shared device and the binary factor ( ) is multiplied by an abundance of 2.58 (average
number of individuals in the household) for individually owned products. A list of
product-specific binary factors and community-level binary factors are located in Tables S-10 to S-13
3.3. Results and Discussion
3.3.1. Electronic Product Community Structure
The electronic product community size and structure evolved dramatically in the
average U.S. household between 1990 and 2010 (Figure 3), in contrast to a relatively
constant household size (2.29 members/household in 1990 and 2.58 in 2010; Table S-5).
Products in this community were grouped by attributes of mobility and density. Mobility
included either stationary products (only used in one location), such as a desktop computer,
or mobile products (use batteries and can travel with the owner) like a mobile phone.
High-density products had abundances greater than one per household, while low-density products
had generally less than one device per household. In 1990, a few stationary products, like the
CRT TV and VCR, dominated the community, but by 2010, the community shifted to reflect
rapid adoption of small, mobile electronics like mobile phones and digital cameras. As
shown in Figure 3c and 3d, stationary products undergoing technological innovations
experienced significant growth, as seen for DVD players and LCD TVs, while mature
stationary products, such as desktop computers, printers, VCRs, CRT monitors, and CRT
Figure 3 Dynamic changes in species abundance (number of products per household) from 1990-2000: a) mobile low-density, b) mobile high-density, c) stationary low-density, and d) stationary high-density. Note different scales for ‘low density’ and ‘high density’ products. Table S-2 to S-4 identifies all population sizes per product per year. *Printer category includes all hardcopy devices.
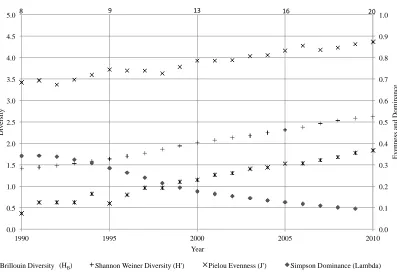
Ecological diversity metrics describing overall richness, evenness, and diversity of
the electronic product community show a shift from an uneven community with low diversity
to an increasingly diverse and even structure (Figure 4). Product richness increases 150% -
from 8 to 20 products per household from 1990-2010. Trends from the Pielou evenness and
Simpson dominance indices suggest that the community is initially uneven, where a few
products like the CRT TV and desktop computer were dominant. But by 2010, products are
more evenly distributed because of rapid consumption of new small mobile devices. Beyond
2010, this trend toward evenness will depend heavily on consumer preferences, potentially
becoming uneven again if users converge on a small set of highly multi-functional devices.
Increasing community diversity is confirmed with upward trends in both Shannon Weiner
Laptop Tablet Netbook E-reader Camcorder MP3 Player 0.0 0.2 0.4 0.6 0.8 1.0 1.2
1990 1995 2000 2005 2010
P o p u la ti o n S iz e P er H o u se h o ld Camera Basic Mobile Phone Smartphone 0.0 0.5 1.0 1.5 2.0 2.5 3.0 3.5
1990 1995 2000 2005 2010
(c) (d)
(a) (b)
Desktop Printer* CRT TV VCR 0.0 0.5 1.0 1.5 2.0 2.5 3.0 3.5
1990 1995 2000 2005 2010 Year 0.0 0.2 0.4 0.6 0.8 1.0 1.2
1990 1995 2000 2005 2010
P o p u la ti o n S iz e p er H o u se h o ld Year LCD TV DVD Player Gaming Console Plasma TV
and Brillouindiversity indices. It is clear that the electronic product community has
expanded both in terms of overall numbers and in complexity. However, to determine
whether increasing diversity has fostered a greater degree of information and communication
functionality per household, an analysis of the community’s functional diversity is
considered.
[image:32.612.121.518.207.479.2]
Figure 4 Ecological diversity metrics illustrate changes in the consumer electronic community structure from 1990-2010 (bottom x-axis), including diversity (left y-axis), evenness (right y-axis), and richness (top x-axis). Results are generated using PRIMER-E, version 6 (complete numerical results in Table S-14 in the appendix).
3.3.2. Electronic Product Community Functions
To address the relationship between structural and functional changes, the number
and type of functions provided by each product and for the community as a whole are
0.0 0.1 0.2 0.3 0.4 0.5 0.6 0.7 0.8 0.9 1.0 0.0 0.5 1.0 1.5 2.0 2.5 3.0 3.5 4.0 4.5 5.0
1990 1995 2000 2005 2010
E v en n es s an d D o m in an ce D iv er si ty Year
Brillouin Diversity (HB) (HB) Shannon Weiner Diversity (H') Pielou Evenness (J') Simpson Dominance (Lambda) 9
8 13 16 20
shows that the total functions provided by each product also rise over time, due to increasing
multi-functionality, particularly for mobile products. Mobile products increase in
functionality tenfold from 1990 to 2010 (Figure 5b) for two reasons: 1) new products enter
the market with unique features and 2) existing product species evolve towards
multi-functionality to keep up with consumer demand. Mobile products are almost exclusively
single function in 1990, but 80% of all mobile products are multi-functional by 2000 and
100% by 2010. While increasing multi-functionality is an inevitable result of consumer
demand and technological innovation, over time the product community has developed a
high degree of functional redundancy.
Figure 5 Changes in community-level functionality: a) compares number of available functions in the community to the number of products per household, and b) compares number of total functions per mobile (M) and stationary (S) product species and percentage of multi-functional (greater than three functions) product species in the community, 1990, 2000, 2010.
Functional redundancy was explored further through the consumption-weighted
functional capacity analysis, which shows that the household’s functional capacity has
expanded unevenly (Figure 6), with significant increases in total functions for playing audio
and games and recording video. Households have been purchasing more types of devices
that can record video (digital camera, camcorder, mobile phone, smartphone, or tablet) and
doing so at increasing rate (between 2000 and 2010 digital cameras increased from almost
zero to over two per household). Moreover, after the year 2000, most functions, except for
those related to hardcopy interface (i.e., printing, scanning, faxing, and copying), became
theoretically redundant according to ecological perspectives, in that their total capacity
exceeds their available capacity (one). Because functional redundancy depends on the
species sampled, the estimate presented here is conservative, and would increase if certain
products (hardcopy) are split into multiple groups or if analog devices (e.g., film cameras)
[image:34.612.110.525.207.468.2]were included as alternate means for providing information and communication services.
Figure 6 Hypothetical consumption-weighted functional capacity: 1990, 2000, 2010. Significant increases in functional capacity are observed across the community. By 2010, redundancy is observed in most functions, e.g., nine devices have ‘recording video’ functionality.
Because certain products, like a smartphone, are used by an individual rather than
shared by all household members, an attempt is made to illustrate a realistic or ‘true’
functional capacity for the household. As noted in the methodology, individually owned
exclusion of functions associated with individually owned, multi-functional devices that play
audio, record video, interact with the internet, internet, store data, and provide
[image:35.612.100.494.168.447.2]communication functions such as emailing, messaging, and conversing.
Figure 7 Comparison of true and hypothetical functional capacity: 2010. True functional capacity subtracts functions associated with the voice communication functional group (smart and basic mobile phones), so only the ‘true’ redundant functions in the community remain.
From an environmental perspective, functional redundancy may result in negative
consequences, if demand for desired functions is met by increased consumption of a greater
number of unique products. On the other hand, transitioning to adoption of fewer highly
convergent, multi-functional electronic devices could potentially reduce material, energy, and
waste impacts, although such a comparison would require a comprehensive life cycle study.
natural communities, functional redundancy is believed to contribute to system resilience in
the event of external perturbations (Díaz and Cabido 2001). If the same trend is true for
electronic product communities, it will likely require significant intervention to “disrupt” the
existing pattern of redundant product consumption. Future work can extend the results by
adapting an ecological functional trait analysis to evaluate the quality levels at which
consumers would accept each function as being fulfilled. While conducting a functional
trait analysis is out of the scope of this work, potential environmental impact changes
resulting from a shift in the community structure is explored in Chapter IV.
Designing functionally convergent products mirrors how biological species that share
comparable habitats or environmental conditions may ‘converge’ to develop similar physical
features or appearances, regardless of ancestry (Smith and Smith 2000). For example,
modern sharks (fish), extinct ichthyosaurs (reptiles), and modern dolphins (mammals) all
evolved over time to share a ‘fish-like’ form (Diamond and Cody 1985). Further
examination of how products and functions have co-evolved within a functional group may
provide insight to redesigning sustainable products and encouraging green consumer
decisions.
Figure 8 looks in more depth at products classified in functional groups of ‘voice
communication’ and ‘data manipulation,’ which have seen the greatest increases in
functional capacity over time. In both cases, these product groups have transitioned from
specialists with single or few functions to generalists that offer multiple (and redundant)
functions. Both product groups undergo periods of technological progress, when the number
of functions per species surges upwards, as well as periods of relative functional stability
(Figure 8a and c). Furthermore, each new species introduced to the product community
enters at roughly the same level of functionality as the existing products (again, no
differentiation is made on the comparability of functions provided by different devices).
Throughout the 20-year period, total functions provided by the data manipulation group
increase from 2 to 45 functions, while the total number of species on the market quadruple.
functional mobile devices with parallel functions, regardless of original classification by
functional group. For example, the tablet and smartphone are categorized under different
functional groups, but share similar appearances and functions (e.g., the tablet entered the
community in 2007 possessing 10 of the smartphone’s 14 functions). In 2011, these products
began to evolve into a hybrid species, the ‘phablet,’ (DesMarais 2013).
Figure 8 Trends in functional groups and emergent functional phases, 1990-2010: a) total functions per product and year for the data manipulation group, b) emergent functional phases associated with all functional groups, and c) total functions per product and year for the voice communication group.
The discussion of function to this point has centered on whether or not a specific
product provides each well-defined function. In reality, however, some product attributes
evolve and recombine over time, introducing ‘emergent functions’ that are not easily
categorized (Figure 8b). For example, dematerialization of computing services into
lightweight, multi-functional products like the tablet or e-reader could be classified as a new
0 2 4 6 8 10 12 14 16
1990 1992 1994 1996 1998 2000 2002 2004 2006 2008 2010
N u m b er o f T o ta l F u n ct io n s
Basic Mobile Phone Smartphone (a) (b) (c) 0 2 4 6 8 10 12 14 16
1990 1992 1994 1996 1998 2000 2002 2004 2006 2008 2010
N u m b er o f T o ta l F u n ct io n s
Desktop Laptop Tablet Netbooks
Homebound computing and
entertainment
impossible to enumerate all combinations, this research interpreted the community’s
evolution through emerging functional phases, considering observed functions and product
attributes, like stationary versus mobile (Figure 8b). For example, the step increase in
functions for the voice communication group after the year 2000 parallels the phase of
portability and web interactivity. After the internet becomes the ‘new normal’ (Pew
Research Center 2005, 59), product innovations are based on novel uses of the internet, like
the demand for ‘hyper mobility,’ a term coined by Accenture (2012, 3) to describe constant
connection to the web for productivity and entertainment.
As new functions emerge and products continue to converge, consideration of
minimum redundancy may help prioritize high-use functions to be integrated into fewer,
convergent devices to meet consumer demand. The ‘minimal functional’ capacity scenario
(as shown in Figure 9) is consistent with an ‘eco-sufficiency’ strategy of living well while
consuming less resources (Figge et al. 2014) and is portrayed as a futuristic, extreme
‘digitally streamlined’ household owning fewer, functionally convergent devices. The
minimal functional capacity scenario reflects a significant decline in redundancy from the
hypothetical consumption-weighted functional capacity, particularly related to the functions
of recording still images and videos and playing audio, but an increased redundancy in
manipulating data. The reduction in functional redundancy is realized by excluding single
function and/or high-density devices (i.e., desktop, VCR, DVD player, monitors, plasma and
CRT TVs, basic mobile phone, camera, and camcorder). While reductions in functional
redundancy in the minimal functional capacity scenario appears similar to the true scenario, it
is achieved with six rather than 20 devices. Consideration of minimal redundancy thus far
suggests a change in consumption patterns could allow a household to retain a certain level
of communication, entertainment and information services, but evaluating the subsequent
Figure 9 Comparison of minimal and hypothetical functional capacity: 2010. A minimal functional capacity scenario assumes that the household shares one LCD TV, laptop, printer, and gaming console (available function per product=1), as well as each individual owns a tablet and smartphone (functions weighted by 2.58 individuals per household).
While this research assumes that each device can provide services of comparable
quality, in many cases functions are not actually equivalent. For example, the quality of
pictures taken with a mobile phone may be inferior to those captured by a specialized digital
camera. In some cases, the community may actually require more capacity to meet a
minimum level of desired functionality. For example, in a family of four, the minimum
‘conversing’ capacity may be four, so each member can contact each other. Ecologists
evaluate substitutability of functions by comparing trait values and frequency distributions
These types of analyses may provide potential opportunities to expand the community
ecology approach in the future.
3.3.3. Comparison of Electronic Product and Natural Communities
The parallels between product and natural communities discussed so far, like
functional redundancy and convergence, suggest that practical application of the community
ecology concept may benefit from additional consideration of similarities and differences
between biological systems and industrial analogs. Table 3 provides a foundation for this
comparison, using common attributes of a natural community to inspire potential directions
for study of an electronic product community evolving over time.
Table 3 Qualitative comparisons of general succession trends between natural and household electronics communities
Natural Community Electronic Product Community
Stage Early or
developing
Maturing Early or
Developing
Maturing*
Species Diversity (richness & evenness)
Low High Low High
Niche Specialization General or
broad Specialized or narrow Specialized or single function General or multi-function
Functional
Redundancy Low High Low High
Species Size Small Large Large Small
Species Life Span Short Long Long Short
Complexity Low High Low* High*