Int. J. Electrochem. Sci., 6 (2011) 1014 - 1026
International Journal of
ELECTROCHEMICAL
SCIENCE
www.electrochemsci.orgAging Effects to Solid Electrolyte Interface (SEI) Membrane
Formation and the Performance Analysis of Lithium Ion
Batteries
Fu-Ming Wang1,*, Meng-Han Yu2, Yi-Ju Hsiao2, Ying Tsai2, Bing-Joe Hwang3, Yung-Yun Wang2 and Chi-Chao Wan2
1
Nanoelectrochemistry Laboratory, Graduate Institute of Engineering, National Taiwan University of Science and Technology, Taipei, Taiwan
2
Department of Chemical Engineering, National Tsing Hua University, Hsinchu, Taiwan
3
Nanoelectrochemistry Laboratory, Department of Chemical Engineering, National Taiwan University of Science and Technology, Taipei, Taiwan
*
E-mail: [email protected]
Received: 13 February 2011 / Accepted: 2 March 2011 / Published: 1 April 2011
Solid electrolyte interface (SEI) membrane was fabricated in the first electrochemical charged and further sensitively grow in an aging storage of battery. This research demonstrates a new interesting SEI membrane fabrication in the first electrochemical charging “coincides” with aging treatment occurring in the lithium ion battery formation that the results revealed electrolyte effects to SEI membrane composition and the cycling enhancement of battery performance. The research also discusses the SEI membrane composition and the growing morphology on MCMB electrode in the varying formation temperatures examine that the SEI membrane influences rate/cycling performance of the advanced lithium battery (ALB) with two kinds of electrolytes (EC/PC/DEC and EC/EMC). Within the framework of this new perspective work, we can dramatically offer and account for the SEI membrane mechanism while the battery are going to charge coincide with aging called aging-formation to demonstrate the SEI membrane properties combined with electrolytes and aging condition concerning the battery performance.
Keywords: Solid electrolyte interface, lithium ion battery, aging, formation
1. INTRODUCTION
also demonstrates remarkable battery safety properties except for performance. Normal SEI membrane occurs by the ring opening reaction of cyclic carbonates such as ethylene carbonate (EC), propylene carbonate (PC), and lithium salt. These carbonates employ the first electrochemical reaction of battery formation to establish a complex membrane on the anode graphite surface, composited with organic and inorganic lithium based compounds, named SEI membrane or the passivation layer [1-2] or on the alloy [3]. The composition of SEI membrane can be distinguished to several kinds of chemicals including Li2CO3, LiOH, LiF, Li2O, ROCO2Li, and RCOLi. Understanding the ability of SEI
membrane to either enhance cell performance or effectively improve safety is critical, especially for future electric vehicle (EV) development. Xu et al. [4] pointed out that cyclic carbonates such as EC and PC depict an opposite interface deposition mechanism of SEI growing on the graphite. Zhang et al. [5] exhibited that two-electron pathways for EC making up SEI and a single electron pathway for the PC (shown in Figure 1) because of the electron donating group of -CH3 augment electron density
[image:2.596.62.538.339.466.2]around the cyclic structure; however, restricting the other electron pathway reaction establishes a useful organic compound like pathway Ⅱ.
Figure 1. the two-electron pathways mechanism of making up SEI. [5]
To realize the clarity of the electron donating and withdrawing group effects associated to SEI membrane characters, Yang et al. [6] synthesized a series of carbonates with the -CF3 side chain as the
electron withdrawing group compare with PC. His results disclosed that the carbonates with the electron-withdrawing group often lead to earlier reduction potential. Therefore, the I-V curve, and capability of the graphite half-cell reveal ameliorating performance. These scientific outcomes suggest that further electrolyte investigation ought to restrain functional group effects.
However, the functional withdrawing groups inside the electrolyte structure are not enough to
efficiently compete with an electrochemical additive derived from vinylene. These reduction type additives, like vinylene carbonate (VC), employ higher reduction potential in an organic compound on the anode that prevent donating chemicals such as the PC fracture graphite structure by a single electron pathway reaction. Wang et al. [7] discovered an excellent ability with maleimide (MI) structure to become a potential additive and revealed the double SEI layer theory mechanism mixed with VC as a two reductive system, because the contemporary double layers of SEI membrane
et al. [8] attempted to replace existing by expanding the fluoroethylene carbonate (FEC) as a new electrolyte system. They observed that FEC not only generates VC in electrochemical reaction, but also fabricates LiF on the anode surface as an isolating layer to eradicate thermal effects from LiC6.
Furthermore, Wang et al. [9] also studied the relationship of salt dissociation by linear carbonate
effects as useful for the SEI membrane of organic compounds created with single lithium ions.
In addition, some scientists are developing the aging effects by mastering the growth velocity, rearrange the composition of SEI membrane or the kinetic mechanism on the electrode [10]. Recent
researches [11-13], has investigated two main aging methods. The first is the thermal dynamic effect by storage in a typical temperature coupled with the SEI layer that acquires only considerable with fixed voltage. The second method uses kinetic effects with thermal dynamics while cycling the battery under a typical temperature after battery formation. SEI membrane composition exists in a variety of
ionic concentrations from ionic migration and material phase exchange during ion intercalation. These aging improvements not only make up a convenient SEI membrane to enhance battery quality, but
predict the battery life and performance. However, the above mentioned methods use a manufactured charged battery and lose the chance of fabricating SEI membrane throughout the first charge.
This article describes an aging influence of SEI membrane formation and debates PC effect on this specification. The current study further discusses battery performance according to SEI membrane
composition.
2. EXPERIMENTAL
The graphite anode consisted of 93 wt % mesocarbon microbeads (MCMB-2528, Osaka Gas), 3 wt % KS-6 as a conductive additive, and 4 wt % PVDF as a binder. The two electrolytes were 1.1 M lithium hexafluorophoshate (LiPF6) in EC: PC: DEC (3: 2: 5 in volume) and 1.1 M lithium
hexafluorophoshate (LiPF6) in EC: EMC (1: 2 in volume) mixed solvents. The electrochemical
stability of electrolytes was measured by cyclic voltammetry (CV) using a Solatron 1286 from -0.5 to 3.25 V at a scan rate of 2 mV s-1 with a three-electrodes system, consisting of stainless steel working and counter electrodes with an area of 1.0 cm2 and lithium reference electrodes. The electrolytes filled the space between the working and the counter electrodes.
The electrochemical impedance spectroscopy (EIS) was used a Solatron impedance analyzer (SI-1260) in combination with an electrochemical interface (SI-1286) potentiostat/galvanostat in the frequency range from 0.1-100 kHz, AC amplitude of 5 mV, and a room temperature of 26℃. The equipment was controlled using Z-Plot electrochemical software purchased from Solatron, Inc.
electrodes from a glove-box to the XPS and SEM instruments. The SEI membrane will not be influenced by the treatment of the graphite before cell assembly and drying for the prepared program.
Advanced commercial lithium-ion batteries from EXA Co. in Taiwan (ALB, aluminum-plastic laminated film exterior with dimensions of 5.0 × 37 × 59 mm) were used in this work. This kind of battery is a complete cell and only changes the electrolyte for this research. The LiCoO2 was used for
the cathode; MCMBelectrode was used as the anode.
A separator (Celgard 2320) was placed between the cathode and the anode. For battery fabrication, the electrolyte was filled to a predetermined weight. The button batteries thus assembled were used in cycling tests on a Maccor Battery Tester series 4000 as well as electrochemical impedance spectrum measurement.
The standard drain rate of batteries were charged at a constant current at 0.2 C to 4.2 V and discharged at 0.2C, 0.5C, 1C and 2C to 3 V. Batteries were test at 1C/ 1C between 3V and 4.2V to measure the cycle ability.
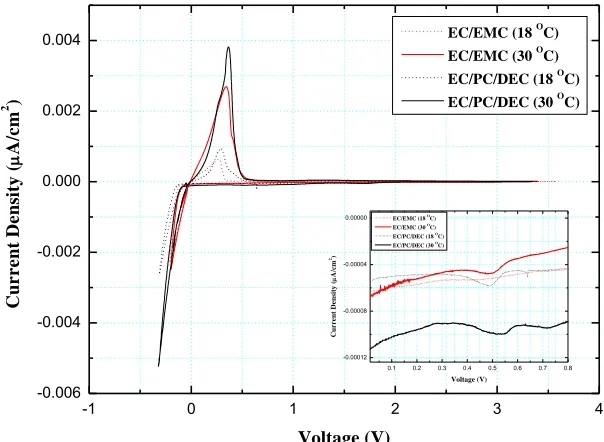
[image:4.596.128.430.465.686.2]3. RESULTS AND DISCUSSION 3.1. Cyclic voltammetry analysis
Figure 2 depicts a plot of typical cyclic voltammetric curves of electrolytes within 18 and 30℃
aging of the ranges -1 to 3.25V (verus Li/Li+) which reveals an interesting electrochemical behavior compared to two electrolyte varieties.
Figure 2. Lithium platin/stripping of cyclic voltammograms of electrolytes within 18 and 30 0C are shown. Working and counter electrode, stainless steel, reference electrode, lithium, scan rate 0 2 mV/s
-1 0 1 2 3 4
-0.006 -0.004 -0.002 0.000 0.002
0.004 EC/EMC (18 OC)
EC/EMC (30 OC) EC/PC/DEC (18 OC) EC/PC/DEC (30 OC)
C u r r e n t D e n si ty ( A /c m 2 ) Voltage (V)
0.1 0.2 0.3 0.4 0.5 0.6 0.7 0.8
-0.00012 -0.00008 -0.00004
0.00000 EC/EMC (18 O
C) EC/EMC (30 O
C) EC/PC/DEC (18 O
C) EC/PC/DEC (30 O
Observations show three aspects from CV measurements. First, the electrolyte conductivity raised according to increased temperature suppresses the intensity of peak current density was promoted by decreasing the ionic resistance. Hence, the lithium ion plating potential shifts to the right side from 18 to 30℃. The EC/EMC system is from 0.21V to 0.19V and the EC/PC/DEC is from -0.32V to -0.29V. In this aim, lithium ions will intercalate earlier at higher temperature into an active material such as carbon with high ionic diffusion rate and provide SEI membrane formation with temperature effects.
Second, the lithium ions stripping and plating integral capacity of EC/EMC system are less than EC/PC/DEC. The EC/PC/DEC electrolyte adjusts high dielectric constant and represents to carry out more lithium ions than EC/EMC, increasing the current density even in low or high temperatures. The SEI membrane formation in these two electrolytes with two temperature effects is the third observation. Figure 2 exhibits two reduction peaks constitute that PC is at 0.64V and EC is at 0.45 ~ 0.52V of the EC/PC/DEC electrolyte (enlarge figure). However, PC decomposition potential shifts to 0.7 ~ 0.75V with an increasing temperature. EC/EMC reveals a sensitive reaction at 0.45 ~ 0.55V of EC. The results suggest that only PC decomposes in a high temperature and validates the SEI membrane reaction is contributed by the EC and PC.
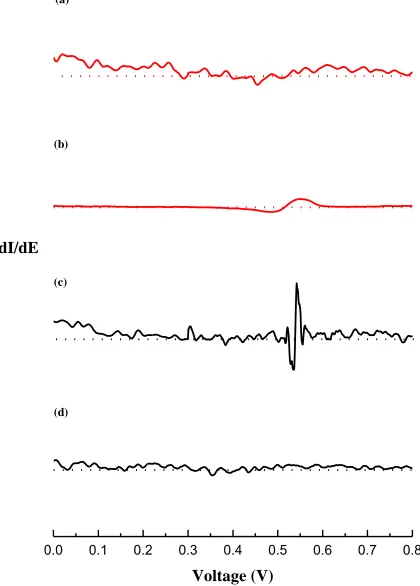
Figure 3. Differential cyclic voltammograms of EC/PC/DEC within a) 30 0C, b) 18 0C and EC/EMC at c) 30 0C, d) 18 0C are shown. Working and counter electrode, stainless steel, reference electrode, lithium, scan rate 0 2 mV/s
Figure 3 shows the SEI reaction continuity mechanism in the differential CV curves. EC/PC/DEC visualizes the electrolyte reduction potential approximately at 0.5 ~ 0.6V at 18℃ in Fig.
0.0 0.1 0.2 0.3 0.4 0.5 0.6 0.7 0.8
Voltage (V) dI/dE
[image:5.596.187.397.366.659.2]
3a and contributes a dramatic variation of the late and wide reduction potential from 0.23V approaching to 0V while temperature increases to 30℃ in Fig 3b. Contrasted to EC/EMC, the reduced EC only centralizes at 0.55V in Fig. 3c while temperature increases to 30℃. In this observation, EC not only suppresses highly stable and relative pure SEI membrane reduction at higher temperature, but the EMC also facilitates salt dissociation to adequate lithium single ions reinforce organic SEI formation [9]. The current work recommends EC/EMC to predict better battery performance by forming pure composition SEI membrane according to the above results to use within high temperature aging formation.
3.2. Impedance analysis
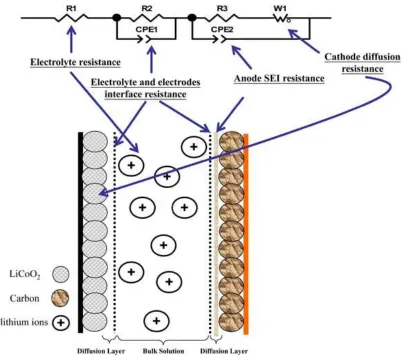
[image:6.596.97.499.360.720.2]The impedance study applies to identify the electrolyte and the temperature interaction effects in the ALB cells. The current research obtains EIS results after charging the cell to 4.2V and discharging to 3V, and constructs an equivalent circuit model in Fig. 4 represents the internal battery construction, which is divided into four items.
The first resistance (R1) represents electrolyte resistance or ionic conductivity; the first RC
circuit represents the electrolyte/electrodes interface resistance, and anode SEI membrane resistance causes the second RC, while the last Warburg element (W1) connects in series to the diffusion
resistance of the electrodes, typically representing the cathode.
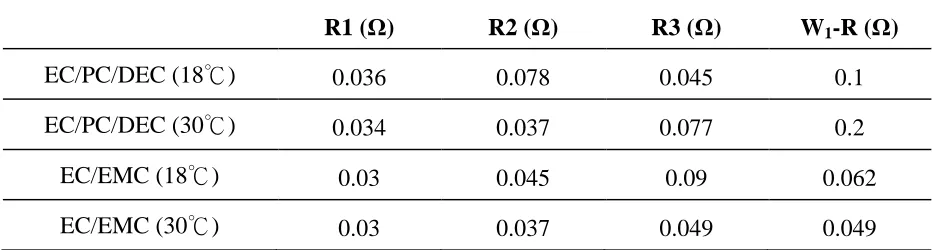
Table 1. Electrode kinetic parameters obtained from equivalent circuit fitting of 503759 cell experimental data with various electrolytes within 18 and 30 0C battery aging-formation
R1 (Ω) R2 (Ω) R3 (Ω) W1-R (Ω)
EC/PC/DEC (18℃) 0.036 0.078 0.045 0.1
EC/PC/DEC (30℃) 0.034 0.037 0.077 0.2
EC/EMC (18℃) 0.03 0.045 0.09 0.062
EC/EMC (30℃) 0.03 0.037 0.049 0.049
According to Table 1, EC/PC/DEC provides a higher R1 resistance than EC/EMC, indicating
the ionic conductivity of EC/EMC is greater than that of EC/PC/DEC. These two R1 also decrease with
the increasing conductivity while temperature rises. According to the ionic conductivity measurement, EC/EMC reveals an excellent value of 9 mS/cm at room temperature while EC/PC/DEC only plays a lower value of 6 mS/cm. R2 resistance indicates that EC/EMC has a lower viscosity dedicated to lower
resistance due to its unmixed cyclic carbonate (EC/PC) system, providing better contact ability and lower activation energy advantageous for ionic transfer. Similar interface resistances resulting from increasing the formation temperature to 30℃ indicates subsequent consistency electrode/electrolyte contact performance at the interface, enhancing the ionic transfer ability for both electrolytes with low viscosity. However, the temperature chemical effect out to the second RC and the Warburg elements are opposite to Rs and R1. The R3 status as a key to define EC/EMC does not furnish much SEI
membrane on the electrode surface and only reveals the interface contact of electrode and the anode. Therefore, R3 resistance of EC/EMC (0.09Ω) is two times larger than EC/PC/DEC (0.045Ω), duo to
SEI membrane has continuity structure on electrode surface to facilitate ionic transfer [14].
However, the R3 status is reversed by restructuring with higher battery formation temperature.
The R3 value of EC/EMC under 30℃ formation promptly decreases to 0.049Ω and the EC/PC/DEC
system suddenly roars to 0.077Ω. The EC/EMC states a pure and simple SEI membrane composition without a complex compound of EC/PC/DEC, like the CV results in Fig 3. Finally, lithium ions migrate through from bulk electrolyte and intercalate into active materials by concentration diffusion. The W1-R represents particle-diffusion resistance, and EC/PC/DEC (0.1Ω) is higher than EC/EMC
[image:7.596.70.536.212.337.2]
possesses simple reduce than EC/PC/DEC according to CV results. Therefore, the resistance is lower. The EC/PC/DEC makes a complex SEI membrane and both on the anode and cathode with high temperature, doubling the resistance. The EC/EMC provides a timely SEI membrane reduction range and forms a relatively simple composition on the electrode similar to R3 results. The EIS is crucial for
battery application while the electrolyte reveals aging effects during battery formation.
3.3. Effects of battery performance
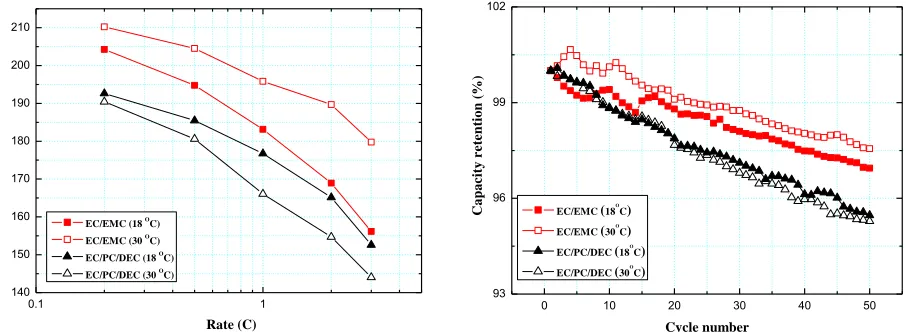
[image:8.596.70.523.273.439.2]The current research investigates ALB cell performance (normal energy density 200 Wh/kg at 0.2C discharge) was used EC/PC/DEC and EC/EMC as the electrolytes.
Figure 5. Batteries perfofmance of a9 C-rate test at charge current 0.2C and discharge current 0.2, 0.5, 1, 2, and 3C, b) cycle test at charge current 1C and discharge current 1C, Nominal energy density 200Wh/kg, constant current voltage 4.2 V. cut-off voltage 3 V.
Figure 5a investigates the battery c-rate performance of two electrolytes. The battery energy density using EC/EMC reaches 194, 183, 168, and 156 Wh/kg at 0.5, 1, 2 and 3C, and the EC/PC/DEC battery reaches 185, 176, 165, and 152 Wh/kg at 0.5, 1, 2, and 3C at 18℃formation because of electrolyte conductivity and viscosity reasons. At 30℃formation, battery performance devotes to temperature influences. Fig. 5a shows that the EC/EMC provides much higher power density than the 18℃and carries out 204, 195, 189, and 179 Wh/kg at 0.5, 1, 2, and 3C. This evidence proves that EC/EMC exactly comprehends above impedance results of SEI membrane resistance and the diffusion property of active materials. However, EC/PC/DEC displays opposite eliminating performance according to the same phenomena of EIS results. The observed drain performance of the EC/EMC with aging-formation effect on Li-ion batteries was excellent, more than that of regular commercialized Li-ion batteries. This is essential not only for enhanced battery capacity, but also for high power density, compared to those without temperature effect and a PC based electrolyte.
0.1 1 140 150 160 170 180 190 200 210 E n e r g y d e n si ty ( W h /k g ) Rate (C)
EC/EMC (18 O
C) EC/EMC (30 O
C) EC/PC/DEC (18 O
C) EC/PC/DEC (30 O
C)
0 10 20 30 40 50
93 96 99 102 C a p a c it y r e te n ti o n ( % ) Cycle number
EC/EMC (18OC)
EC/EMC (30OC)
EC/PC/DEC (18OC)
Several factors cause the cycle ability in the lithium battery to gradually decay, such as decomposed electrolyte, SEI membrane thickness becomes thicker, and electrode irreversibility accumulates after cycles to affect battery performance.
Figure 4b shows the battery cycle performance. The cycling ability of cells with EC/EMC at 30℃formation during 1C discharge for 50 cycles showed superior capacity compared to those systems. This study used the results of aging-formation effects in lithium ion batteries, providing a 2.94% capacity increase and a 2.4% capacity retention increase at 1C/1C cycle, similar to the same evidences from EIS. Interestingly, the EC/PC/DEC batteries at two temperatures formation showed slight variation efficiency after cycling; this status supposes that the SEI membrane after aging-formation within the EC/PC/DEC may provide the same composition except for the thickness, which only affects power density at a high rate discharge more than 2C. Since EC/EMC observation displays sensitive enhancements for energy density and cycling characters, this research investigates the underlying reasons for this observation of aging-formation effects.
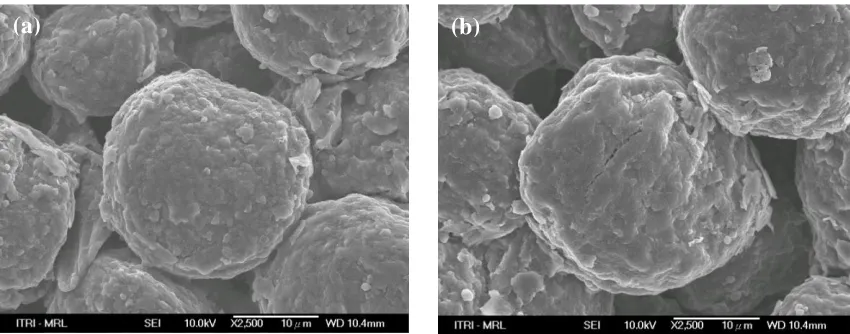
3.4. Morphological and structural analysis of MCMB electrode
According to the solid interface electrolyte (SEI) membrane formation theory, solvent molecules decomposed and intercalated into graphite planes, improving the capacity and stability of the graphite [15], and the membrane formed on the electrode surface during the first charge-discharge cycle [16]. SEI membrane on MCMB electrodes after aging-formation first charged were imaged by using SEM.
Figure 6. SEM micrographs of MCMB surface at 30 0C Battery aging-formation with electrolytes a) EC/PC/DEC and b) EC/EMC used
Figure 6a and b show that the MCMB surfaces with two electrolytes at 30℃formation become an indistinct surface duo to solvent decomposition and lithium ion co-intercalation occur during the first cycle. The PVDF flakes and small conductive carbon of KS-6 pellets were homogenously distributed on the graphite anode. According to these two photographs, the morphology of MCMB is almost the same compared to EC/PC/DEC and EC/EMC. The lack of any strange SEI membrane
[image:9.596.92.517.442.609.2][image:10.596.56.544.192.279.2]
growth means that aging effect did not change the morphology. Zhang et al. [17] developed isocyanate-based electrolyte additives with high reactivity to oxygen groups. The function of oxygen groups is to reduce initial irreversible capacity and increase the cycle-ability of batteries.
Table 2. EDS analysis of MCMB surface with EC/PC/DEC and EC/EMC electrolytes at 30 0C battery aging-formation
Element EC/PC/DEC (atomic %) EC/EMC (atomic %)
C 88.51 84.18
O 6.15 7.79
F 5.34 8.04
Is this the same for SEI membrane composition with aging-formation in the battery? In our case, Table 2 depicts the composition element distribution of Fig. 6 and examines the sensitivity difference between the two electrolytes. The carbon content of the MCMB surface of SEI membrane using EC/PC/DEC is higher and the oxygen and fluorine contents are lower than EC/EMC, suggesting this composition of SEI using EC/EMC within aging-formation decreases impedance and enhances battery performance.
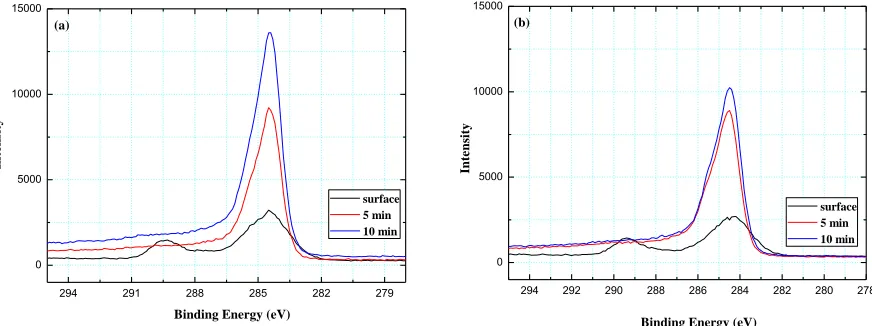
3.5. XPS analysis of solid electrolyte interface
Figure 7 shows the C1s spectra of MCMBs. The peak around 289~291 eV is assigned to carbonate, while the broad peak around 283~286 eV corresponds to a group of superimposed peaks, including that of C-C (graphite) at 284.4 eV, R-CH2OCO2Li at 289, 290-291 eV, Li2CO3 at 290.4 eV,
C-O-C at 286.2 eV, and C-H at 285 eV [18].
Figure 7. XPS C1s spectra of MCMB surface component at 300C battery aging-formation. The data shown in the figure are the depth of sputtering. The electrolytes are a) EC/PC/DEC an b) EC/EMC used
294 291 288 285 282 279
0 5000 10000 15000
In
te
n
si
ty
Binding Energy (eV)
surface 5 min 10 min (a)
294 292 290 288 286 284 282 280 278
0 5000 10000 15000
Binding Energy (eV)
In
te
n
si
ty
[image:10.596.80.516.537.700.2]
Figure 7a shows the plot results of EC/PC/DEC after 30℃formation; strong C1 peaks at 284.4 and 289.6 eV are clearly observed at the surface before Ar+ etching. The weakened peaks at 289.6 and 290.4 eV, corresponding to the carbonate compound in the SEI membrane layer, result from removal of the SEI membrane layer with etching.
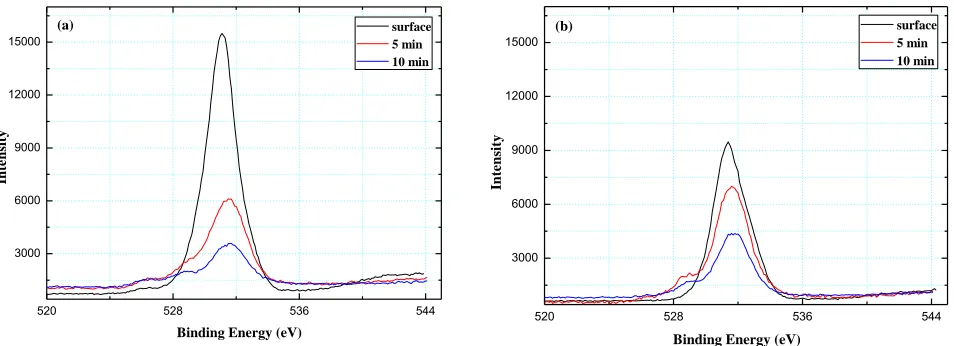
Figure 8. XPS O1s spectra of MCMB surface component at 300C battery aging-formation. the data shown in the figure are the depth of sputtering. The electrolytes are a) EC/PC/DEC an b) EC/EMC used
Figure 9. XPS F1s spectra of MCMB surface component at 300C battery aging-formation. the data shown in the figure are the depth of sputtering. The electrolytes are a) EC/PC/DEC an b) EC/EMC used
This result is very similar to those obtained elsewhere without aging-formation [19]. The C1s data reveals a peak around 285.5-286.56 eV of -C-H- bonding [20-21] from polycarbonate onto graphite before sputtering in Fig. 7. Figure 7b reveals the same SEI membrane structure appearances after 30℃formation with the EC/EMC electrolyte before etching. These spectra in Figs. 7a and b indicate these two electrolytes may have the same SEI membrane composition by XPS measurement.
520 528 536 544
3000 6000 9000 12000 15000
Binding Energy (eV)
In te n si ty surface 5 min 10 min (a)
520 528 536 544
3000 6000 9000 12000 15000 In te n si ty
Binding Energy (eV)
surface 5 min 10 min
(b)
692 690 688 686 684 682 680
3000 6000 9000 In te n si ty
Binding Energy (eV)
surface 5 min 10 min
(a)
692 690 688 686 684 682 680
3000 6000 9000 surface 5 min 10 min In te n si ty
[image:11.596.54.548.400.582.2]
The peak at around 288-292 eV differs markedly between the two spectra. The two electrolytes did not produce thicker SEI membrane and did not exhibit a peak at 290-291 eV after sputtering, while the spectrum obtained clearly reveals Li2CO3 and R-CH2OCO2Li. This evidence proves the above EIS test
results, the EC/PC/DEC and EC/EMC decomposed with the graphite to form SEI membrane, which provides the same thickness. Therefore, after 10 min of etching, the anode surface has no organic species, such as ROCO2Li, CH3OLi or (CH2OCO2Li)2, were detected.
Figure 8 depicts the O1s spectra of the MCMB, wherein the peak at 528.6 eV is assigned to Li2O, and the broad peak between 530 and 534 eV is deconvoluted and may include peaks to C=O at
532.5 eV, C-OH at 533 eV, Li2CO3 at 532 eV, LiOH at 531.9 eV and C-O at 531 eV. Figure 8a
indicates that Li2O formed after 5 and 10 min of etching.
The MCMB surface provides a multi-component lode with an oxygen atom at 529-536 eV in Figs. 8a and b. This associates with aging-formation effects and decomposition of the carbonate on the surface; however, the spectrum of the EC/PC/DEC electrolyte after aging-formation has a highly sensitive peak at approximately 529-535 eV before etching, namely the SEI membrane composition of this electrolyte provides several kinds of compounds according to CV and EIS results. In addition, the EC/PC/DEC electrolyte exhibits a unique O1s spectral peak at 526 eV, the possible compound of which still needs to be defined.
Figures 9a and b present the F1s spectra, where the peak at 686.5 eV can be attributed to LiF, and the peak at 687-688 eV is attributed to LiPF6 and LixPFy, revealing the different SEI membrane
composition of the two electrolytes.
After age formatting the batteries, the LiF peak intensity of EC/PC/DEC exceeds that of the EC/EMC. This evidence mainly supports the claim that CV enhances the salt dissociation of SEI membrane production, and suggests forwarding the SEI membrane composition formed from EC/EMC to the second organic compounds. Although the LiF provides an excellent heat isolate performance for safety, it affects ionic transformation related to battery power performance.
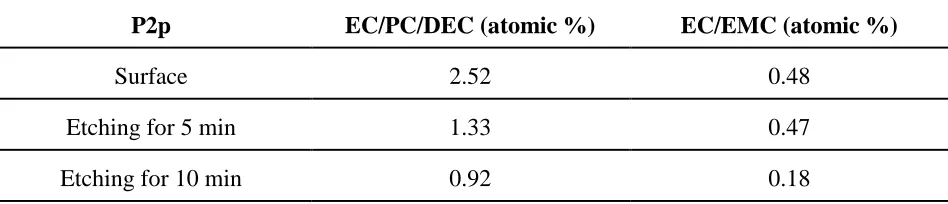
This phenomenon enables a stable SEI membrane combined with electrolytes. In the meantime, the P2p atomic distribution of the MCMB of two electrolytes is arranged to Table 3. The EC/EMC entails less phosphorous compounds owing to the useful SEI membrane in etching research and O1s and F1s results, revealing the SEI membrane layer composition with aging-formation.
Table 3. P2p quantitative analysis of MCMB surface with EC/PC/DEC and EC/EMC electrolytes at 300C battery aging-formation
P2p EC/PC/DEC (atomic %) EC/EMC (atomic %)
Surface 2.52 0.48
Etching for 5 min 1.33 0.47
[image:12.596.62.536.635.737.2]
4. CONCLUSIONS
This research reveals aging-formation effects and SEI membrane composition according to the electrolyte structure, which directs SEI membrane formation, salt dissociation, and the battery performance. This study uses morphology and EIS studies, to draw a tentative conclusion that EC and PC adopting the surface reduction pathway on MCMB makes them behave dramatically different in forming SEI membrane with aging-formation to raise the corresponding reduction products.
ACKNOWLEDGEMENTS
The authors are grateful for financial supporting this research from the National Science Council of Taiwan R.O.C under Grant NSC 99-2218-E-011-008-. The technical assistance of the Materials and Chemical Research Laboratories of the Industrial Technology Research Institute (Taiwan) is appreciated.
References
1. J. Yan, J. Zhang, Y. C. Su, X. G. Zhang, B. J. Xia, Electrochim. Acta, 55 (2010) 1785 2. G. B. Goodenough, Y. Kim, Chem. Mater., 22 (2010) 587
3. L.Q. Mai, Y. Gao, J.G. Guan, B. Hu, L. Xu,W. Jin, Int. J. Electrochem. Sci., 4 (2009) 755 4. K. Xu, J. Electrochem. Soc., 156 (2009) A751
5. S. S. Zhang, J.Power Sources, 162 (2006) 1379
6. X. J. Wang, H. S. Lee, H. Li, X. Q. Yang, X. J. Huang, Electrochem. Comm., 12 (2010) 386 7. F. M. Wang, H. M. Cheng, H. C. Wu, S. Y Chu, C. S. Cheng, C. R Yang, Electrochim. Acta, 54
(2009) 3344
8. I.A. Profatilova, S. S. Kim, N. S. Choi, Electrochim. Acta, 54 (2009) 4445
9. F. M. Wang, D. T. Shieh, J. H. Cheng, C. R. Yang, Solid State Ionics, 180 (2010) 1660 10.J. Zhao, L. Wang, X. He, C. Wan, C, Jiang, Int. J. Electrochem. Sci., 5 (2010) 478
11.M. Broussely, S. Herreyre, P. Biensan, P. Kasztejna, K. Nechev, R. J. Staniewicz, J. Power Sources, 97-98 (2001) 13
12.M. Broussely, Ph. Biensan, F. Bonhomme, Ph. Blanchard, S. Herreyre, K. Nechev, R. J. Staniewicz, J. Power Sources, 146 (2005) 90
13.J. Li, J. Zhang, X. Zhang, C. Yang, N. Xu, B. Xia, Electrochim. Acta, 55 (2010) 927
14.F. M. Wang, C. C. Hu, S. C. Lo, Y. Y. Wang, C. C. Wan, J. Electroanalytical Chem., 644 (2010)
25
15.D. Aurbach, H. Teller, E. Levi, J. Electrochem. Soc., 149 (2002) A1255
16.K. Abe, H. Yoshitake, T. Kitakura, T. Hattcri, H. Wang, M. Yoshio, Electrochim. Acta, 49 (2004) 4613
17.S. S. Zhang, J. Power Sources, 163 (2006) 567
18.M. Lu, H. Cheng, Y. Yang, Electrochim. Acta, 53 (2008) 3539
19.S. Leroy, H. Martinez, R. Dedryve`re, D. Lemordant, D. Gonbeau. Applied Surface Science, 253 (2007) 4895
20.K. Araki, N. Sato, J. Power Sources, 124 (2003) 124
21.S. Leroy, F. Blanchard, R. Dedryve`re, H. Martinez, B. Carre´re, D. Lemordant, D. Gonbeau, Surface Interface Analytical, 37 (2005) 773
![Figure 1. the two-electron pathways mechanism of making up SEI. [5]](https://thumb-us.123doks.com/thumbv2/123dok_us/1934379.153110/2.596.62.538.339.466/figure-electron-pathways-mechanism-making-sei.webp)