This is a repository copy of Information-theoretic active contour model for microscopy image segmentation using texture.
White Rose Research Online URL for this paper: http://eprints.whiterose.ac.uk/124991/
Version: Accepted Version
Proceedings Paper:
Biga, V. and Coca, D. orcid.org/0000-0003-2878-2422 (2017) Information-theoretic active contour model for microscopy image segmentation using texture. In: Bracciali, A.,
Caravagna, G., Gilbert, D. and Tagliaferri, R., (eds.) Computational Intelligence Methods for Bioinformatics and Biostatistics. 13th International Meeting, CIBB 2016, 01-03 Sep 2016, Stirling, UK. Lecture Notes in Computer Science, 10477 . Springer, Cham , pp. 12-26. ISBN 9783319678337
https://doi.org/10.1007/978-3-319-67834-4_2
[email protected] https://eprints.whiterose.ac.uk/ Reuse
Unless indicated otherwise, fulltext items are protected by copyright with all rights reserved. The copyright exception in section 29 of the Copyright, Designs and Patents Act 1988 allows the making of a single copy solely for the purpose of non-commercial research or private study within the limits of fair dealing. The publisher or other rights-holder may allow further reproduction and re-use of this version - refer to the White Rose Research Online record for this item. Where records identify the publisher as the copyright holder, users can verify any specific terms of use on the publisher’s website.
Takedown
If you consider content in White Rose Research Online to be in breach of UK law, please notify us by
INFORMATION-THEORETIC ACTIVE CONTOUR MODEL
FOR MICROSCOPY IMAGE SEGMENTATION USING
TEXTURE
Veronica Biga(1,2), Daniel Coca(2)
(1)The University of Manchester, Faculty of Life Sciences, Oxford Road M13 9PL, [email protected] (2)The University of Sheffield, Automatic Control and Systems Engineering Department, Mappin Street S1 3JD, [email protected]
Keywords: image segmentation, geometric active contour, feature selection, Cauchy-Schwartz distance, Gabor energy
Abstract. High throughput technologies have increased the need for automated im-age analysis in a wide variety of microscopy techniques. Geometric active contour models provide a solution to automated image segmentation by incorporating statistical information in the detection of object boundaries. Information theoretic measures such as entropy and Kullback-Leibler divergence involve numerical evaluation of ratio-type quantities susceptible to numerical instability, however product-type information theo-retic measures, such as the Cauchy-Schwartz distance performing better when the size of the feature space shrinks [1]. Using accurate shape derivation techniques [2], a new geometric active contour model for image segmentation is defined combining Cauchy-Schwartz distance and Gabor energy texture filters. The performance is demonstrated on images from the Brodatz dataset and phase-contrast microscopy images of human embryonic carcinoma cells.
1 Scientific Background
Due to high throughput technology, a great influx of imaging data has become avail-able in biomedical research producing large datasets that need to be processed in a reliable and unbiased way. As a result, there is an increased need for computer au-tomation throughout the imaging framework [3]. Existing work is focused either on pre-processing the image to remove artifacts and enhance signal-to-noise ratio [4]; or using local intensity and/or texture information to delineate the cell surface from the background [5]. The latter cattegory is non technology-specific and coupled with the ability to estimate parameters from data has the potential to unify different detection techniques [6].
Image segmentation is the task of partitioning an image into meaningful regions such as objects and the background. Region-based segmentation takes into account the statistical properties of the image for example through density estimation techniques. The aim of unsupervised segmentation is to partition the image into regions with most distinct statistical properties. Often the target regions are not easily characterized by Gaussian-distributed pixel intensities making the detection by standard image analy-sis techniques (thresholding, edge-detection, region-based and connectivity preserving techniques) extremely challenging. This is the case in phase-contrast microscopy which is a widely used imaging technology, however images produced have low signal-to-noise ratio and illumination artifacts (bright halo around boundaries) caused by changes in object shape [4].
Proceedings of CIBB 2016
Kullback-Leibler [8] and Renyi’s entropy in the approximation of region-specific distri-butions. By combining information theory with Gabor energy texture descriptors and a supervised feature selection strategy, an automated segmentation strategy is described that can recover boundaries in test images and challenging phase-contrast microscopy examples.
2 Materials and Methods
The partitioning of imageΩ0 into two non-overlapping regions: the targetregionΩ
and the background region Ω0 \Ωis defined by function f : Ω0 ⊂ R2 → Rn,f(x) = [f1(x), f2(x), ..., fn(x)]T which associates any image location x = (x, y) ∈ R2 to a vector of featuresfi. The dimension of the feature space is determined by the nature of features,e.g. n=1 for grayscale intensity, n=3 for color images or large n in the case of texture. Features observed over the target and background regions represent random variables independently sampled from a target distribution,pt(f(x)) = ||Ω1||
R
ΩK(f(x)−
f(ˆx))dxˆand a background distribution,pb(f(x)) = ||Ω01\Ω||
R
Ω0\ΩK(f(x)−f(ˆx))dˆxwhere ˆ
xdenote uniformly distributed sampling locations from where the feature observations
f(ˆx)are collected and the density estimation kernel is a Gaussian:
K(f(x)) = 1
(2π)n/2det(Σ)1/2exp
−1 2f(x)
T
Σ−1f(x)
,Σ =σ2I . (1)
In the following, the use of the Cauchy-Schwartz (CS) information-theoretic measure is discussed as basis for defining a new image segmentation model. The assumption is that given a partitioning of the image, region-specific pt and pb can be optimally estimated by modifying the partitioning in the direction of maximising CS distance:
DCS(pt(f(x)), pb(f(x))) = −log
R
Rnpt(f(x))pb(f(x))df
q R
Rnp2b(f(x))df
R
Rnp2t(f(x))df
≥0 . (2)
Geometric active contour model based on information theory. The active con-tour partitioning of the image is represented using a level set function Φ(x) ≥ 0,x ∈ Ω; Φ(x)≤0,x∈Ω0\Ω; Φ(x) = 0,x∈∂Ω. The region-based geometric active contour
model based on CS distance is defined as:
J(Φ) = Z
Rn
pt(f(x))pb(f(x))
q R
Rnp2t(f(x))df
R
Rnp2b(f(x))df df+µ
Z
∂Ω
ds =J1(Φ) +J2(Φ) (3)
whereJ1(Φ) represents the argument of the logarithm in (2) and J2(Φ) imposes
min-imum length of the contour. The evolution of Φ(f(x), t) from an initial given state
Φ(f(x),0) = Φ0(f(x))in the direction of minimising (3) is parametrised byt≥0. The term J1(Φ) =
R
Rnk(x,Ω)df is described as a based term with
region-dependent descriptork(x,Ω) =G1(x,Ω)G2(x,Ω)G3(x,Ω)−1/2G4(x,Ω)−1/2in the sense of shape derivation theory [10], whereby:
G1(x,Ω) =pt(f(x)); G3(x,Ω) =
Z
Rn
p2t(f(x))df; (4)
G2(x,Ω) =pb(f(x)); G4(x,Ω) =
Z
Rn
p2b(f(x))df;
Therefore, the Euler derivative ofJ1 in the direction ofvis:
dJ1r(Ω,v) = −
A(x,Ω) ||Ω||
Z
∂Ω
1− G1(x,Ω)
G3(x,Ω)
G2(x,Ω)∗K(f(x)) (v·n)ds+ (5)
+ A(x,Ω) ||Ω0\Ω||
Z
∂Ω
1−G2(x,Ω)
G4(x,Ω)
whereA(x,Ω) =G−31/2(x,Ω)G−41/2(x,Ω)and the operator∗denotes convolution. The termJ2(Φ)is a boundary-based term with boundary-independent descriptor, there-foredJ2r(Ω,v) = −
R
∂Ωµκ(v·n)ds. The evolution equation for the geometric active
contour becomes:
∂Φ
∂t =
hA(x,Ω) ||Ω||
1− G1(x,Ω)
G3(x,Ω)
(G2(x,Ω)∗K(f(x)))− (6)
− A(x,Ω) ||Ω0\Ω||
1− G2(x,Ω)
G4(x,Ω)
(G1(x,Ω)∗K(f(x))) +µdiv
|∇Φ| ||∇Φ||
i
n .
Gabor energy-based texture features. Texture features include spatial information of pixel intensities. Commonly used in image processing is Gabor filtering which de-composes the image into sub-bands with a preferred orientation and spatial frequency by kernel convolution. The use of Gabor energy features sets the basis for a nonlin-ear multi-scale method of describing texture that resembles the way information is interpreted in the visual cortex, [9]. A 2D Gabor filter centred in (x0, y0) is x′ = (x−x0) cosθ+ (y−y0) sinθ,y′=−(x−x0) sinθ+ (y−y0) cosθ:
gλ,σ,γ,θ,ϕ(x, y) = e−
x′2+γ2y′2 2σ2 cos
2πx′
λ +ϕ
(7)
whereθ ∈ [0π) is the rotation angle of the gaussian envelope andλ andϕ ∈ (−π π]
denote the spatial frequency and phase of the sinusoidal carrier. The Gaussian envelope is characterised by parametersγ, which specifies ellipticity andσ, a scaling parameter which controls the size of the Gaussian. The ratioσ/λcontrols the number of parallel on and off stripes that the kernel contains. This ratio is determined by the bandwidthb,
σ λ = 1 π q ln 2 2 2b+1
2b−1. The response of a Gabor filter (7) applied to an image is:
rλ,σ,γ,θ,ϕ =
Z
Ω
I(u, v)gλ,σ,γ,θ,ϕ(x−u, y−v)dudv . (8)
Gabor energy represents the combined magnitude of two phase-shifted responses:
eλ,σ,γ,θ(x, y) =
q
r2
λ,σ,γ,θ,0(x, y) +rλ,σ,γ,θ,2 −π
2(x, y) .
(9)
Single orientation texture features. Gabor energy feature function can be de-fined by discretising λ = [λmin, λmin + ∆λ, . . .], γ = [γmin, γmin + ∆γ, . . .] and
θ = [θ1, θ2, . . .], θk = kNπ, k = 0, N −1. We consider the case of b = 1. Multiple single featuresf1n,k =eλn,γn,θk(x, y)are ombined into a set:
f1 : Ω0 ∈Rn,f1(x, y) = [f11,0(x, y),f11,1(x, y). . .f1n,N−1(x, y)]T; (10)
Combined orientation texture features. For textures without a preferred spatial orientation, a combined Gabor energy feature representing the superposition of energies
f2n(x, y) = PN
k=1eλn,γn,θk(x, y)for allθ is defined as a feature set:
f2 : Ω0 ∈Rn,f2(x, y) = [f21(x, y), . . .f2n(x, y)]T (11)
Feature selection strategy. At iteration time t = 0, consider a complete set of fea-tures was generated infpool,t = [fpool,t,1(x, y),fpool,t,2(x, y), . . .]. The supervised feature selection strategy involves starting with only one feature in the selected setfsel,0(x, y) =
Proceedings of CIBB 2016
a b
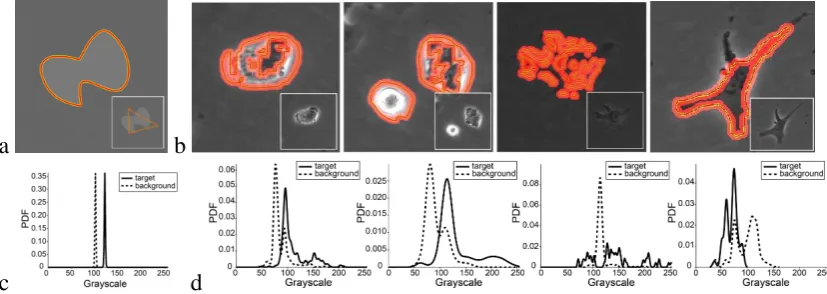
[image:5.595.90.504.61.208.2]c d
Figure 1: Grayscale-intensity based segmentation using CS model: recovered contour in (a) artificial image and (b) phase-contrast microscopy images of cells; corresponding target and background distri-butions at final iteration shown in panels (c) and (d) respectively. Parametersµ = 0.01;w = 15and µ= 0.2;w= 5in (a) and (b) respectively.
minimisation of CS0(pt, pb) evaluated according to a three stepOptimisation: (i) for the feature setF, find optimal bandwidthσt;(ii) for the partitioningΦ = Φt and given
F,σtestimatept, pb; (iii) usingpt, pbupdateCSu(pt, pb).
Step 1. forF=fsel,t, calculateCSu(pt, pb)withOptimisation;Step 2. increase iter-ation countt =t+1;Step 3. from all remaining features infpool,t−1consider the
tempo-rary selectionftemp,t = [fsel,tfpool,t,k,∀k]and calculate for eachkthe value ofCSu(pt, pb) whenF = ftemp,t withOptimisation;Step 4. choosefpool,t,k that generates the largest decrease in the criterion and generate newfsel,t = [fsel,t,fpool,t,k]Step 5. return toStep
1. The feature selection strategy terminates forCSt(pt, pb)<0.1CS0(pt, pb).
Numerical implementation. The level set function Φ is initialised as a signed dis-tance function and the pixels in the narrow-band region around the contour are updated followed by reinitialisation of the distance function to prevent numerical errors.The op-timal variance in each dimension is computed with Scott’s ruleσ2
X = n1
Pn
i=1σ2ii;σ⋆ =
σXmn+41 . The Parzen density estimation kernel isK
σ⋆(z) = √1
2πσ⋆exp
−2zT zσ⋆2.The time
step is limited to ∆t = 0.45(2max(h|Fu|) + 2µh + 2hµ2)−1.The main parameters reported
are stiffnessµ∈[0,1]and width of the narrow bandw.
3 Results
Segmentation of phase-contrast images based on grayscale intensity only par-tially recovers boundaries.The CS-based geometric active contour was evaluated on a test image and real microscopy images of cells acquired with a phase-contrast mi-croscope (Figure1). Boundaries of the test image were recovered despite similar mean intensity of target and background. However, the microscopy images contain target re-gions with significant overlap to the background and boundaries are only partly recov-ered. Further halo artifacts and the inclusion of dark and bright objects raise the biggest problems resembling thresholding techniques. These examples indicate that microscopy images cannot be segmented using grayscale intensity alone and further information is hidden in the texture characteristics of both regions.
Gabor features enable detection of noisy object boundaries in textured images. To investigate the ability to recover boundaries using Gabor texture features, test images were generated by fusing samples from the Brodatz 1 dataset (Figure 2). The fused textures have similar mean intensity and noisy illumination which resemble properties of microscopy images. A single orientation feature space was generated using b = 1,
c d
Figure 2: Brodatz texture segmentation examples in images generated as fusion of two textures: (a,b) active contours evolving from initialisation (top) towards final iteration (bottom) and corresponding shape of target and background distributions for the three dominant features from optimal sets showed in (c) and (d) respectively. Parametersµ= 0.2, w= 15.
λ = [1/15, 1/30, 1/60, 1/120, 1/240],γ = [0.2, 0.4, 0.6, 0.8, 1]; this was reduced to an optimal feature set using the CS-based feature selection strategy and the active contour was able to succesfully recover the boundaries despite thetarget and background distributions retaining overlap. The number of selected features is larger in the example (Figure 2b) compared to (Figure 2a) and the selected features are similar highlighting that a sparse feature set improves convergence speed at no cost to the final result.
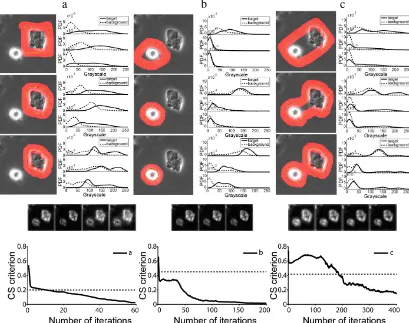
Cauchy-Schwartz model detects cells in phase-contrast images using Gabor fea-tures. The performance of the geometric active contour and feature selection strategy were tested on real microscopy images displaying cells with bright and dark cell interior (Figure 3). The texture of cells has no preffered orientation, therefore the feature space was combined from features at 8 different orientations followed by reduction to an op-timal feature set. The active contour was tested on the dark and bright cell on their own and finally on both. In all cases boundaries were correctly detected using few features. As expected, initial CS level exceeds the threshold indicated by the feature selections trategy but falls under at large iteration numbers (Figure 3). The CS trends indicate that the boundaries of the dark cell are detected fastest (Figure 3a) while the combined bright and dark cell segmentation is the slowest (Figure 3c).
4 Conclusions
Proceedings of CIBB 2016
[image:7.595.94.503.53.376.2]a b c
Figure 3: Selective segmentation of cells in phase-contrast microscopy image using texture: (a-c) active contours evolving from initialisation (panel top) towards final interation (panel bottom) applied to a cell with (a) dark, (b) bright and (c) combined grayscale intensity; optimal feature sets and CS values cor-responding to (a-c); dashed line indicates optimal values of criterion predicted by the feature selection strategy. Parametersµ= 0.2;w= 15
Acknowledgments
This work was funded by a doctoral research scholarship from The University of Sheffield. Authors kindly thank members of the PW Andrews Laboratory at Centre for Stem Cell Biology for providing the microscopy images of cells.
References
[1] E. Gokcay, J.C.Principe. ”Information theoretic clustering”.IEEE Trans Pattern Anal Mach Intell, vol. 24, no. 2, pp. 158-171, 2002.
[2] S. Jehan-Besson, M. Barlaud, G. Aubert. ”Video object segmentation using Eulerian region-based active contours”.Intl Conf Comp Vis, pp. 353-361, 2001.
[3] K.W. Eliceiri, M.R. Berthold, I.G. Goldberg et al. ”Biological imaging software tools”.Nat Meth, vol. 9, no. 7, pp. 697-710, 2012.
[4] Z. Yin, T. Kanade, D. Xu, J. Fisher. ”Understanding the phase contrast optics to restore artifact-free microscopy images for segmentation”.Med Image Anal, vol. 16, no. 5, pp. 1047-1062, 2012. [5] M.A. Dewan, M. O. Ahmad, M.N. Swamy. ”A method for automatic segmentation of nuclei in
phase-contrast images based on intensity, convexitty and texture”.IEEE Trans Biomed Circ Syst, vol. 8, no. 5, pp. 716-728, 2014.
[6] C. Held, R. Palmisano, L. Haberle et al. ”Comparison of parameter-adapted segmentation methods for fluorescence micrographs”.Cytom Part A, vol. 79, no. 11, pp. 933-945, 2011.
[7] O.V. Michailovich, Y. Rathi, A. Tannenbaum. ”Image segmentation using active contours driven by the Battacharya gradient flow”.IEEE Trans on Image Proc, vol. 16, no. 11, pp. 2787-2801, 2007. [8] N. Houhou, J.P. Thiran, X. Bresson. ”Fast texture segmentation model based on the shape operator
and active contour”.Proceedings of IEEE Comp Vis and Pattern Recog, vol. 53, pp. 1-8, 2008. [9] N. Petkov, P. Kruizinga. ”Computational models of visual neurons specialised in the detection of
periodic and aperiodic visual stimuli: Bar and grating cells”.Biol Cybern, vol. 76, no. 2, pp. 83-96, 1997.