R E S E A R C H A R T I C L E
Open Access
The effect of modifiable risk factors on
geographic mortality differentials: a modelling
study
Christopher E Stevenson
1*, Haider Mannan
1, Anna Peeters
1, Helen Walls
1, Dianna J Magliano
2, Jonathan E Shaw
2and John J McNeil
1Abstract
Background:Australian mortality rates are higher in regional and remote areas than in major cities. The degree to which this is driven by variation in modifiable risk factors is unknown.
Methods:We applied a risk prediction equation incorporating smoking, cholesterol and blood pressure to a national, population based survey to project all-causes mortality risk by geographic region. We then modelled life expectancies at different levels of mortality risk by geographic region using a risk percentiles model. Finally we set high values of each risk factor to a target level and modelled the subsequent shift in the population to lower levels of mortality risk and longer life expectancy.
Results:Survival is poorer in both Inner Regional and Outer Regional/Remote areas compared to Major Cities for men and women at both high and low levels of predicted mortality risk. For men smoking, high cholesterol and high systolic blood pressure were each associated with the mortality difference between Major Cities and Outer Regional/Remote areas–accounting for 21.4%, 20.3% and 7.7% of the difference respectively. For women smoking and high cholesterol accounted for 29.4% and 24.0% of the difference respectively but high blood pressure did not contribute to the observed mortality differences. The three risk factors taken together accounted for 45.4% (men) and 35.6% (women) of the mortality difference. The contribution of risk factors to the corresponding differences for inner regional areas was smaller, with only high cholesterol and smoking contributing to the difference in men– accounting for 8.8% and 6.3% respectively– and only smoking contributing to the difference in women– accounting for 12.3%.
Conclusions:These results suggest that health intervention programs aimed at smoking, blood pressure and total cholesterol could have a substantial impact on mortality inequities for Outer Regional/Remote areas.
Background
Mortality rates in Australia are higher in rural and remote areas than major cities. In 2002-04, death rates for males in Inner Regional, Outer Regional, Remote and Very Remote areas were significantly higher than their counterparts in Major Cities, with standardised mortality ratios (SMR) of 1.1, 1.2, 1.2 and 1.7 respec-tively. Females in these areas also had significantly higher death rates, with SMRs of 1.1, 1.1, 1.2 and 1.7
respectively [1]. This could be due to a range of influ-ences including lower socioeconomic status, poorer risk factor profiles, differential access to health services and the high proportion of Indigenous people in these areas [1-3]. Research in other countries has shown that the drivers of geographic variation in mortality include soci-etal and economic factors but that individual health risk factors play a significant role [4-7].
The Australian Human Rights Commission identified rural health inequities as a substantial human rights issue for Australia [8]. Reduction of risk factor preva-lence across regions may be one way to address these inequities, but the potential of this approach is * Correspondence: [email protected]
1
School of Public Health and Preventive Medicine, Monash University, The Alfred Centre, 99 Commercial Road, Melbourne, Victoria, Australia Full list of author information is available at the end of the article
unknown. Here we examine the extent to which varia-tion in life expectancy between Australian geographic regions is associated with variations in selected modifi-able risk factors. We adapt a previously developed cor-onary heart disease model developed for the Australian population to analyse the potential impact of changing the prevalence of smoking, high cholesterol and high blood pressure on life expectancy in the Major City, Inner Regional and combined Outer Regional/Remote regions in Australia [9].
Methods
We used a mortality risk prediction equation applied to a national population survey to model percentiles of short-term mortality risk by geographic region. We then modelled survival curves and associated life expectancies for each percentile of risk. Finally we modelled the effect of each risk factor by setting high values of that factor to a‘target’level and modelling the subsequent popula-tion shift to lower percentiles of mortality risk and asso-ciated longer life expectancy.
Geographic regions
This study used the Australian Standard Geographical Classification (ASGC), which groups geographic areas into five regions–defined using an index of the remote-ness of a location from the services provided by large towns or cities. The regions are Major City, Inner Regional, Outer Regional, Remote and Very Remote [10]. The Major City region contains urban centres with a population greater than 250,000. Conversely the Very Remote region is defined to contain the most remote one per cent of the population while the Remote and Very Remote regions together contain the most remote three per cent of the population. According to the 2001 Australian population census, the Inner Regional regions together contained 3,872,693 people, the Outer Regional regions together contained 1,978,495 people, the Remote regions together contained 334,683 people and the Very Remote regions together contained 201,120 people [1].
Our study used three regions–Major City, Inner Regional and a combined Outer Regional/Remote group.
Data sources
The AusDiab study
Our national population survey was the baseline survey of the Australian Diabetes, Obesity and Lifestyle (Aus-Diab) study [11]. This was a cross-sectional, national, population-based survey of 11,247 adults aged ≥ 25 years in 1999-2000, comprising a household interview and biomedical examination at a testing site. Among the information collected was seated systolic and diastolic blood pressure; self-reported cigarette smoking status; and serum total cholesterol. Of the 11,247 survey
participants 8,706 were aged 40 or over. Of these 8,534 had complete data for systolic and diastolic blood pres-sure; self-reported cigarette smoking status; and serum total cholesterol–3,880 male and 4,654 female.
Because of small numbers we grouped the oldest Aus-Diab participants into one group aged 75 years and over. The percentile scores for this group were taken to apply equally to the age groups 75-79, 80-84 and 85 years and over.
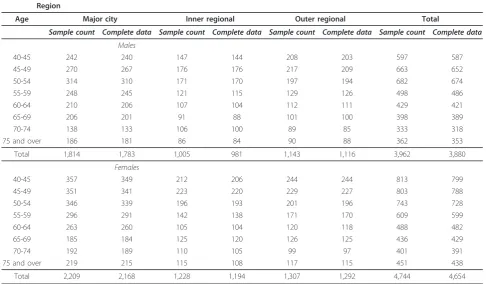
The number of AusDiab participants in Major Cities, Inner and Outer Regional and Remote areas aged 40 and over and the number with complete risk factor data for systolic and diastolic blood pressure; self-reported cigarette smoking status; and serum total cholesterol are given in Table 1. There were no AusDiab collection tres in Very Remote areas and only one collection cen-tre in a Remote area, so we excluded Very Remote areas and combined the Outer Regional and Remote areas. National population and death counts
National population and death counts classified by age, sex and geographic region for 2001 - 2006 were supplied by the Australian Institute of Health and Welfare (AIHW). The population counts were derived from the Australian Bureau of Statistics (ABS) mid-year popula-tion estimates. Deaths data were derived from the AIHW National Mortality Database comprising all deaths registered in Australia.
Availability of data
The AusDiab confidentialised unit record data are avail-able for serious scientific research proposals that are consistent with the overall AusDiab program of research activities; that do not conflict with work in progress; and where the interests and personal privacy of survey subjects are protected and Institutional Ethics Commit-tee approval has been given for the proposed research. Access to the data is decided by the AusDiab Scientific Research Committee on the basis of a written application.
National population and death counts classified by age and sex are freely available from the AIHW web-site. However, data with more detailed classifications, such as the regional classifications used here, are available on written application from a researcher provided they are aggregated to levels where there is no potential for iden-tification of data for individuals. Where such specific tabulations are requested, the AIHW charges a fee based on full-cost recovery for any programming and other costs associated with the planning, extraction and provision of the data.
Risk prediction equation
factors. We used an index developed by the SCORE (Systematic COronary Risk Evaluation) project [12]. This project assembled a pooled dataset of cohort stu-dies from 12 European countries and derived a risk pre-diction equation for risk of death from cardiovascular disease. The pooled data set comprised 88,080 women and 117,098 men and the risk was predicted for ages 45 - 64. The equation was calculated separately for men and women and incorporated age as the basis of the hazard function. The variables in this equation are: smoking status, total cholesterol and systolic blood pres-sure (SBP).
To assess the suitability of the SCORE statistic as a proxy for short-term all-cause mortality risk for our study we followed a similar method to Aktas et al [13]. The baseline AusDiab sample has been followed up for subsequent death via a regular linking with Australian death registry data, commencing with a follow-up to 2004 and then followed up annually with the most recent linkage being for 2008 [14]. We predicted the risk of death using a Cox proportional hazards regres-sion equation with the SCORE statistic as a predictor variable and death from any cause up to 1 June 2004 as the outcome variable. Follow-up to 2004 was chosen rather than follow-up to 2008 because the model uses the SCORE statistic to allocate short-term mortality.
The model was fitted separately for men and women and included age categorised into five year age groups as a covariate. SCORE was originally derived to predict risk at ages 45 - 64, but our study applies to ages 40 and over. So we fitted the Cox regression to ages 40 and over to demonstrate SCORE’s overall ability to predict all cause mortality risk and we fitted a separate regres-sion to ages 65 and over to demonstrate its predictive ability at older ages. We used the adjusted Hosmer-Lemeshow goodness of fit statistic and the Harrell’s C statistic to assess the regression equations’fit and pre-dictive ability [15,16].
The risk percentiles model
A summary of the modelling methods is presented here. A detailed description of these methods is included in the additional file 1: appendix.
[image:3.595.55.542.112.396.2]The risk percentiles model was used to derive an aver-age life expectancy at each percentile of projected mor-tality risk based on the SCORE equation. The Australian disease burden associated with the modifiable risk fac-tors incorporated in our risk prediction equation is very small below age 40, so our modelling was applied to ages 40 and over [17]. The steps involved in the calcula-tion, within each age, sex and regional group, are as fol-lows [9]:
Table 1 AusDiab sample counts and number with complete data for blood pressure; self-reported cigarette smoking status; and serum total cholesterol in each region for respondents aged 40 and over by age and sex
Region
Age Major city Inner regional Outer regional Total
Sample count Complete data Sample count Complete data Sample count Complete data Sample count Complete data Males
40-45 242 240 147 144 208 203 597 587
45-49 270 267 176 176 217 209 663 652
50-54 314 310 171 170 197 194 682 674
55-59 248 245 121 115 129 126 498 486
60-64 210 206 107 104 112 111 429 421
65-69 206 201 91 88 101 100 398 389
70-74 138 133 106 100 89 85 333 318
75 and over 186 181 86 84 90 88 362 353
Total 1,814 1,783 1,005 981 1,143 1,116 3,962 3,880
Females
40-45 357 349 212 206 244 244 813 799
45-49 351 341 223 220 229 227 803 788
50-54 346 339 196 193 201 196 743 728
55-59 296 291 142 138 171 170 609 599
60-64 263 260 105 104 120 118 488 482
65-69 185 184 125 120 126 125 436 429
70-74 192 189 110 105 99 97 401 391
75 and over 219 215 115 108 117 115 451 438
1. Divide the Australian population into mortality risk percentiles.
The SCORE equation was applied to the AusDiab data to calculate the five-year probability of death for each individual in the survey (theirrisk score). Survey weights were applied to the survey sample so that the data could be taken as estimates for the total Australian population and the values of the risk score that divide the weighted sample into percentiles were then calculated. Each sur-vey participant was allocated to a risk percentile using their risk score and a total risk score for all participants calculated for each percentile.
2. Allocate deaths to risk percentiles.
The national count of deaths summed across 2001 -2006 was allocated to the risk percentiles using the ratios of the aggregate risk score between percentiles. For example, if one percentile group had a total risk score twice that of another group then the deaths were allocated between them in the ratio 2 - 1. When divided by the population count summed across 2001 - 2006 (assumed evenly spread between risk percentiles) this gives us the death rate for each risk percentile group.
3. Use these mortality rates to construct sex-specific life tables and survival curves for each risk percentile within each regional group.
After step 2, we had a set of age specific mortality rates by sex for each percentile group within each region. We applied standard life table techniques [18] using these mortality rates to construct a sex-specific life table for each percentile group within each region. We used these life tables to generate sex-specific survi-val curves and life expectancies for each percentile group within each region.
Modelling the effect of risk factors on inter-regional mortality differentials
The effect of risk factors on inter-regional mortality dif-ferentials was modelled for the 2006 Australian popula-tion. For each age-sex-region group, the modelled life expectancy at each percentile of projected mortality risk as derived above was multiplied by the corresponding 2006 population count to obtain the projected total life years for each group. This was summed over the per-centiles and ages within each region and divided by the regional population count to calculate abaseline average potential years of life (APYL) per personfor each region.
The risk factors modelled in this paper were those in the SCORE equation which are potentially modifiable– smoking, total cholesterol and systolic blood pressure [12]. We returned to the AusDiab survey data to model the effect of setting high values of each risk factor sepa-rately to a ‘target’ value. For example, in examining blood pressure each survey participant with a SBP greater than or equal to 140 mmHg had his/her risk
score recalculated assuming a SBP of 120–creating a synthetic sample of people with SBP below high risk levels. The participants were reallocated to the risk per-centiles using the existing risk score cut offs with their revised risk score values. This, when weighted using the AusDiab survey weights, provided a modelled estimate of the shift in the total Australian population between each percentile group under this scenario. Note that this does not imply that any practical intervention would be capable of reducing blood pressure to a target level for all people with high blood pressure. The aim of the model is to investigate a theoretical impact of blood pressure reduction by comparing the mortality out-comes associated with the current population with those projected for a population where no one has a blood pressure above the target value.
We multiplied the existing average life expectancy for each percentile-age-sex-region group by the new popu-lation count projected to be in that group under each scenario. This was summed over the percentiles and ages within each region and divided by the regional population count to calculate ascenario average poten-tial years of life per personfor each region.
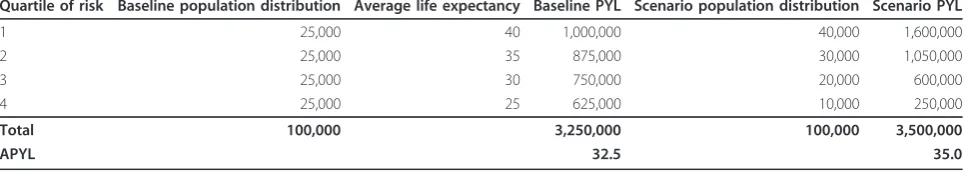
This procedure is illustrated in Table 2 with a hypothetical population of 100,000 people divided into risk quartiles (not percentiles) for ease of presentation. Column 2 presents the number of people in each quar-tile at baseline and column 3 is the average life expec-tancy from our model for each quartile. Column 4 presents the baseline lifeyears estimate, which is calcu-lated by multiplying column 2 by column 3. If we sum column 4 and divide this by the total population, we get the baseline APYL per person (32.5 years). Column 5 presents the number of people allocated to each quartile after the survey participants have had their risk adjusted as described above. Column 6 represents the scenario lifeyears estimate and is calculated by multiplying col-umn 3 by colcol-umn 5. If we sum colcol-umn 6 and divide this by the total population, we get the scenario APYL per person (35.0 years).
The high risk values for SBP and total cholesterol were 140 mmHg and 5.5 mmol/l respectively [19]. The target values for SBP and total cholesterol were the tar-get levels published by the Australian National Heart Foundation (NHF)–120 mmHg and 4 mmol/l respec-tively [20,21]. For smoking the‘target’was taken as the absence of smoking, so the risk equations were recalcu-lated with current smokers changed to non-smokers. The population prevalence of each risk factor above its target level was estimated by calculating the correspond-ing proportion from the AusDiab survey weighted uscorrespond-ing the survey weights.
were age-standardised using the Major City population as the standard population. This allowed direct compari-sons between geographic regions.
Calculations of the proportions of risk and of people in each percentile group were based on relatively small numbers in some region, age, and sex groups leading to excessive variability in the resulting proportions. Thus, we applied a LOESS non-parametric smoothing proce-dure to the proportions [22]. We used bootstrapping to construct confidence intervals for all estimates presented in this paper with the exception of those arising from the Cox proportion hazards regression models, where standard errors and confidence intervals were generated by the regression modelling procedure [23]. The model-ling, smoothing and regression calculations were con-ducted using SAS statistical software (SAS version 9.1.3. SAS Institute Inc.).
Results
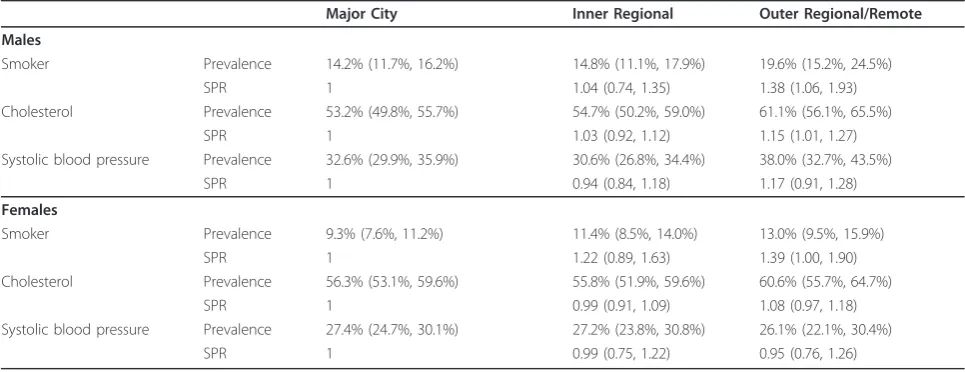
Risk factor prevalence
Table 3 gives the estimated age-standardised proportion of people with high risk factor value in the Australian population by geographic region, and the standardised prevalence ratio (SPR) between Major Cities and each other region.
The highest proportion was for cholesterol, with more than 50% of the population having a high cholesterol value for both sexes in each region–ranging from 53.2% (95%CI: 50.2%- 56.4%) in men in Major Cities to 61.1% (95%CI: 55.7%-66.1%) also in men but in the combined Outer Regional/Remote region.
For men, the prevalence of smoking and high choles-terol rose between Major Cities and Inner Regional areas and rose even further in Outer Regional/Remote areas, though the confidence intervals suggest that the differences were only statistically significant in the Outer Regional/Remote areas. The SPR values for cho-lesterol between Major Cities and Inner Regional and Outer Regional/Remote Areas were 1.03 (95%CI: 0.92-1.12) and 1.15 (95%CI: 1.01-1.27) respectively. The cor-responding SPR values for smoking were 1.04 (95%CI: 0.80-1.37) and 1.38 (95%CI: 1.06-1.83). The prevalence of high SBP fell between Major Cities and Inner Regio-nal areas but rose again in Outer RegioRegio-nal/Remote
areas. However the SPR values all had confidence inter-vals containing 1–suggesting that none of the differ-ences was statistically significant.
For women, the prevalence of smoking showed a simi-lar pattern to that for men with SPR values of 1.22 (95% CI: 0.92-1.67) and 1.39 (95%CI: 1.00-1.90). The preva-lence of high cholesterol fell between Major Cities and Inner Regional areas but rose again in Outer Regional/ Remote areas. The prevalence of high SBP fell between Major Cities and Inner Regional areas and remained low in Outer Regional/Remote areas. The SPR values for both cholesterol and SBP had confidence intervals con-taining 1–suggesting that none of the differences was statistically significant.
The SCORE equation as a predictor of all causes mortality
There were 246 deaths prior to 1 June 2004 among the 8,534 survey participants included in our modelling–154 men and 92 women. Of those participants aged 65 and over, there were 191 deaths–116 men and 75 women.
The results of fitting the Cox proportional hazards regression model to predict all-cause mortality using the SCORE index as a predictor variable are given in Tables 4, 5, 6 and 7. The SCORE index is a strongly significant predictor of mortality for ages 40 and over for both men and women (p = 0.012 for men and p = 0.0037 for women). The adjusted Hosmer-Lemeshow goodness of fit statistic shows no evidence of lack of fit in either equa-tion (c2value 6.58, p = 0.68 for men andc2value 9.37, p = 0.40 for women) and the C statistics show good predic-tive power with values of 83% for men and 84% for women–C values above 80% are generally regarded as demonstrating excellent predictive power [24].
The SCORE index is still a strong predictor of mortal-ity when the regression is restricted to ages 65 and over (p = 0.018 for men and p = 0.0036 for women). The adjusted Hosmer-Lemeshow goodness of fit statistic shows no evidence of lack of fit in either equation (c2 value 12.00, p = 0.21 for men andc2 value 16.11, p = 0.06 for women) and the C statistics show reasonable predictive power with values of 67% for men and 71% for women.
[image:5.595.57.541.104.190.2]A similar analysis with follow-up of death to 2008 was also done to test the sensitivity of the conclusions to the
Table 2 Modelling the impact of a risk factor illustrated with a hypothetical population
Quartile of risk Baseline population distribution Average life expectancy Baseline PYL Scenario population distribution Scenario PYL
1 25,000 40 1,000,000 40,000 1,600,000
2 25,000 35 875,000 30,000 1,050,000
3 25,000 30 750,000 20,000 600,000
4 25,000 25 625,000 10,000 250,000
Total 100,000 3,250,000 100,000 3,500,000
choice of follow-up date (results not shown). The SCORE statistic also performed well as a predictor of all-cause mortality with this follow-up date.
Modelled regional life expectancy
The survival curves and associated life expectancies were calculated separately for each age-sex-region-percentile group. However, for ease of presentation, we have illu-strated the results of this modelling by presenting them at age 40 for the highest and lowest deciles of projected mortality risk.
Figures 1 and 2 present the number per 100,000 from the life table surviving at each age over 40 for the lowest and highest deciles of predicted mortality risk by region.
Survival is better for women than men in each region at each risk level. Survival is also better in Major Cities than Outer Regional/Remote areas for men and women at each risk level.
[image:6.595.56.539.100.286.2]Figures 3 and 4 present life expectancies at age 40 years for the lowest and highest deciles of mortality risk in each region. For men in both low and high risk groups, there is a relatively steady fall in life expectancy across the Major City, Inner Regional and Outer Regio-nal/Remote areas. The life expectancy difference between Major Cities and Outer Regional/Remote areas was 3.1 years for the low-risk group (95%CI: -0.9, 5.9) and 2.3 years for the high-risk group (95%CI: 1.8, 2.8) (data not shown).
Table 3 Prevalence of high values of risk factors by geographic region, age standardised
Major City Inner Regional Outer Regional/Remote Males
Smoker Prevalence 14.2% (11.7%, 16.2%) 14.8% (11.1%, 17.9%) 19.6% (15.2%, 24.5%)
SPR 1 1.04 (0.74, 1.35) 1.38 (1.06, 1.93)
Cholesterol Prevalence 53.2% (49.8%, 55.7%) 54.7% (50.2%, 59.0%) 61.1% (56.1%, 65.5%)
SPR 1 1.03 (0.92, 1.12) 1.15 (1.01, 1.27)
Systolic blood pressure Prevalence 32.6% (29.9%, 35.9%) 30.6% (26.8%, 34.4%) 38.0% (32.7%, 43.5%)
SPR 1 0.94 (0.84, 1.18) 1.17 (0.91, 1.28)
Females
Smoker Prevalence 9.3% (7.6%, 11.2%) 11.4% (8.5%, 14.0%) 13.0% (9.5%, 15.9%)
SPR 1 1.22 (0.89, 1.63) 1.39 (1.00, 1.90)
Cholesterol Prevalence 56.3% (53.1%, 59.6%) 55.8% (51.9%, 59.6%) 60.6% (55.7%, 64.7%)
SPR 1 0.99 (0.91, 1.09) 1.08 (0.97, 1.18)
Systolic blood pressure Prevalence 27.4% (24.7%, 30.1%) 27.2% (23.8%, 30.8%) 26.1% (22.1%, 30.4%)
SPR 1 0.99 (0.75, 1.22) 0.95 (0.76, 1.26)
Notes
1. Proportion of the Australian population at ages 40 and over with high values of risk factors by geographic region, age standardised. 2. Prevalence estimated from AusDiab survey with 95% confidence intervals in brackets.
[image:6.595.56.547.541.693.2]3. Age standardised prevalence rates and Standardised Prevalence Ratios (SPR) calculated using Major City population as the standard population. 4. The high risk values for systolic blood pressure and total cholesterol were 140 mmHg and 5.5 m mol/l respectively
Table 4 Results of Cox proportional hazards regression model, males aged 40 and over
Parameter DF Estimate Standard Error Chi-Square Pr > ChiSq Hazard Ratio 95% confidence limits
Score 1 1.58 0.63 6.29 0.0121 4.83 1.41 16.55
Age 40-44 1 -4.31 1.03 17.58 < .0001 0.01 0.00 0.10
Age 45-49 1 -2.35 0.42 31.09 < .0001 0.10 0.04 0.22
Age 50-54 1 -3.10 0.55 31.99 < .0001 0.05 0.02 0.13
Age 55-59 1 -1.99 0.39 25.54 < .0001 0.14 0.06 0.30
Age 60-64 1 -1.29 0.32 16.57 < .0001 0.28 0.15 0.51
Age 65-69 1 -1.02 0.28 13.18 0.0003 0.36 0.21 0.63
Age 70-74 1 -0.53 0.24 5.11 0.0238 0.59 0.37 0.93
Adjusted Hosmer-Lemeshow goodness of fit
Chi-Square DF Pr > ChiSq
6.58 8 0.68
Notes
1. Results of a Cox proportional hazards regression model predicting risk of death prior to 1 June 2004 among male AusDiab participants aged 40 and over 2. Age group 75 and over taken as baseline group for the age parameter
For women at low risk, there is no consistent pattern in life expectancy between the Major City, Inner and Outer Regional/Remote areas–with life expectancy fall-ing between Major Cities and Inner Regional areas but rising again between Inner and Outer Regional areas. Women at high risk are more similar to their male counterparts in having a relatively steady fall in life expectancy across the Major City, Inner and Outer Regional/Remote areas. The difference in female life expectancy for those in the high risk group between Major Cities and Outer Regional/Remote areas is 2.0 years (95%CI: 1.5, 2.3) (data not shown).
The effect of modifiable risk factors on average potential years of life (APYL) in each region
Table 8 presents the APYL per person (age standar-dised) for the Australian population in 2006 by sex and region for the baseline and each risk factor target sce-nario and for all three risk factor scesce-narios together, and the differences in APYL between the baseline and each scenario.
Setting high values of each risk factor to its target increases the APYL in each region. The risk factor asso-ciated with the largest rise in APYL across all regions was high cholesterol for both men and women–with an increase in APYL of between 2.5 and 3.0 years for men and between 2.4 and 3.0 years for women. Setting all three risk factors together to no higher than their target levels led to an increase in APYL of between 6.0 and 7.3 years for men and 6.1 and 7.1 years for women. The increase was greatest in Outer Regional/Remote areas for each risk factor except for SBP in women, where the Major City and Outer Regional/Remote increases were equal.
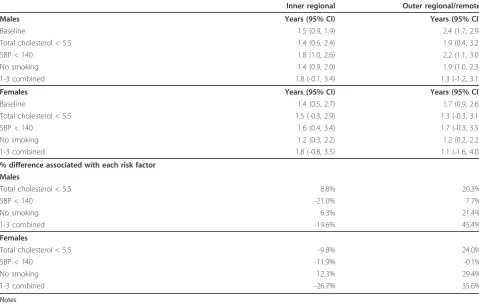
[image:7.595.56.543.98.251.2]The effect of setting each risk factor to its target on the difference in APYL between Major Cities and each other region largely followed the prevalence distribution (Table 9). For men the prevalence of smoking and high cholesterol rose by a small amount between Major Cities and Inner Regional areas and rose again by a lar-ger amount in Outer Regional areas. The prevalence of high SBP fell between Major Cities and Inner Regional
Table 5 Results of Cox proportional hazards regression model, females aged 40 and over
Parameter DF Estimate Standard Error Chi-Square Pr > ChiSq Hazard Ratio 95% confidence limits
score 1 2.32 0.80 8.42 0.0037 10.20 2.13 48.95
Age 40-44 1 -3.23 0.75 18.41 <.0001 0.04 0.01 0.17
Age 45-49 1 -2.80 0.63 19.72 <.0001 0.06 0.02 0.21
Age 50-54 1 -2.22 0.51 18.81 <.0001 0.11 0.04 0.30
Age 55-59 1 -2.55 0.63 16.57 <.0001 0.08 0.02 0.27
Age 60-64 1 -2.09 0.55 14.27 0.0002 0.12 0.04 0.37
Age 65-69 1 -1.35 0.42 10.50 0.0012 0.26 0.12 0.59
Age 70-74 1 -0.27 0.28 0.90 0.3433 0.76 0.44 1.33
Adjusted Hosmer-Lemeshow goodness of fit
Chi-Square DF Pr > ChiSq
9.37 8 0.40
Notes
1. Results of a Cox proportional hazards regression model predicting risk of death prior to 1 June 2004 among female AusDiab participants aged 40 and over 2. Age group 75 and over taken as baseline group for the age parameter
[image:7.595.59.540.584.676.2]C statistic: 84%
Table 6 Results of Cox proportional hazards regression model, males aged 65 and over
Parameter DF Estimate Standard Error Chi-Square Pr > ChiSq Hazard Ratio 95% confidence limits
score 1 1.51 0.64 5.59 0.0181 4.54 1.30 15.94
Age 65-69 1 -1.03 0.28 13.51 0.0002 0.36 0.21 0.62
Age 70-74 1 -0.54 0.24 5.24 0.022 0.58 0.37 0.93
Adjusted Hosmer-Lemeshow goodness of fit
Chi-Square DF Pr > ChiSq
12.00 8 0.21
Notes
1. Results of a Cox proportional hazards regression model predicting risk of death prior to 1 June 2004 among male AusDiab participants aged 65 and over 2. Age group 75 and over taken as baseline group for the age parameter
areas but rose again in Outer Regional areas. Accord-ingly eliminating smoking and high cholesterol was associated with a decrease in the APYL differential between Major Cities and Inner Regional areas (by 6.3% and 8.8% respectively). Eliminating high values of each of the three risk factors separately (smoking, cholesterol and SBP) was associated with a decrease in the APYL differences between Major Cities and Outer Regional/ Remote areas by 21.4%, 20.3% and 7.7% respectively. Overall the elimination of high values of cholesterol and SBP and the elimination of smoking together was asso-ciated with a fall in the differential between Major Cities and Outer Regional/Remote areas (by 45.4%) but not
with a fall in the differential between Major Cities and Inner Regional areas.
[image:8.595.58.538.100.194.2]For women, with the exception of smoking, the preva-lence of high risk factor values fell between Major Cities and Inner Regional areas. The prevalence of smoking and high cholesterol rose between Major Cities and Outer Regional/Remote areas but the prevalence of high SBP in Outer Regional/Remote areas remained below that of Major Cities. Accordingly smoking was the only risk factor whose elimination was associated with a decrease in the APYL differential between Major Cities and Inner Regional areas (by 12.3%) while eliminating each of smoking and high cholesterol was associated
Table 7 Results of Cox proportional hazards regression model, females aged 65 and over
Parameter DF Estimate Standard Error Chi-Square Pr > ChiSq Hazard Ratio 95% confidence limits
score 1 2.34 0.80 8.49 0.0036 10.33 2.15 49.67
Age 65-69 1 -1.35 0.42 10.48 0.0012 0.26 0.12 0.59
Age 70-74 1 -0.27 0.28 0.89 0.3465 0.77 0.44 1.34
Adjusted Hosmer-Lemeshow goodness of fit
Chi-Square DF Pr > ChiSq
16.11 8 0.06
Notes
1. Results of a Cox proportional hazards regression model predicting risk of death prior to 1 June 2004 among female AusDiab participants aged 65 and over 2. Age group 75 and over taken as baseline group for the age parameter
C statistic: 71%
ϯϬ͕ϬϬϬ ϰϬ͕ϬϬϬ ϱϬ͕ϬϬϬ ϲϬ͕ϬϬϬ ϳϬ͕ϬϬϬ ϴϬ͕ϬϬϬ ϵϬ͕ϬϬϬ ϭϬϬ͕ϬϬϬ
DĂũŽƌĐŝƚLJͲ ŚŝŐŚƌŝƐŬ
DĂũŽƌĐŝƚLJͲ ůŽǁƌŝƐŬ
/ŶŶĞƌƌĞŐŝŽŶĂůͲ ŚŝŐŚƌŝƐŬ
/ŶŶĞƌƌĞŐŝŽŶĂůͲ ůŽǁƌŝƐŬ
Ͳ ϭϬ͕ϬϬϬ ϮϬ͕ϬϬϬ ϯϬ͕ϬϬϬ ϰϬ͕ϬϬϬ ϱϬ͕ϬϬϬ ϲϬ͕ϬϬϬ ϳϬ͕ϬϬϬ ϴϬ͕ϬϬϬ ϵϬ͕ϬϬϬ ϭϬϬ͕ϬϬϬ
ϰϬͲϰϰ ϰϱͲϰϵ ϱϬͲϱϰ ϱϱͲϱϵ ϲϬͲϲϰ ϲϱͲϲϵ ϳϬͲϳϰ ϳϱͲϳϵ ϴϬͲϴϰ ϴϱн
DĂũŽƌĐŝƚLJͲ ŚŝŐŚƌŝƐŬ
DĂũŽƌĐŝƚLJͲ ůŽǁƌŝƐŬ
/ŶŶĞƌƌĞŐŝŽŶĂůͲ ŚŝŐŚƌŝƐŬ
/ŶŶĞƌƌĞŐŝŽŶĂůͲ ůŽǁƌŝƐŬ
KƵƚĞƌƌĞŐŝŽŶĂůͬƌĞŵŽƚĞͲ ŚŝŐŚƌŝƐŬ
KƵƚĞƌƌĞŐŝŽŶĂůͬƌĞŵŽƚĞůŽǁƌŝƐŬ
[image:8.595.58.540.419.682.2]ϯϬ͕ϬϬϬ ϰϬ͕ϬϬϬ ϱϬ͕ϬϬϬ ϲϬ͕ϬϬϬ ϳϬ͕ϬϬϬ ϴϬ͕ϬϬϬ ϵϬ͕ϬϬϬ ϭϬϬ͕ϬϬϬ
DĂũŽƌĐŝƚLJͲ ŚŝŐŚƌŝƐŬ
DĂũŽƌĐŝƚLJͲ ůŽǁƌŝƐŬ
/ŶŶĞƌƌĞŐŝŽŶĂůͲ ŚŝŐŚƌŝƐŬ
/ŶŶĞƌ ƌĞŐŝŽŶĂů Ͳ ůŽǁ ƌŝƐŬ
Ͳ ϭϬ͕ϬϬϬ ϮϬ͕ϬϬϬ ϯϬ͕ϬϬϬ ϰϬ͕ϬϬϬ ϱϬ͕ϬϬϬ ϲϬ͕ϬϬϬ ϳϬ͕ϬϬϬ ϴϬ͕ϬϬϬ ϵϬ͕ϬϬϬ ϭϬϬ͕ϬϬϬ
ϰϬͲϰϰ ϰϱͲϰϵ ϱϬͲϱϰ ϱϱͲϱϵ ϲϬͲϲϰ ϲϱͲϲϵ ϳϬͲϳϰ ϳϱͲϳϵ ϴϬͲϴϰ ϴϱн DĂũŽƌĐŝƚLJͲ ŚŝŐŚƌŝƐŬ
DĂũŽƌĐŝƚLJͲ ůŽǁƌŝƐŬ
/ŶŶĞƌƌĞŐŝŽŶĂůͲ ŚŝŐŚƌŝƐŬ
/ŶŶĞƌƌĞŐŝŽŶĂůͲ ůŽǁƌŝƐŬ
KƵƚĞƌƌĞŐŝŽŶĂůͬƌĞŵŽƚĞͲ ŚŝŐŚƌŝƐŬ
[image:9.595.56.540.89.356.2]KƵƚĞƌƌĞŐŝŽŶĂůͬƌĞŵŽƚĞůŽǁƌŝƐŬ
Figure 2Survival by region, females, Australia, 2001-2006. Number per 100,000 surviving at each age above 40 by geographic region for the lowest and highest deciles of mortality risk, Females, Australia, 2001-2006.
ϱϭ͘Ϯ
ϰϵ͘Ϭ
ϰϴ͘ϭ
ϯϱ͘ϭ
ϯϯ ϰ
ϯϮ ϴ
ϰϬ
ϰϱ
ϱϬ
ϱϱ
ϲϬ
ϲϱ
Ğ
ĞdžƉ
ĞĐƚĂŶ
ĐLJ
;LJ
ĞĂƌƐͿ
>ŽǁƌŝƐŬ
,ŝŐŚƌŝƐŬ
ϱϭ͘Ϯ
ϰϵ͘Ϭ
ϰϴ͘ϭ
ϯϱ͘ϭ
ϯϯ͘ϰ
ϯϮ͘ϴ
Ϯϱ
ϯϬ
ϯϱ
ϰϬ
ϰϱ
ϱϬ
ϱϱ
ϲϬ
ϲϱ
DĂũŽƌĐŝƚLJ
/ŶŶĞƌƌĞŐŝŽŶĂů
KƵƚĞƌƌĞŐŝŽŶĂůͬƌĞŵŽƚĞ
>ŝ
ĨĞĞdžƉ
ĞĐƚĂŶ
ĐLJ
;LJ
ĞĂƌƐͿ
>ŽǁƌŝƐŬ
,ŝŐŚƌŝƐŬ
[image:9.595.57.540.385.681.2]ϲϬ͘ϱ
ϱϳ͘Ϯ
ϱϴ͘ϴ
ϯϴ͘ϴ
ϯϳ͘ϱ
ϯϲ͘ϴ
ϰϬ
ϰϱ
ϱϬ
ϱϱ
ϲϬ
ϲϱ
Ğ
Ğdž
Ɖ
ĞĐƚ
ĂŶ
ĐLJ
;LJ
ĞĂ
ƌƐͿ
>ŽǁƌŝƐŬ
,ŝŐŚƌŝƐŬ
ϲϬ͘ϱ
ϱϳ͘Ϯ
ϱϴ͘ϴ
ϯϴ͘ϴ
ϯϳ͘ϱ
ϯϲ͘ϴ
Ϯϱ
ϯϬ
ϯϱ
ϰϬ
ϰϱ
ϱϬ
ϱϱ
ϲϬ
ϲϱ
DĂũŽƌĐŝƚLJ
/ŶŶĞƌƌĞŐŝŽŶĂů
KƵƚĞƌƌĞŐŝŽŶĂůͬƌĞŵŽƚĞ
>ŝ
ĨĞĞdž
Ɖ
ĞĐƚ
ĂŶ
ĐLJ
;LJ
ĞĂ
ƌƐͿ
>ŽǁƌŝƐŬ
[image:10.595.56.540.88.357.2],ŝŐŚƌŝƐŬ
Figure 4Life expectancy by geographic region, Females, Australia, 2001-2006. Life expectancy at age 40 by geographic region for the lowest and highest deciles of mortality risk, Females, Australia, 2001-2006.
Table 8 APYL per person at age 40 by geographic region for selected risk factor scenarios
Major city Inner regional Outer regional/remote Males Years (95% CI) Years (95% CI) Years (95% CI)
Baseline 29.4 (29.1, 29.8) 27.9 (27.6, 28.3) 27.0 (26.7, 27.8)
Total cholesterol < 5.5 31.9 (31.4, 32.5) 30.5 (29.7, 31.3) 30.0 (29.2, 31.3)
SBP < 140 31.6 (31.0, 32.1) 29.8 (29.2, 30.7) 29.4 (28.9, 30.6)
No smoking 30.4 (30.1, 30.8) 29.0 (28.6, 29.4) 28.6 (28.2, 29.4)
1-3 combined 35.7 (34.7, 36.6) 33.9 (32.9, 35.4) 34.4 (32.8, 36.5)
Females Years (95% CI) Years (95% CI) Years (95% CI)
Baseline 32.9 (32.3, 33.5) 31.5 (30.7, 32.2) 31.1 (30.4, 32.0)
Total cholesterol < 5.5 35.4 (34.5, 36.5) 33.9 (32.7, 35.6) 34.1 (32.9, 35.3)
SBP < 140 35.4 (34.5, 36.5) 33.8 (32.4, 34.9) 33.6 (32.3, 35.3)
No smoking 33.8 (33.3, 34.7) 32.6 (32.1, 33.3) 32.6 (31.9, 33.4)
1-3 combined 39.3 (38.0, 40.7) 37.5 (36.2, 39.4) 38.2 (36.2, 40.4)
Difference from baseline
Males Years (95% CI) Years (95% CI) Years (95% CI)
Total cholesterol < 5.5 2.5 (1.8, 3.2) 2.6 (1.7, 3.5) 3.0 (1.7, 4.2)
SBP < 140 2.2 (1.5, 2.9) 1.9 (1.0, 2.7) 2.4 (1.3, 3.4)
No smoking 1.0 (0.5, 1.5) 1.1 (0.6, 1.7) 1.5 (0.7, 2.3)
1-3 combined 6.3 (5.2, 7.3) 6.0 (4.6, 7.3) 7.3 (5.4, 9.3)
Females Years (95% CI) Years (95% CI) Years (95% CI)
Total cholesterol < 5.5 2.6 (1.4, 3.7) 2.4 (0.8, 4.1) 3.0 (1.5, 4.5)
SBP < 140 2.5 (1.3, 3.7) 2.3 (0.9, 3.7) 2.5 (0.8, 4.2)
No smoking 1.0 (0.0, 1.9) 1.1 (0.2, 2.1) 1.5 (0.4, 2.6)
1-3 combined 6.4 (5.0, 7.9) 6.1 (4.4, 7.8) 7.1 (4.8, 9.3)
[image:10.595.56.547.428.722.2]with a decrease in the differential between Major Cities and Outer Regional/Remote areas (by 29.4% and 20.4% respectively). Overall the elimination of high values of cholesterol and SBP and the elimination of smoking together was associated with a fall in the differential between Major Cities and Outer Regional/Remote areas (by 35.6%) but not with a fall in the differential between Major Cities and Inner Regional areas.
Discussion
Eliminating smoking and setting high values of total cholesterol and SBP to their recommended target levels increased average potential years of life per person by between 6.0 and 7.3 years for men and 6.1 and 7.1 years for women. The increase was greatest in Outer Regio-nal/Remote areas for all risk factors except for SBP in women, where the Major City increase was equal to the Outer Regional/Remote area increase.
Mortality differences between regions affect men at all risk levels but mainly apply to higher risk women. Elimi-nating smoking would reduce mortality differences between Major Cities and each other region for both men and women. In addition, reducing high cholesterol would reduce mortality differences between Major Cities
and each other region for men. Reducing high choles-terol in women or high SBP in men would reduce the mortality difference between Major Cities and Outer Regional/Remote areas but not Inner Regional areas. The combined effect of reducing high cholesterol and high SBP and eliminating smoking would reduce the APYL difference between Major Cities and Outer Regio-nal/Remote areas by 45.4% for men and 35.6% for women.
[image:11.595.57.537.101.407.2]Previous research has found a complex relationship between geographic variation in risk factors and mortal-ity. Papastergiou and colleagues found that low eco-nomic activity and access to health services were significant drivers of regional variation in all-cause mor-tality in Greece [4]. Romeri and colleagues studied regional variation in mortality in England and Wales and found that while mortality increased with depriva-tion, the relationship was strongest for smoking-related causes–suggesting an unmeasured role for smoking [5]. Men et al. analysed regional trends in Russian mortality and concluded that fluctuations in mortality correlated strongly with underlying economic and societal factors but that risk factors (particularly alcohol) played a part at an individual level [6]. Bassuk and colleagues studied
Table 9 Difference in APYL per person at age 40 between major cities and other regions
Inner regional Outer regional/remote Males Years (95% CI) Years (95% CI)
Baseline 1.5 (0.9, 1.9) 2.4 (1.7, 2.9)
Total cholesterol < 5.5 1.4 (0.6, 2.4) 1.9 (0.4, 3.2)
SBP < 140 1.8 (1.0, 2.6) 2.2 (1.1, 3.0)
No smoking 1.4 (0.9, 2.0) 1.9 (1.0, 2.3)
1-3 combined 1.8 (-0.1, 3.4) 1.3 (-1.2, 3.1)
Females Years (95% CI) Years (95% CI)
Baseline 1.4 (0.5, 2.7) 1.7 (0.9, 2.6)
Total cholesterol < 5.5 1.5 (-0.3, 2.9) 1.3 (-0.3, 3.1)
SBP < 140 1.6 (0.4, 3.4) 1.7 (-0.3, 3.5)
No smoking 1.2 (0.3, 2.2) 1.2 (0.2, 2.2)
1-3 combined 1.8 (-0.8, 3.5) 1.1 (-1.6, 4.0)
% difference associated with each risk factor Males
Total cholesterol < 5.5 8.8% 20.3%
SBP < 140 -21.0% 7.7%
No smoking 6.3% 21.4%
1-3 combined -19.6% 45.4%
Females
Total cholesterol < 5.5 -9.8% 24.0%
SBP < 140 -11.9% -0.1%
No smoking 12.3% 29.4%
1-3 combined -26.7% 35.6%
Notes
mortality in the elderly in four US communities and concluded that while individual characteristics such as health risk factors played a role, it was also important to consider community attributes that mediate or modify the pathways through which socioeconomic conditions may influence health [7]. Our study provides quantifica-tion in the Australian populaquantifica-tion of the effect of indivi-dual risk factors. However, as noted by the researchers quoted here, the individual risk factors must be viewed in the context of broader societal and economic influ-ences. Hence, while our study did not address health services, societal and economic factors, these broader factors may be the principal drivers of regional mortality differentials while the health risk factors may act as mediators.
The WHO Comparative Risk Assessment project developed methods for comparing the disease burden attributable to different health risk factors in a standar-dised way. These methods are based on the use of popu-lation attributable fractions (PAF) with a consistent theoretical framework that uses the‘hypothetical mini-mum’as the counterfactual against which burden due to a risk is calculated. They also include continuous risk variables accounting for the full range of risk from ele-vated blood pressure and serum cholesterol, rather than defining thresholds for hypertension and hypercholester-olaemia [25]. These methods have been used to develop estimates of the Australian disease burden for the major health risk factors [17]. In principle, these methods could be used to model the difference in burden between regions by examining differences in risk factor prevalence and inferring differences in disease burden. However, our methods have the strength of directly modelling the absolute effects of specific risk factors on the inter-regional difference in all-cause mortality. PAF’s are typically derived for specific causes of death and so would require separate modelling for each cause related to each risk factor and then aggregating across different causes. Our methods do, however, have the limitation of using risk factor threshold values rather than using the whole risk factor distribution. This may lead to an underestimate of the health impact of the risk factor and hence a conservative estimate of its impact on inter-regional mortality differences.
The major strength of our modelling approach is the ability to apportion mortality to percentiles of mortality risk based on measured rather than self-reported choles-terol and blood pressure values and total population and mortality counts. This allows us to model the effect of changing risk factor profiles on the distribution of risk within the population.
One limitation of our study is the use of the SCORE equation as a proxy for all-causes mortality risk. Our study requires an all-causes mortality risk prediction
equation based on the modifiable risk factors measured in our population based sample. Our literature search found two such equations in the literature which could potentially be suitable for application to our population survey data–one based on the Multiple Risk Factor Intervention Trial (MRFIT) study developed by Kannel et al. [26] and one based on the Aerobics Center Longi-tudinal Study at the Cooper Clinic in Dallas, Texas (the Cooper Clinic Mortality Risk Index) developed by Jans-sen et al. [27]. However, both of these equations were developed for men only and we need to be able to apply our risk equation to both men and women. Further, the MRFIT equation used diastolic blood pressure as its blood pressure measure rather than the more commonly used systolic blood pressure and the Cooper Clinic index incorporated an exercise stress test of cardiore-spiratory fitness which was not available in our popula-tion based sample. So neither equapopula-tion was suitable for our study.
Another limitation is that the AusDiab survey partici-pants are known to have lower mortality risk than the general Australian population, despite being drawn from a population-based random sample. However, our study relies on the ordering of risk within the population rather than the absolute level of risk and so should be relatively robust to this limitation.
A further limitation is that our study excludes Very Remote areas and does not provide separate results for Remote areas. This is a limitation of a population based modelling approach as less than three per cent of the Australian population live in Remote and Very Remote areas. Hence the numbers of people and of deaths are too small in these areas to support separate estimates using our modelling approach.
The study is limited to those risk factors incorporated in the SCORE risk prediction equation–smoking, blood pressure and cholesterol. Tobacco and blood pressure are the two leading risk factors associated with disease burden in Australia and cholesterol is the fifth (after obesity and physical inactivity), so these risk factors are appropriate for this study [17]. The exclusion of other risk factors renders our study results conservative in estimating the total contribution of modifiable risk fac-tors to life expectancy differentials. Further work in this area would benefit from developing an all-causes mor-tality risk prediction equation incorporating further risk factors.
Our study is an‘ecological’study in that it only exam-ines risk factor prevalence at the regional level and hence neglects the distribution of risk factors and life expectancy within these regions. This may also lead to underestimation of the contribution of the risk factors to the mortality differential.
Our modelling is aimed at quantifying the contribu-tion of modifiable health risk factors to regional mortal-ity differentials. Hence our estimates represent an upper bound to the gains that could be made from interven-tions targeting these risk factors rather than a projection of the actual gains from any specific health promotion activity. However, they do demonstrate that there are potentially substantial gains in health equity which could arise from addressing modifiable health risk fac-tors in outer regional and remote areas.
Conclusions
Australian mortality rates are higher in regional and remote areas than in major cities and the associated health inequities have been identified as significant human rights issues for Australia [8]. Our results sug-gest that health intervention programs aimed at smok-ing, blood pressure and total cholesterol could have a substantial impact on mortality inequities at least for Outer Regional/Remote areas.
Additional material
Additional file 1: Appendix: the risk percentiles model.
Acknowledgements
We are most grateful to the following for their support of the study: The Commonwealth Dept of Health and Aged Care, Abbott Australasia Pty Ltd, Alphapharm Pty Ltd, AstraZeneca, Aventis Pharmaceutical, Bristol-Myers Squibb Pharmaceuticals, Eli Lilly (Aust) Pty Ltd, GlaxoSmithKline, Janssen-Cilag (Aust) Pty Ltd, Merck Lipha s.a., Merck Sharp & Dohme (Aust), Novartis Pharmaceutical (Aust) Pty Ltd., Novo Nordisk Pharmaceutical Pty Ltd, Pharmacia and Upjohn Pty Ltd, Pfizer Pty Ltd, Roche Diagnostics, Sanofi Synthelabo (Aust) Pty Ltd., Servier Laboratories (Aust) Pty Ltd, BioRad Laboratories Pty Ltd, HITECH Pathology Pty Ltd, the Australian Kidney Foundation, Diabetes Australia, Diabetes Australia (Northern Territory), Queensland Health, South Australian Department of Human Services, Tasmanian Department of Health and Human Services, Territory Health Services and Victorian Department of Human Services and Health Department of Western Australia. Also, for their invaluable contribution to the set-up and field activities of AusDiab, we are enormously grateful to A Allman, B Atkins, S Bennett, S Chadban, S Colagiuri, M de Courten, M Dalton, M D’Embden, D Dunstan, T Dwyer, D Jolley, I Kemp, P Magnus, J Mathews, D McCarty, A Meehan, K O’Dea, P Phillips, P Popplewell, C Reid, A Stewart, R Tapp, H Taylor, T Welborn, F Wilson and P Zimmet.
This work was supported by a National Health and Medical Research Council Grant Number 465130, an NHMRC/NHF PhD scholarship and a Vichealth Fellowship. We are grateful to Karen Bishop of the AIHW for her assistance in compiling and interpreting the mortality data and to Kathryn Backholer for her comments on earlier drafts of the paper.
Author details
1
School of Public Health and Preventive Medicine, Monash University, The Alfred Centre, 99 Commercial Road, Melbourne, Victoria, Australia.2Baker IDI Heart and Diabetes Institute, The Alfred Centre, 99 Commercial Road, Melbourne, Victoria, Australia.
Authors’contributions
CES conceived of the study, carried out the statistical analyses and drafted the manuscript. HM programmed the SAS macros to calculate the Harrel’s C and modified Hosmer-Lemeshow statistics. CES, HM, AP, HW and JJM collaborated on the study design. DJM and JES provided the population survey data and advice on its interpretation. All authors participated in revisions of the draft manuscript. All authors read and approved the final manuscript.
Competing interests
The authors declare that they have no competing interests.
Received: 16 February 2011 Accepted: 25 January 2012 Published: 25 January 2012
References
1. Australian Institute of Health and Welfare (AIHW):Rural, regional and remote health: indicators of health status and determinants of health. Rural Health Series no. 9. Cat. no. PHE 97Canberra: AIHW; 2008.
2. Australian Institute of Health and Welfare (AIHW):Rural, regional and remote health: indicators of health system performance. Rural Health Series no. 10. Cat. no. PHE 103Canberra: AIHW; 2008.
3. Mathur S, Moon L, Leigh S:Aboriginal and Torres Strait Islander people with coronary heart disease: further perspectives on health status and treatment. Cardiovascular diseases series no. 25. Cat. no. CVD 33Canberra: Australian Institute of Health and Welfare; 2006.
4. Papastergiou P, Rachiotis G, Polyzou K, Zilidis C, Hadjichristodoulou C:
Regional differences in mortality in Greece (1984-2004): the case of Thrace.BMC Public Health2008,8(1):297.
6. Men T, Brennan P, Boffetta P, Zaridze D:Russian mortality trends for 1991-2001: analysis by cause and region.BMJ2003,327(7421):964.
7. Bassuk SS, Berkman LF, Amick BC III:Socioeconomic status and mortality among the elderly: findings from four US communities.Am J Epidemiol 2002,155(6):520-533.
8. Rural health.[http://www.hreoc.gov.au/HUMAN_RIGHTS/rural_health/index. html].
9. McNeil JJ, Peeters A, Liew D, Lim S, Vos T:A model for predicting the future incidence of coronary heart disease within percentiles of coronary heart disease risk.J Cardiovasc Risk2001,8(1):31-37. 10. Australian Bureau of Statistics (ABS):ABS views on remoteness. Information
paper. ABS cat. no. 1244.0Canberra: ABS; 2001.
11. Dunstan DW, Zimmet PZ, Welborn TA, Cameron AJ, Shaw J, de Courten M, Jolley D, McCarty DJ:The Australian diabetes, obesity and lifestyle study (AusDiab)-methods and response rates.Diabetes Res Clin Pract2002,
57(2):119-129.
12. Conroy RRM, Pyörälä KK, Fitzgerald AAP, Sans SS, Menotti AA, De Backer GG, De Bacquer DD, Ducimetière PP, Jousilahti PP, Keil UU,et al:
Estimation of ten-year risk of fatal cardiovascular disease in Europe: the SCORE project.Eur Heart J2003,24(11):987-1003.
13. Aktas MK, Ozduran V, Pothier CE, Lang R, Lauer MS:Global risk scores and exercise testing for predicting all-cause mortality in a preventive medicine program.JAMA2004,292(12):1462-1468.
14. Barr ELM, Magliano DJ, Zimmet PZ, Polkinghorne KR, Atkins RC,
Dunstan DW, Murray SG, Shaw JE:AusDiab 2005: The Australian Diabetes, Obesity and Lifestyle Stud.Melbourne: International Diabetes Institute; 2006.
15. Harrell FE Jr, Lee KL, Mark DB:Multivariable prognostic models: issues in developing models, evaluating assumptions and adequacy, and measuring and reducing errors.Stat Med1996,15(4):361-387. 16. D’Agostino RB, Nam BH:Evaluation of the performance of survival
analysis models: discrimination and calibration measures.InHandbook of Statistics. Volume 23.Amsterdam, The Netherlands: Elsevier; 2004:1-25. 17. Begg S, Vos T, Barker B, Stevenson CE, Stanley L, Lopez AD:The burden of
disease and injury in Australia 2003. cat. no. PHE 82Canberra: AIHW; 2007. 18. Chiang CL:The life table and its applicationsMalabar, Florida: Robert E.
Krieger Publishing Company, Inc; 1984.
19. Australian Institute of Health and Welfare (AIHW):Heart, stroke and vascular diseases–Australian facts 2004. AIHW Cat. No. CVD 27Canberra: AIHW and National Heart Foundation of Australia (Cardiovascular Disease Series No. 22); 2004.
20. Guide to management of hypertension 2008. Updated August 2009. Web version.[http://www.heartfoundation.org.au/Professional_Information/ Clinical_Practice/Hypertension/Pages/default.aspx].
21. National Heart Foundation of Australia and The Cardiac Society of Australia and New Zealand:Lipid management guidelines - 2001.Med J Aust2001,
175:s57-s88.
22. Cleveland WS, Devlin SJ, Grosse E:Regression by local fitting.Journal of Econometrics1988,37:87-114.
23. Efron B, Tibshirani R:Bootstrap methods for standard errors, confidence intervals, and other measures of statistical accuracy.Sta Sci1986,
1(1):54-77.
24. Hosmer DW, Lemeshow S:Applied Logistic regression.2 edition. New York: Wiley; 2000.
25. Ezzati M, Lopez A, Rodgers A:Murray CJ: Comparative quantification of health risks: global and regional burden of disease attributable to selected major risk factorsGeneva: World Health Organization; 2004.
26. Kannel WB, Neaton JD, Wentworth D, Thomas HE, Stamler J, Hulley SB, Kjelsberg MO:Overall and coronary heart disease mortality rates in relation to major risk factors in 325,348 men screened for the MRFIT.Am Heart J1986,112(4):825-836.
27. Janssen I, Katzmarzyk PT, Church TS, Blair SN:The Cooper Clinic Mortality Risk Index: Clinical Score Sheet for Men.Am J Prev Med2005,
29(3):194-203.
28. Australian Bureau of Statistics (ABS):Causes of Death, 2008Canberra: ABS; 2010.
Pre-publication history
The pre-publication history for this paper can be accessed here: http://www.biomedcentral.com/1471-2458/12/79/prepub
doi:10.1186/1471-2458-12-79
Cite this article as:Stevensonet al.:The effect of modifiable risk factors
on geographic mortality differentials: a modelling study.BMC Public
Health201212:79.
Submit your next manuscript to BioMed Central and take full advantage of:
• Convenient online submission
• Thorough peer review
• No space constraints or color figure charges
• Immediate publication on acceptance
• Inclusion in PubMed, CAS, Scopus and Google Scholar
• Research which is freely available for redistribution